Embed Size (px)
Citation preview

Where’s the Disconnect? Analyzing barriers to web-based e-participation tools for planning
Cullen Meves

Research Purpose and Goals Track current use of e-participation tools in planning
Planning & Community Development Departments serving populations of 100,000 or less
Benchmark study of which tools and how often
Identify barriers to further incorporation of e-participation tools Barriers identified through literature review, personal
experience, and survey/interview responses Solutions suggested based on research, interview response,
and personal experience

Research Purpose and Goals Identify trends for how e-participation tools are being
utilized based on: Population size Regional location Level of government Population density Mean age of population Median age of population

Research Methods Literature Review
Extensive review of benchmark studies
Online Survey 349 respondents
Phone Interviews 8 respondents
Survey Results Analysis Included Chi Square Test
Analysis
Source: Image created by C. Meves
e-Participation: Information Sharing Tools
Source: http://www.archuletacounty.org/index.aspx?nid=93

e-Participation: Information Gathering Tools
Source: http://www.hawaiicountycdp.info/puna-cdp/take-the-pahoa-regional-town-center-plan-online-survey-here

e-Participation: Collaborative Tools
Source: http://speakupaustin.org/ideas
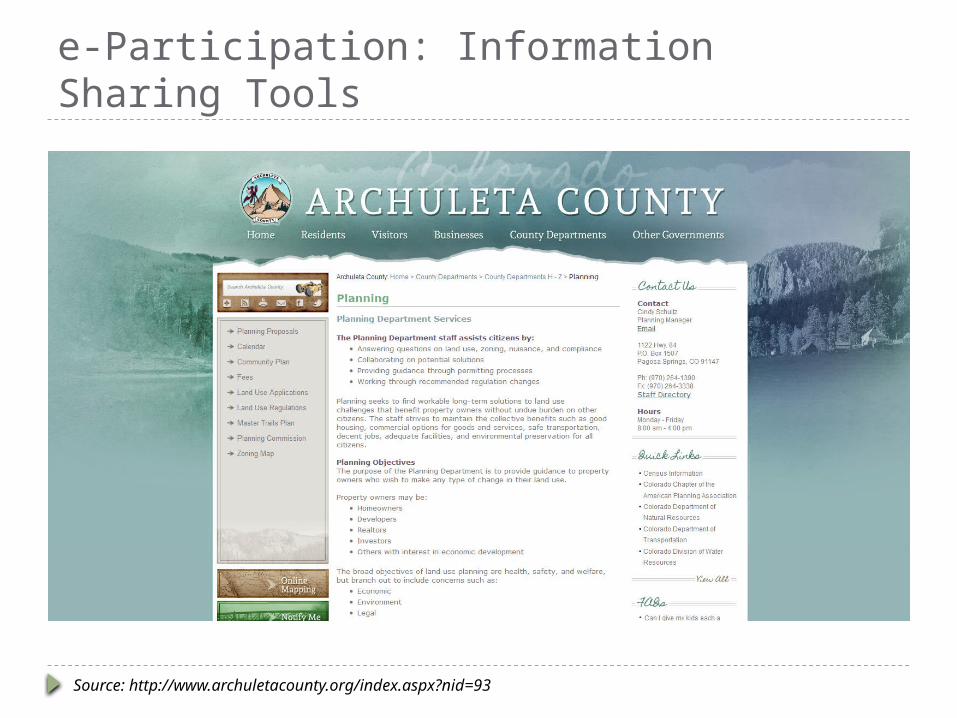
Information and Services available on Planning Department Websites
Source: (Evans-Cowley et al., 2011)

Growth Patterns of Selected Web 2.0 Developments
Source: (Pascu et al., 2008)

GROWTH PATTERNS OF PEER-TO-PEER TECHNOLOGIES
Planning Departments need to be involved in the dialogue.
Source: (Pascu et al., 2008)

THE DISCUSSION IS HAPPENING ELSEWHERE
Source: http://www.ibrattleboro.com/

Survey
Combined Total of County and Places for each Population Segment in the U.S. and Associated Sample SizePopulation Segment Total
% of Previous
Segment
Sample
Size
% of
Previous
Segment
Final
Response
Rate
Total 10,840 847
3,000-20,000 7,779 71.76% 500 59.03% 39.60%
20,001-40,000 1,764 22.68% 200 40.00% 41.50%
40,001-60,000 694 39.34% 79 39.50% 45.57%
60,001-80,000 373 53.75% 42 53.16% 35.71%
80,001-100,000 230 61.66% 26 61.90% 42.31%
The final response rate was fairly consistent across all population segments

Characteristics of Survey RespondentsStates Represented 45
Jurisdiction
Breakdown
City 220
Region A Breakdown County 76
Alaska/Pacific 4 Town 28
Midwest 101 Village 19
Northeast 33
Southeast 86
Southwest 20 Population Range Breakdown
West 99 3,000-20,000 198
20,001-40,000 83
Region B Breakdown 40,001-60,000 36
Central Plaines 18 60,001-80,000 15
Great Lakes 80 80,001-100,000 11
Mid Atlantic 22
Northeast 22
Pacific 33 Other Demographic Ranges
Pacific Alaska 37 Population Density
(people per sq mi)2 - 18,229
Rocky Mountain 39
Southeast 73
Median Household
Income
$20,379 -
$203,438
Southwest 19 Median Age 22.7 - 57.2
Excellent representation in across all studied characteristics

Characteristics of Departments Interviewed
Jurisdicti
on
Population Range Region Funding Level Priority
Level
County 3,000-20,000 West $0 Very Low
County 3,000-20,000 Southeast $0 High
Village 3,000-20,000 Southeast Do not know Very Low
City 3,000-20,000 Southeast No response No response
City 20,001-40,000 Midwest Do not know High
County 20,001-40,000 Northeast $1-$2,000 Neutral
City 40,001-60,000 West $2,000-$5,000 Neutral
County 60,001-80,000 Midwest Do not know High
Selected interviewees to represent a range of reported priority levels

Survey and Interview Results

Q5
How does your department share electronic output with the public?
All examples of information sharing tools. Individual project websites were second after email alerts.

Q6
How does your department receive electronic input from the public?
Combination of information gathering tools and collaborative tools. Note the significant drop off in use rates.

Q7
How are your public meetings and presentations available to the public, other than by attending in person?
Surprising response rate for departments offering online live-streaming video.

Q8
In the following table, please indicate how often your department uses each web-based method for providing public access to this material.
Very low use rates for all collaborative e-participation tools.

Interview Responses
Department Website’s Visibility 1) Have you tried any methods for publicizing web-based participation initiatives?
Yes 3 No 4 Planned in the Future 1
Announced a public meetings 2 Included in published information 3Targeted Mailing 1 Press Release 2
If yes, what avenues have you tried for publicizing web-based participation initiatives, and which have been most effective?
Postcard mailings, Providing headline updates on website, Including the URLs in every Press Release, Press Releases about initiatives in general
2) What types of web-based outlets have you used to engage the public? Department Website 7 Online Surveys 1 Project Website 2
Online Video of Meetings 2 Social Media 1
Departments that had publicized their website(s) said they noticed the results of this effort.

Interview Responses
Department Website’s Current Information Dissemination and Maintenance 1) Are updates to the information provided on the web-site handled within the department or by an outside source?Within Department 5 Outside Source 2 Both 1
If the website is maintained by an outside source, how much interaction does the department have with this source?Very Little 3
If the website is maintained by an outside source, do you see this as a barrier to incorporating more interactive tools into the department website?
Yes 1 No 1 Unsure 1
2) How much time a week does a staff member devote to maintaining and updating planning related news for the website or transmitting information to the web-developer?0-2 Hours 6 2-5 Hours 1 5+ Hours 0 NA 1
3) Do you see the time element of updating these outlets as barrier to using more web-based interactive tools? Yes 4 No 4 NA 0
The majority of departments were handling website updates within the department.
Interview Responses
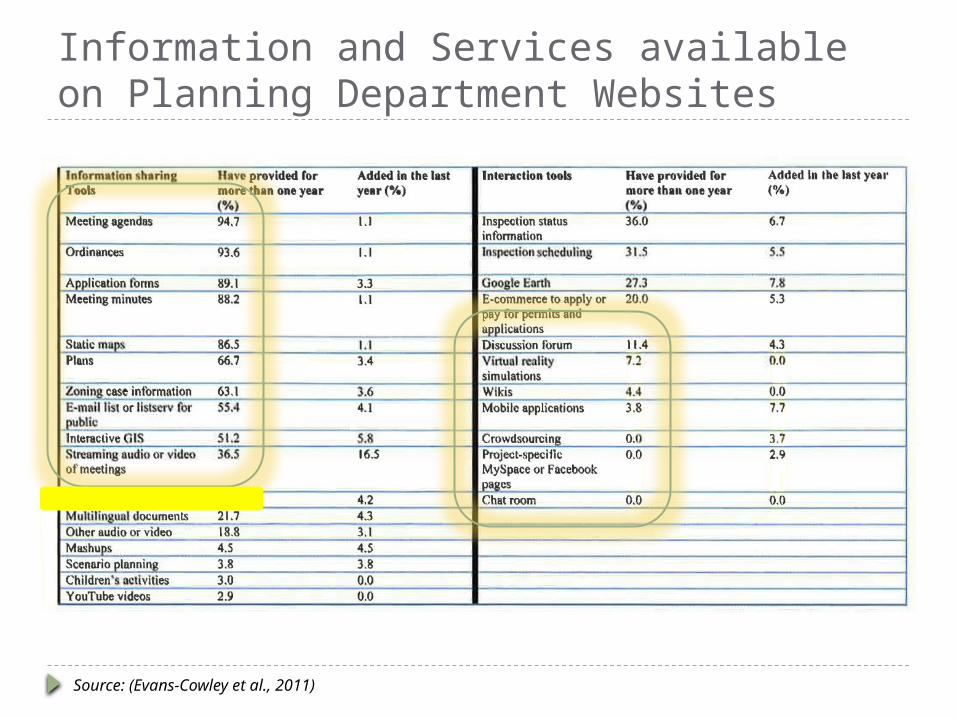
External Barriers to Web-based Interactive Tools
1) According to the Pew Research Center Study on Online Government conducted in 2009, “Two in five home broadband users (39%) prefer online contact when trying to reach government, compared with 23% of home dial-up users.”[1] Do you know how many residents within your community have broadband access?
50% or Greater 2 Less than 50% 3 Do not know 3
Do you see this as a limiting factor for engaging the public through online tools? Yes 6 No 2
2) Are there language or disability barriers for residents using the tools on the department’s website? Language Barriers Disability Barriers
Yes 7 No 1 Yes 0 No 4Do not know 0 Do not know 4
3) Have you encountered learning curve issues for individuals wishing to use available interactive tools? Yes 6 No 2 Do not know
Note: Most departments made reference to the fact that their population consisted of a large elderly population when discussing learning curve issues of interactive tools.

Interview Response
Department Website’s Interactive Capabilities 1) What do you find is the most difficult part of maintaining or updating these websites? Using the Wedpage Platform 3Keeping information up to date 1Finding time to update the page 3Interfacing with website technician 2Gathering and formatting data for the website 2Have not had difficulties 1
2) Have you had issues with the anonymity aspect of web-based commenting and forums, as in finding more negativity or inappropriateness in web-based comments and postings?
Yes 2 No 5 NA 1
3) Would having an identity/email based login to the commenting area of the website help with this issue? Yes 5 No 2 NA 1
A wide variety of issues were cited when asked about difficulties maintaining department websites.

Q9
In the following table, please indicate how strongly you feel each description limits incorporation of web-based, e-participation tools into the public participation process.
Limited budgets had the highest percentage of “extremely limits use” votes, while limited staff time had the highest percentage of combined votes for “extremely limits use” and “somewhat limits use.”
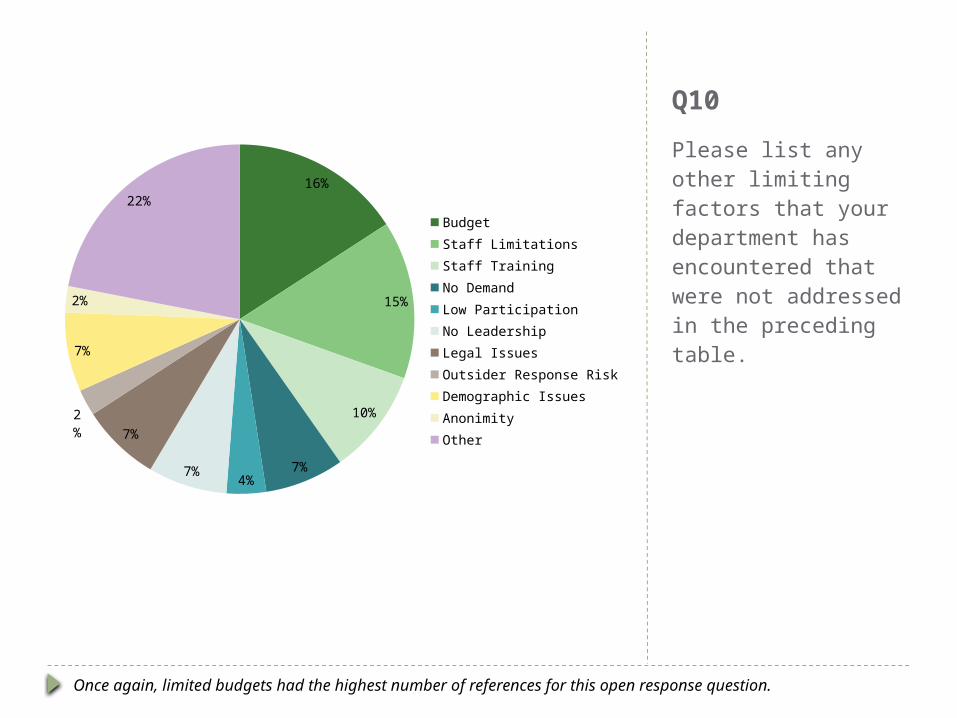
Q10
Please list any other limiting factors that your department has encountered that were not addressed in the preceding table.
16%
15%
10%
7%4%
7%
7%
2%
7%
2%
22%
BudgetStaff LimitationsStaff TrainingNo DemandLow ParticipationNo LeadershipLegal IssuesOutsider Response RiskDemographic IssuesAnonimityOther
Once again, limited budgets had the highest number of references for this open response question.

Q12
How high of a priority for your department is incorporating web-based, e-participation tools into the public participation process?
1- Very Low
2- Low
3- Neutral
4- High
5- Very High
0 20 40 60 80 100 120
Except for the response of “very high,” the response distribution for this question was fairly even.

CHI-SQUARE TEST RESULTS FOR PRIORITY LEVEL AND FUNDING LEVELS
Chi-Square Tests
Value dfAsymp. Sig. (2-
sided)Pearson Chi-Square 36.894a 4 .000
Likelihood Ratio 33.928 4 .000
Linear-by-Linear Association 28.400 1 .000
N of Valid Cases 271
a. 0 cells (.0%) have expected count less than 5. The minimum expected count is 7.89.
Priority level and funding level for e-participation tools have an very strong, statistically significant association.

Chi-Square Test Results
Pearson Chi-Square Values for Priority Level as Dependent Characteristic
Independent
Characteristic
Dependent
Characteristic
Pearson
Chi-
Square
Value df
Asymp.
Sig Note
Region Priority Level 6.962 4 0.138 0 cells (.0%) have expected count
less than 5. The minimum expected
count is 27.91
Jurisdiction Priority Level 2.765 2 0.251 0 cells (.0%) have expected count
less than 5. The minimum expected
count is 20.54
Population Range Priority Level 1.286 6 0.972 0 cells (.0%) have expected count
less than 5. The minimum expected
count is 6.75
Population Density Priority Level 3.496 4 0.479 0 cells (.0%) have expected count
less than 5. The minimum expected
count is 29.26
Median Income Priority Level 6.823 4 0.146 1 cells (11.1%) have expected count
less than 5. The minimum expected
count is 4.80
Median Age Priority Level 2.777 2 0.249 0 cells (.0%) have expected count
less than 5. The minimum expected
count is 31.89
Respondent Title Priority Level 4.904 2 0.086 0 cells (.0%) have expected count
less than 5. The minimum expected
count is 32.65
Priority level demonstrated no other statistically significant associations with any of the other characteristics studied.

Interview Results
Department Website’s Interactive Capabilities 4) Have you noticed any correlation between the way the information is presented on the website and the amount of traffic and interaction it receives (i.e. a PDF of a report vs. an illustrated poster or guide vs. a 3D or virtual representation)?
Yes 6 No 0 NA 1
5) What would you say has been the most effective presentational mode for information presented on the website?Brief reports or summaries of the information 2A mix of reports and visual information 4Having a headline for updated information on the homepage 1NA 1
6) Do you see providing live-streaming video of public meetings on the website as a viable option in the future? Yes 5 No 2 Already doing this 1
7) Which web-based interactive tools do you see as having the greatest benefit to your department and your community?Online application forms 2Using a program like MindMixer 2Using the website as a depository for information 1Using Social Media 2Visualization tools like maps and 3D representations 2
The responses demonstrate a breadth of understanding and forward thinking for e-participation tools that was not expected.

Conclusions Provided an additional
benchmark study for a previously unstudied area
Identified four major barriers Inadequate budgets Staff time Staff training Learning curve for the
public
Future developments in user-friendliness of platforms and user experience may naturally reduce the barrier level of some of these challenges.

Conclusions Interviews provided greater
depth of insight into nuances of barriers
No obvious trends have developed with regards to characteristics studied
Possible new trends in survey responses Increased use of project
websites High levels of video streaming Higher than expected tech
savvy-ness
The comfort level of planners in their use and interaction with web-based tools demonstrated a higher affinity than was expected.