Embed Size (px)
Citation preview
2013 ON-BOARD
PASSENGER SURVEY
Overview Presentation
VTA Board of Director’s Meeting
May 1, 2014
Agenda Item # 7.2
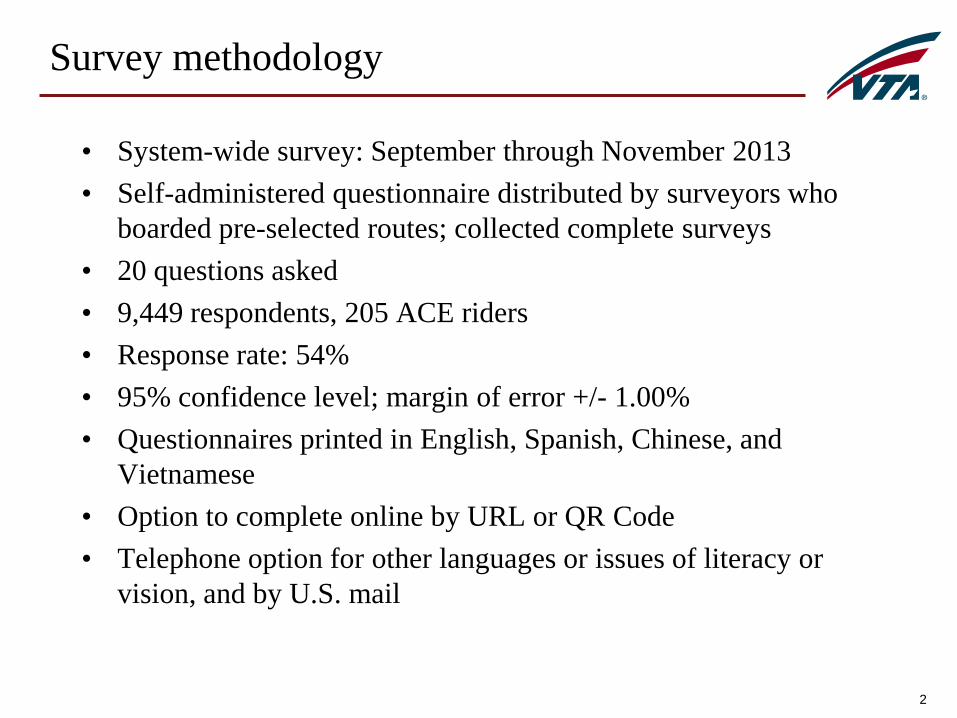
Survey methodology
• System-wide survey: September through November 2013
• Self-administered questionnaire distributed by surveyors who
boarded pre-selected routes; collected complete surveys
• 20 questions asked
• 9,449 respondents, 205 ACE riders
• Response rate: 54%
• 95% confidence level; margin of error +/- 1.00%
• Questionnaires printed in English, Spanish, Chinese, and
Vietnamese
• Option to complete online by URL or QR Code
• Telephone option for other languages or issues of literacy or
vision, and by U.S. mail
2
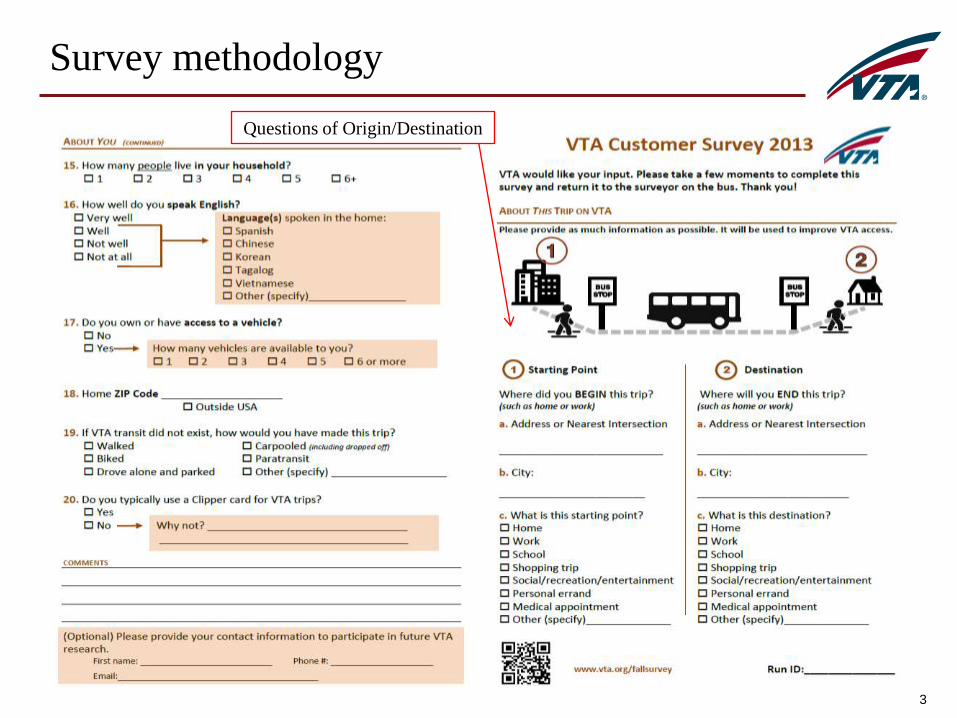
Survey methodology
3
Questions of Origin/Destination
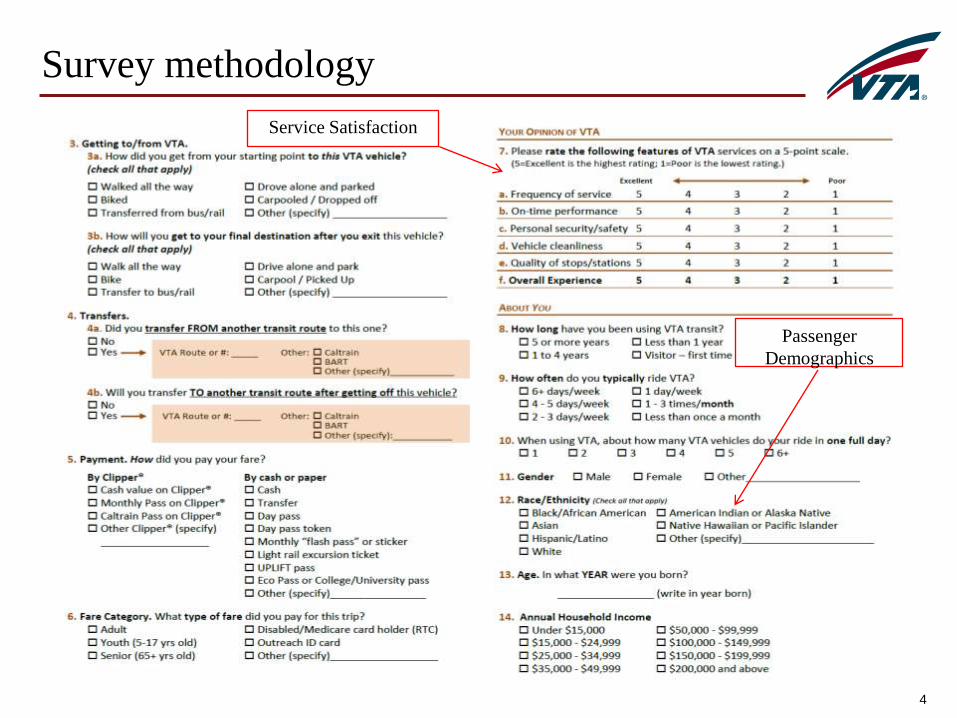
Survey methodology
4
Service Satisfaction
Passenger
Demographics
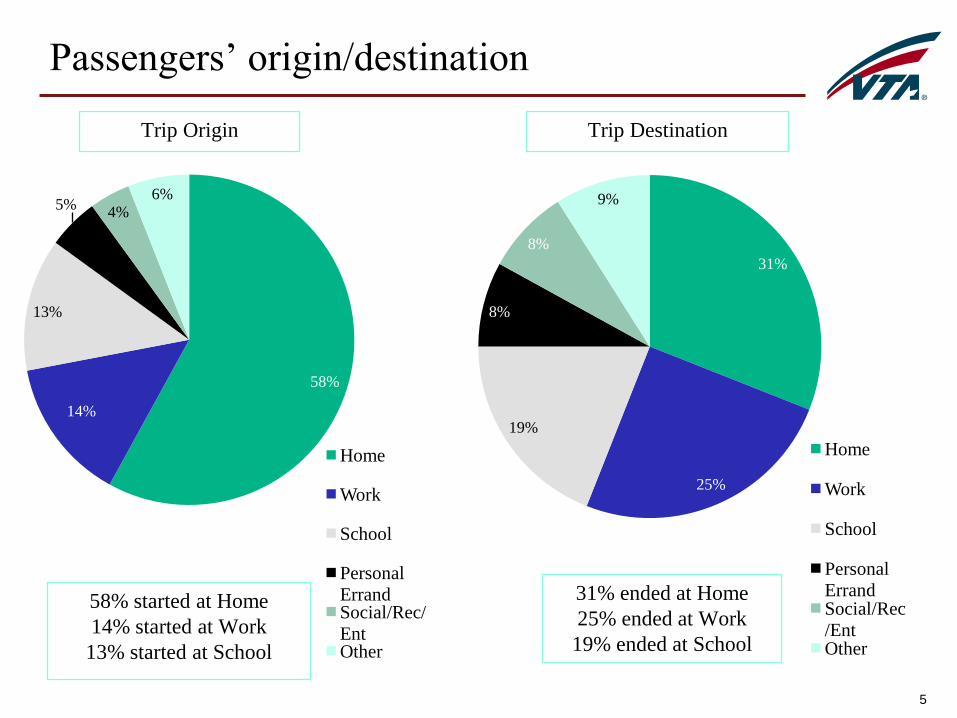
Passengers’ origin/destination
5
58%
14%
13%
5%4%
6%
Home
Work
School
Personal
ErrandSocial/Rec/
EntOther
Trip Origin
58% started at Home
14% started at Work
13% started at School
31%
25%
19%
8%
8%
9%
Home
Work
School
Personal
ErrandSocial/Rec
/EntOther
Trip Destination
31% ended at Home
25% ended at Work
19% ended at School
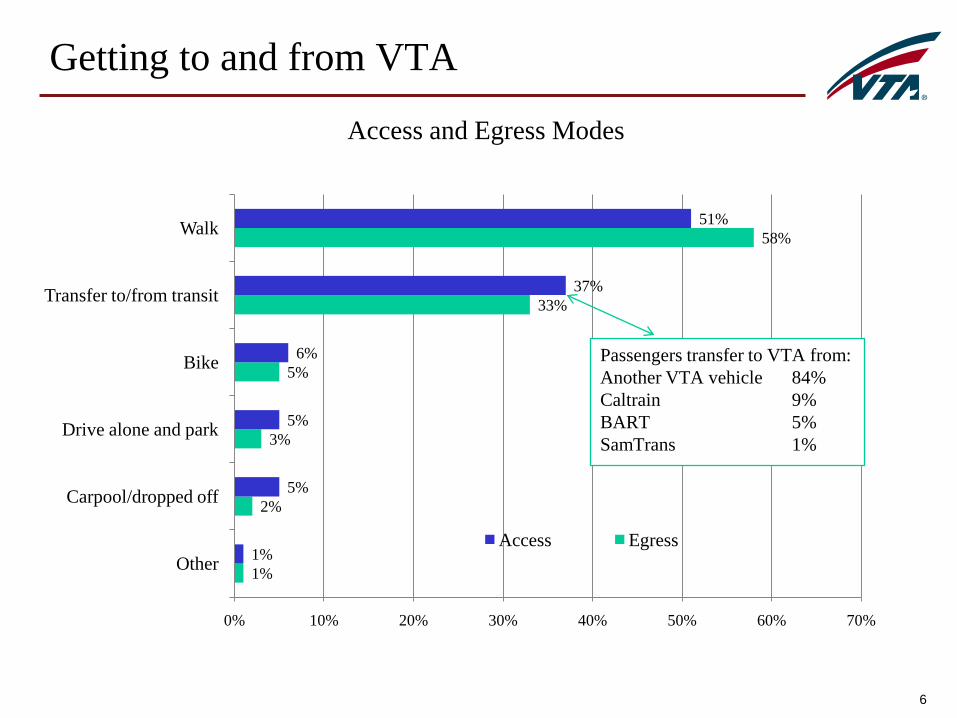
Getting to and from VTA
6
1%
2%
3%
5%
33%
58%
1%
5%
5%
6%
37%
51%
0% 10% 20% 30% 40% 50% 60% 70%
Other
Carpool/dropped off
Drive alone and park
Bike
Transfer to/from transit
Walk
Access and Egress Modes
Access Egress
Passengers transfer to VTA from:
Another VTA vehicle 84%
Caltrain 9%
BART 5%
SamTrans 1%
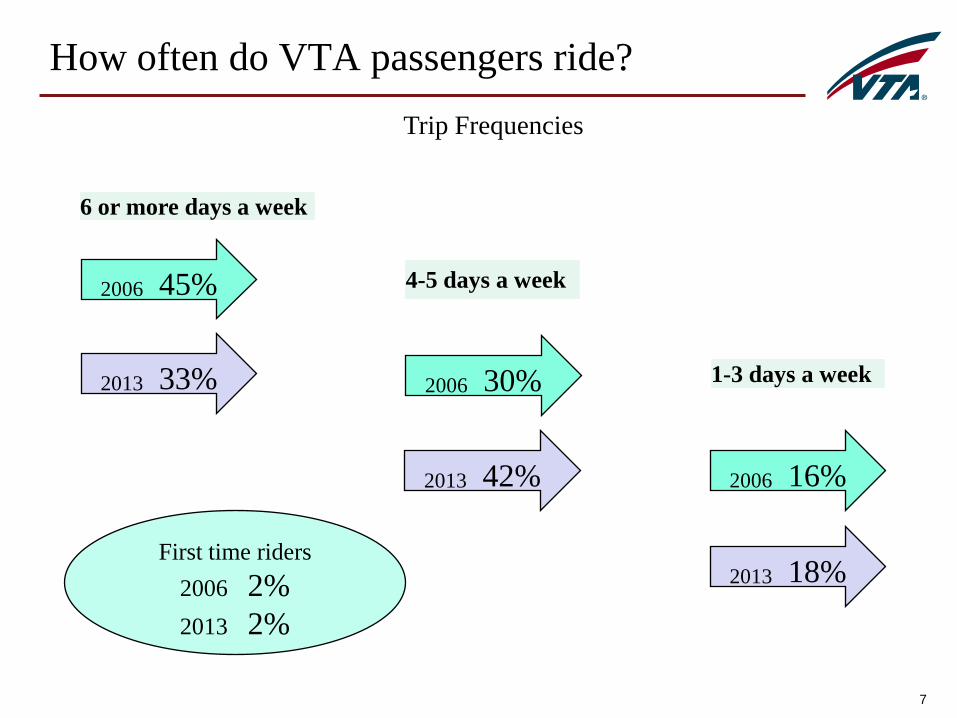
How often do VTA passengers ride?
7
6 or more days a week
2013 33%
2006 45%
1-3 days a week2006 30%
2013 42% 2006 16%
2013 18%
4-5 days a week
First time riders
2006 2%
2013 2%
Trip Frequencies

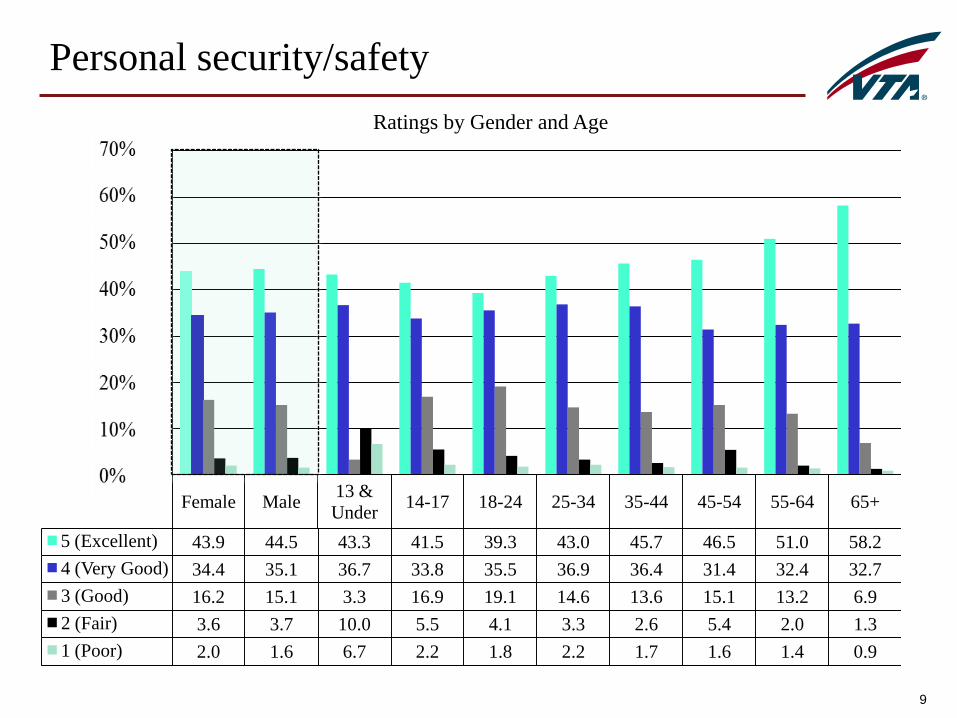
Personal security/safety
Female Male13 &
Under14-17 18-24 25-34 35-44 45-54 55-64 65+
5 (Excellent) 43.9 44.5 43.3 41.5 39.3 43.0 45.7 46.5 51.0 58.2
4 (Very Good) 34.4 35.1 36.7 33.8 35.5 36.9 36.4 31.4 32.4 32.7
3 (Good) 16.2 15.1 3.3 16.9 19.1 14.6 13.6 15.1 13.2 6.9
2 (Fair) 3.6 3.7 10.0 5.5 4.1 3.3 2.6 5.4 2.0 1.3
1 (Poor) 2.0 1.6 6.7 2.2 1.8 2.2 1.7 1.6 1.4 0.9
9
Ratings by Gender and Age
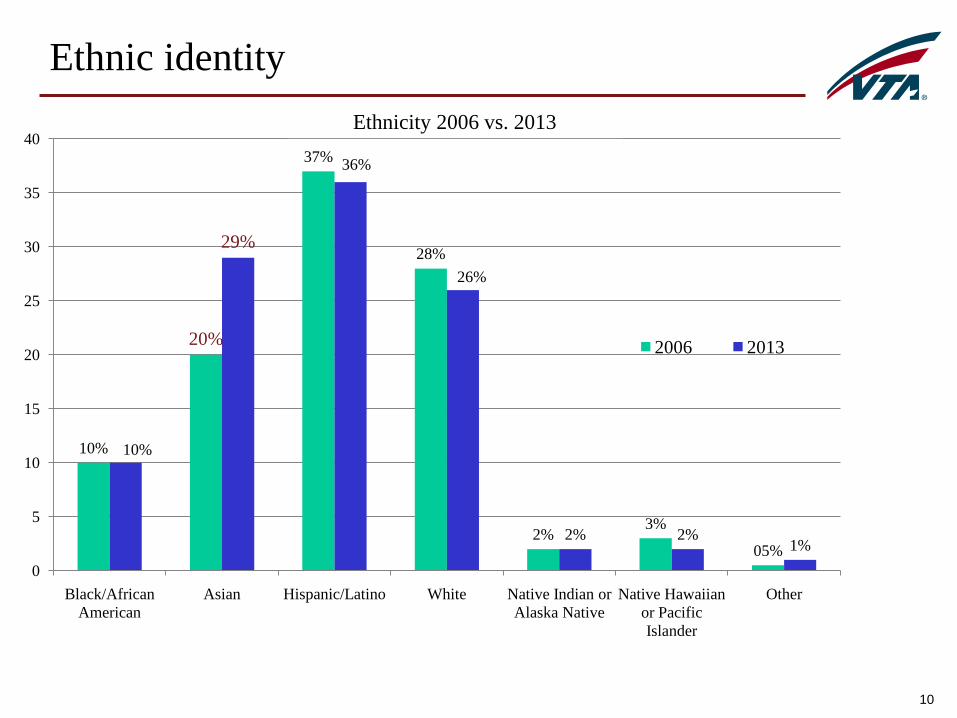
Ethnic identity
10
10%
20%
37%
28%
2%3%
05%
10%
29%
36%
26%
2% 2%1%
0
5
10
15
20
25
30
35
40
Black/African
American
Asian Hispanic/Latino White Native Indian or
Alaska Native
Native Hawaiian
or Pacific
Islander
Other
2006 2013
Ethnicity 2006 vs. 2013
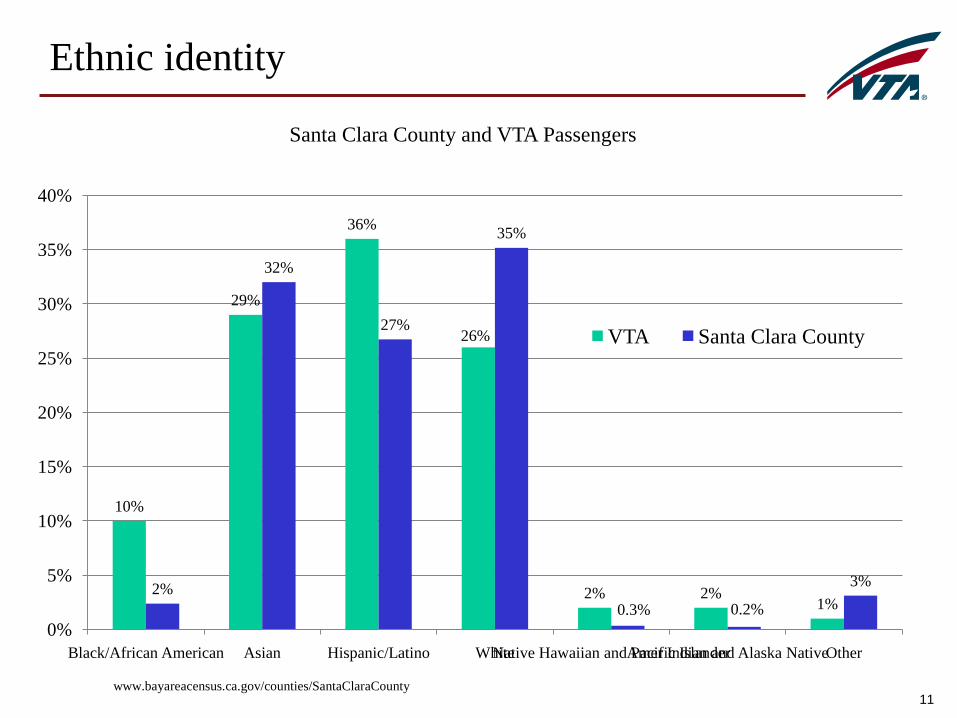
Ethnic identity
11
10%
29%
36%
26%
2% 2%1%
2%
32%
27%
35%
0.3% 0.2%
3%
0%
5%
10%
15%
20%
25%
30%
35%
40%
Black/African American Asian Hispanic/Latino WhiteNative Hawaiian and Pacific IslanderAmer Indian and Alaska NativeOther
Santa Clara County and VTA Passengers
VTA Santa Clara County
www.bayareacensus.ca.gov/counties/SantaClaraCounty
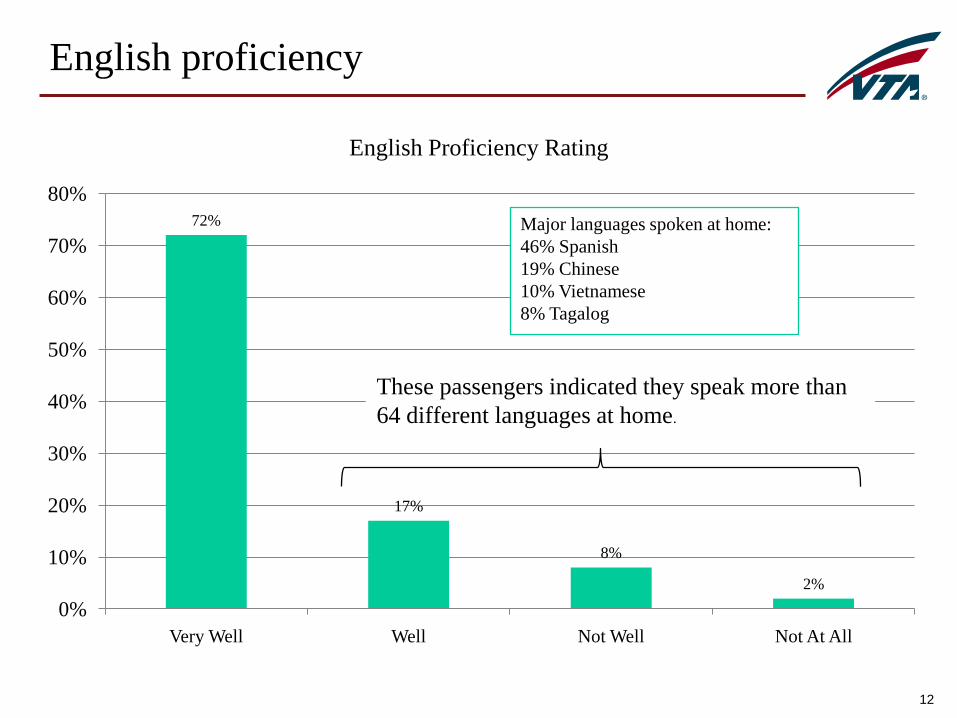
English proficiency
12
72%
17%
8%
2%
0%
10%
20%
30%
40%
50%
60%
70%
80%
Very Well Well Not Well Not At All
These passengers indicated they speak more than
64 different languages at home.
English Proficiency Rating
Major languages spoken at home:
46% Spanish
19% Chinese
10% Vietnamese
8% Tagalog
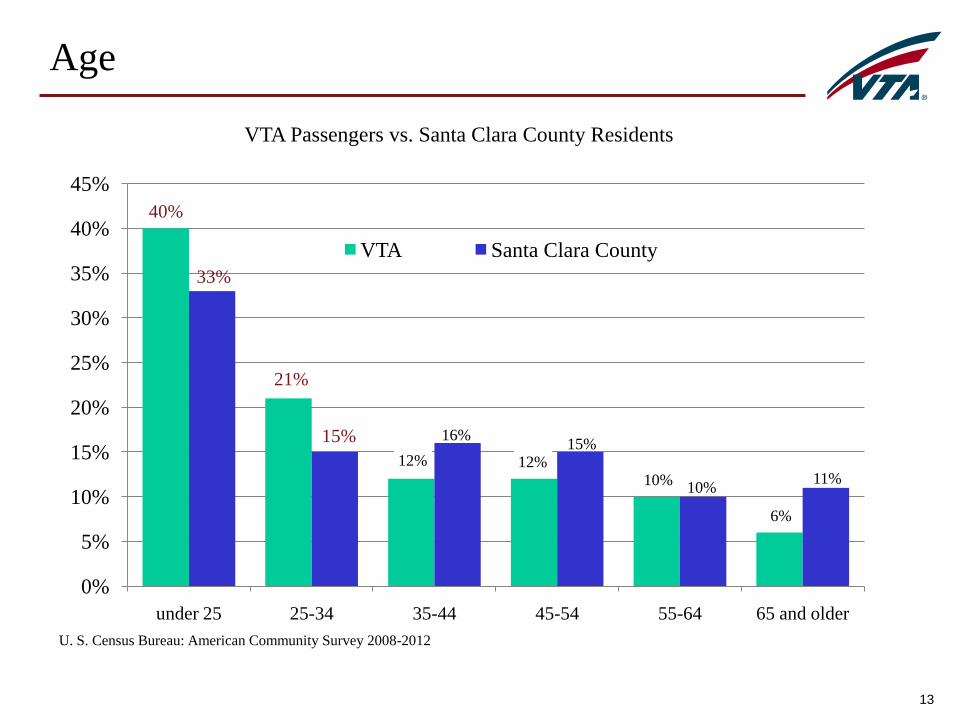
Age
13
40%
21%
12% 12%10%
6%
33%
15% 16%15%
10%11%
0%
5%
10%
15%
20%
25%
30%
35%
40%
45%
under 25 25-34 35-44 45-54 55-64 65 and older
VTA Passengers vs. Santa Clara County Residents
VTA Santa Clara County
U. S. Census Bureau: American Community Survey 2008-2012
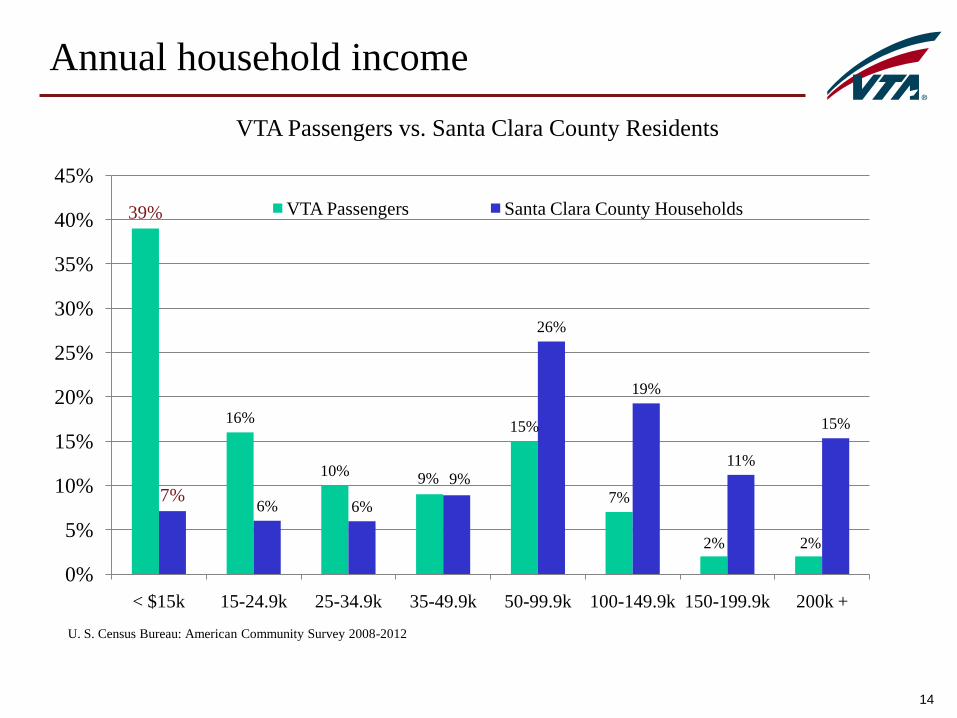
Annual household income
14
39%
16%
10%9%
15%
7%
2% 2%
7%6% 6%
9%
26%
19%
11%
15%
0%
5%
10%
15%
20%
25%
30%
35%
40%
45%
< $15k 15-24.9k 25-34.9k 35-49.9k 50-99.9k 100-149.9k 150-199.9k 200k +
VTA Passengers vs. Santa Clara County Residents
VTA Passengers Santa Clara County Households
U. S. Census Bureau: American Community Survey 2008-2012
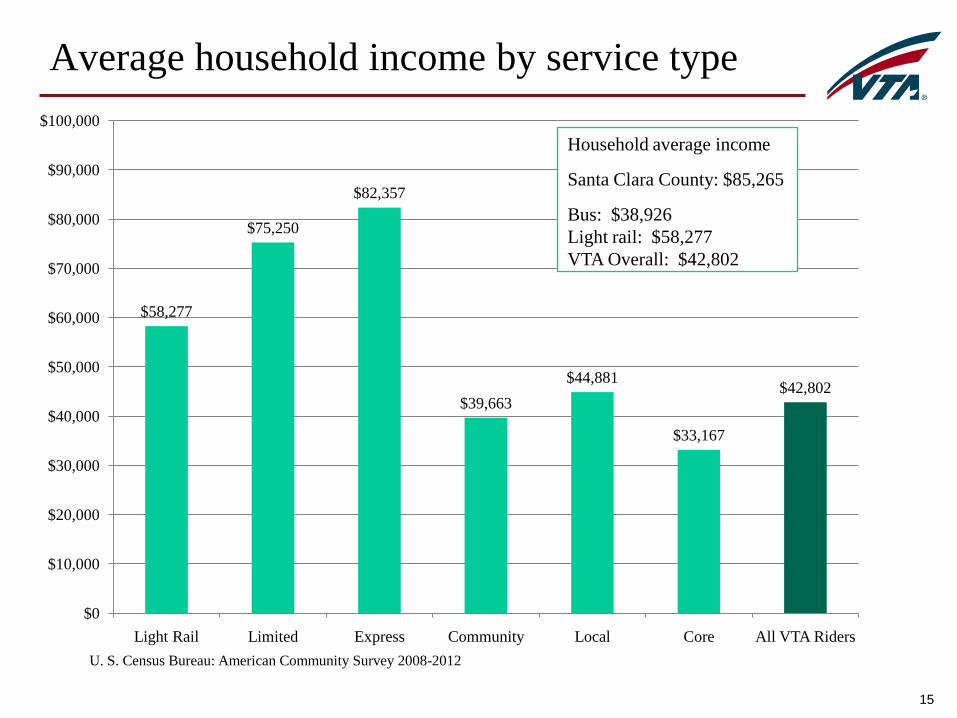
Average household income by service type
15
$58,277
$75,250
$82,357
$39,663
$44,881
$33,167
$42,802
$0
$10,000
$20,000
$30,000
$40,000
$50,000
$60,000
$70,000
$80,000
$90,000
$100,000
Light Rail Limited Express Community Local Core All VTA Riders
U. S. Census Bureau: American Community Survey 2008-2012
Household average income
Santa Clara County: $85,265
Bus: $38,926
Light rail: $58,277
VTA Overall: $42,802
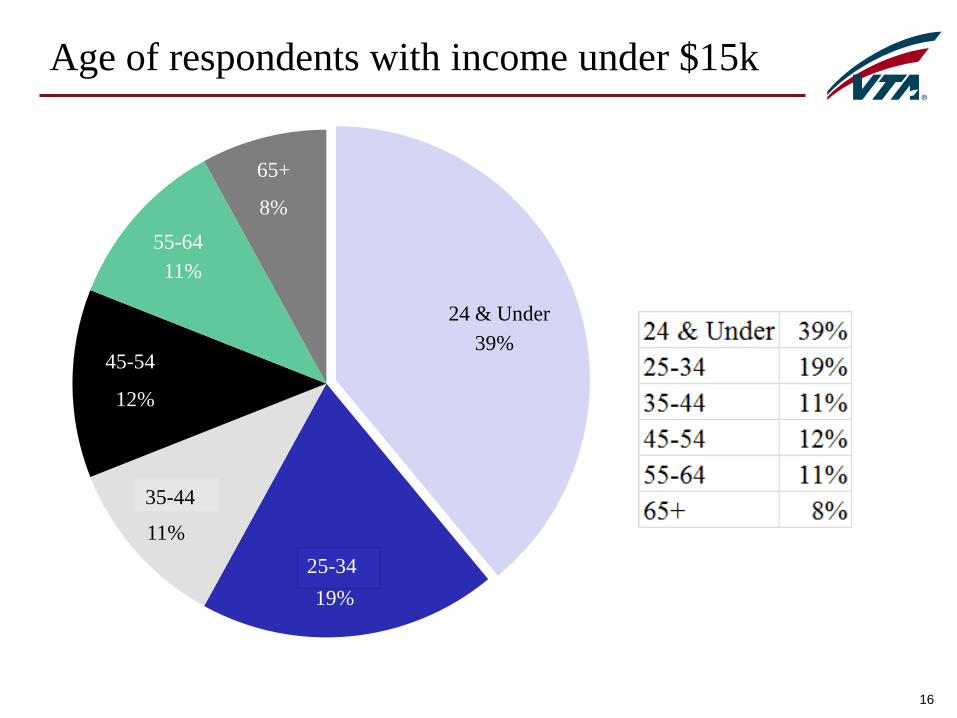
Age of respondents with income under $15k
16
39%
19%
11%
12%
11%
8%
24 & Under
25-34
35-44
45-54
55-64
65+
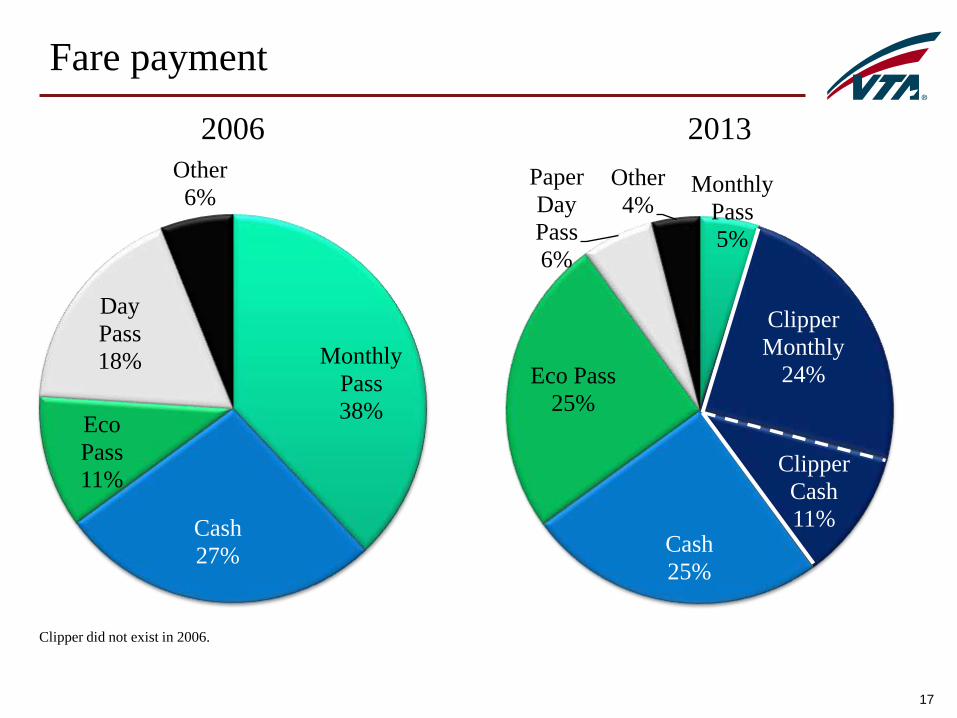
Fare payment
Monthly
Pass
5%
Clipper
Monthly
24%
Clipper
Cash
11%Cash
25%
Eco Pass
25%
Paper
Day
Pass
6%
Other
4%
Monthly
Pass
38%
Cash
27%
Eco
Pass
11%
Day
Pass
18%
Other
6%
Clipper did not exist in 2006.
17
2006 2013
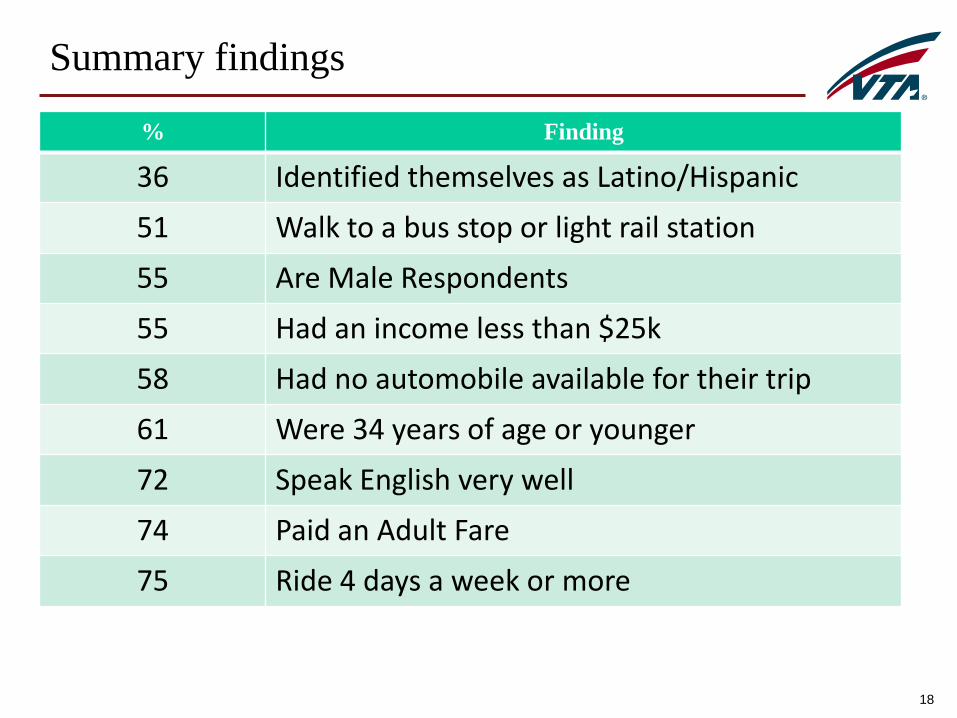
Summary findings
% Finding
36 Identified themselves as Latino/Hispanic
51 Walk to a bus stop or light rail station
55 Are Male Respondents
55 Had an income less than $25k
58 Had no automobile available for their trip
61 Were 34 years of age or younger
72 Speak English very well
74 Paid an Adult Fare
75 Ride 4 days a week or more
18
Next steps
19
Non-Rider Survey
Travel Demand Model Input
Further Analysis for Marketing, Service Planning