Embed Size (px)
Citation preview
Power BI Overview
Sean Wallbridge, SharePoint MVP@itgroove | www.itgroove.net
Agenda A Brief History of Microsoft BI Power BI Components today Demo/Preview (if time allows)
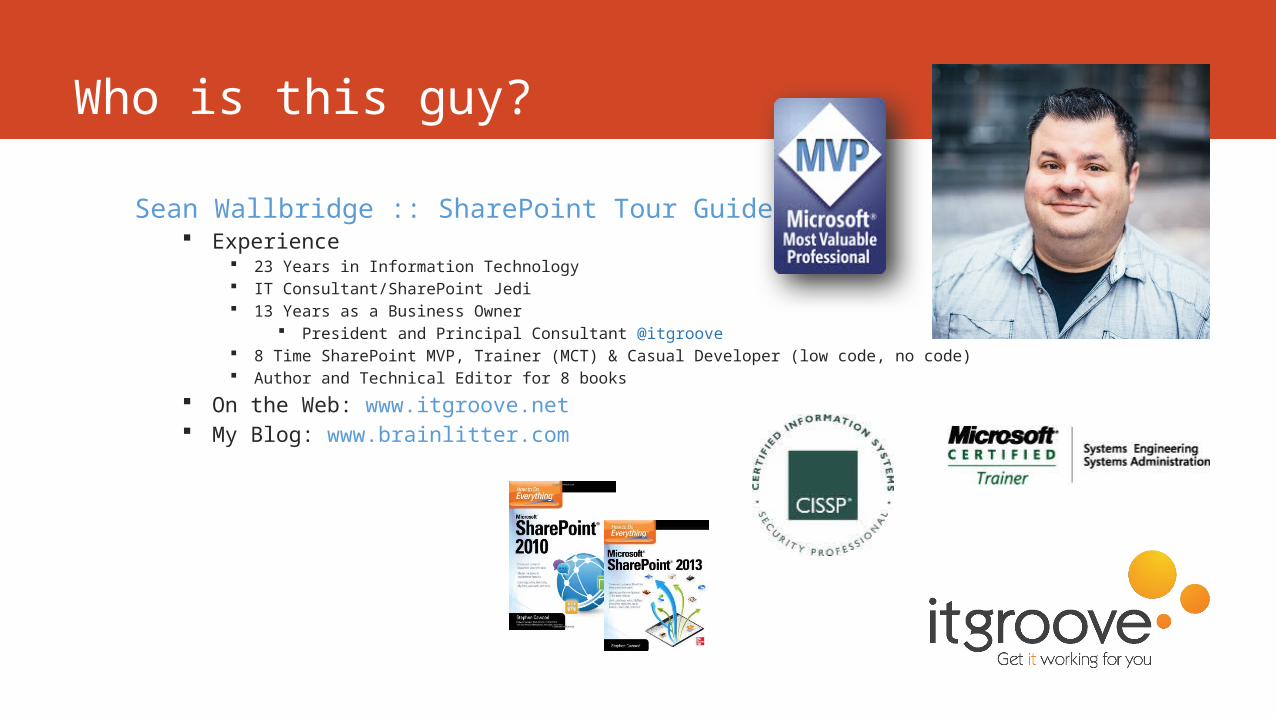
Who is this guy?
Sean Wallbridge :: SharePoint Tour Guide Experience
23 Years in Information Technology IT Consultant/SharePoint Jedi 13 Years as a Business Owner
President and Principal Consultant @itgroove 8 Time SharePoint MVP, Trainer (MCT) & Casual Developer (low code, no code) Author and Technical Editor for 8 books
On the Web: www.itgroove.net My Blog: www.brainlitter.com

How we got here…
Before SharePoint
• Make a nice chart• Email or Print It
SharePoint 2007
• SQL Reporting Services• KPI/Status Indicators• Chart Web Part• Excel Services
SharePoint 2010
• SQL Reporting Services• KPI/Status Indicators• Chart Web Part• Excel Services• Performance Point• Power Pivot
SharePoint 2013
• SQL Reporting Services• Excel Services• Power Query• Power Pivot• Power View• Power Map
SharePoint 2016/Online
• SQL Reporting Services• Office Online Server• Power Pivot*• Power BI
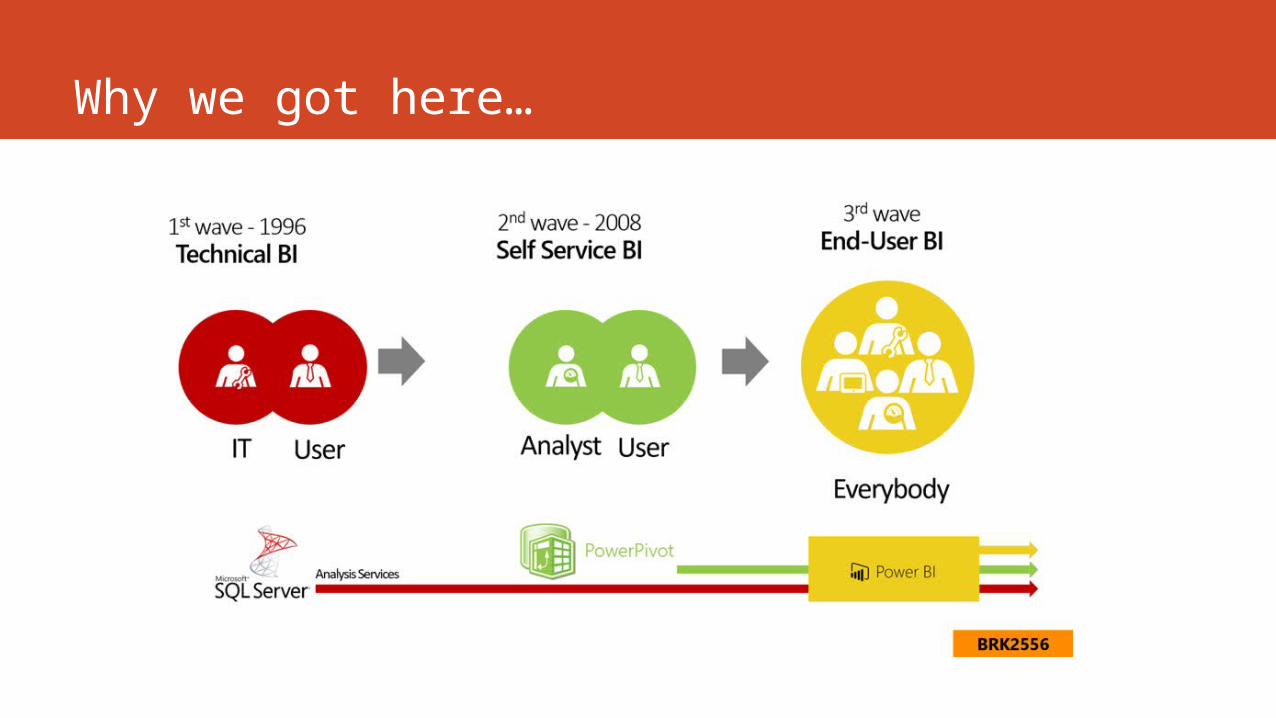
Why we got here…
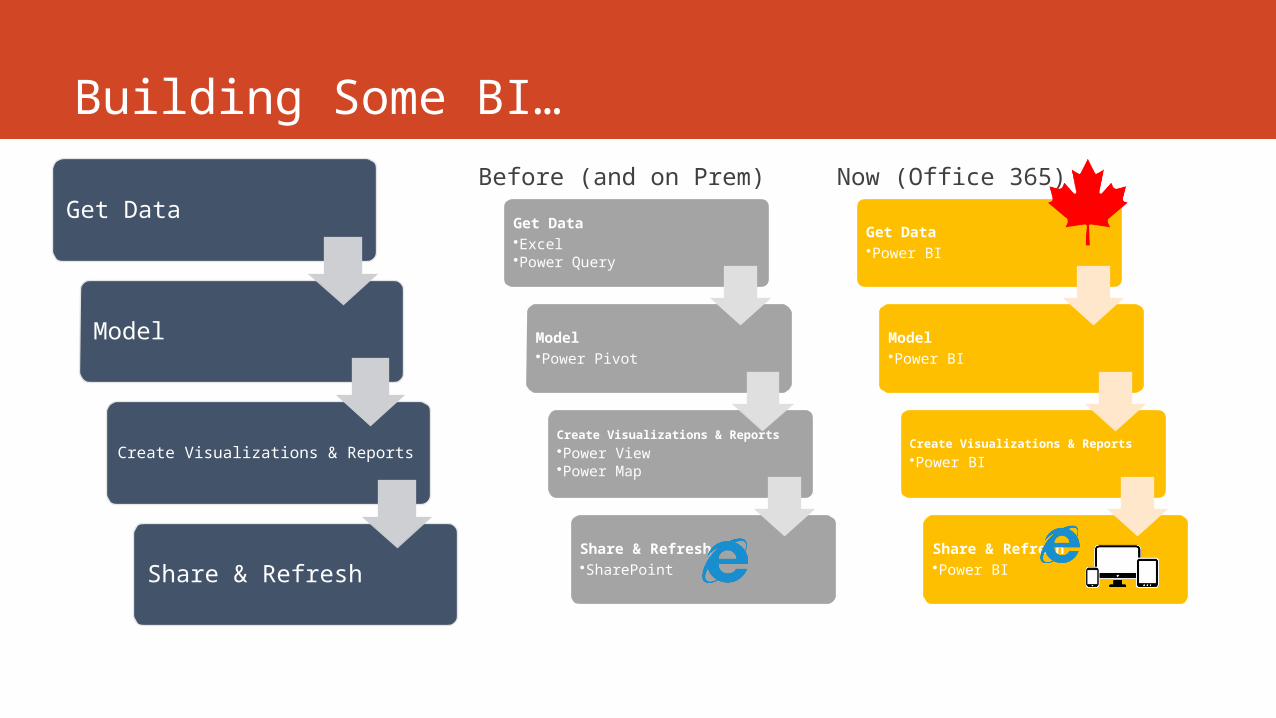
Building Some BI…
Get Data
Model
Create Visualizations & Reports
Share & Refresh
Get Data•Excel•Power Query
Model•Power Pivot
Create Visualizations & Reports•Power View•Power Map
Share & Refresh•SharePoint
Before (and on Prem)
Get Data•Power BI
Model•Power BI
Create Visualizations & Reports•Power BI
Share & Refresh•Power BI
Now (Office 365)
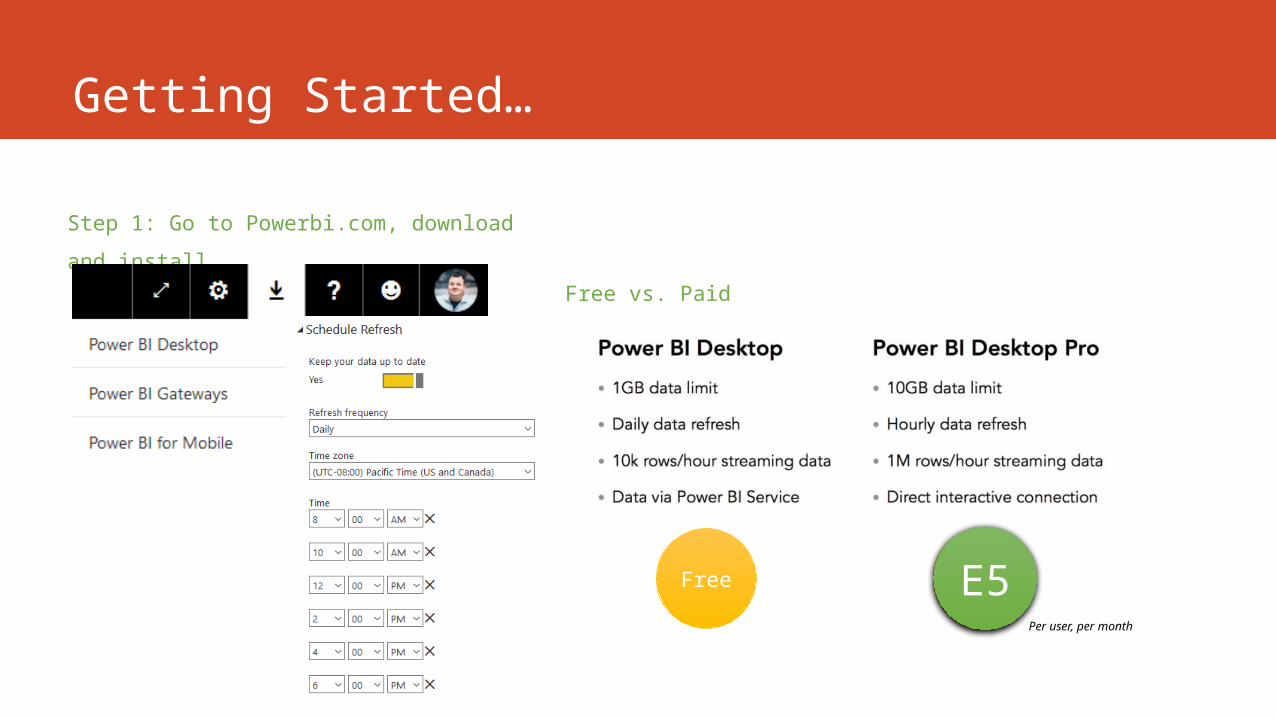
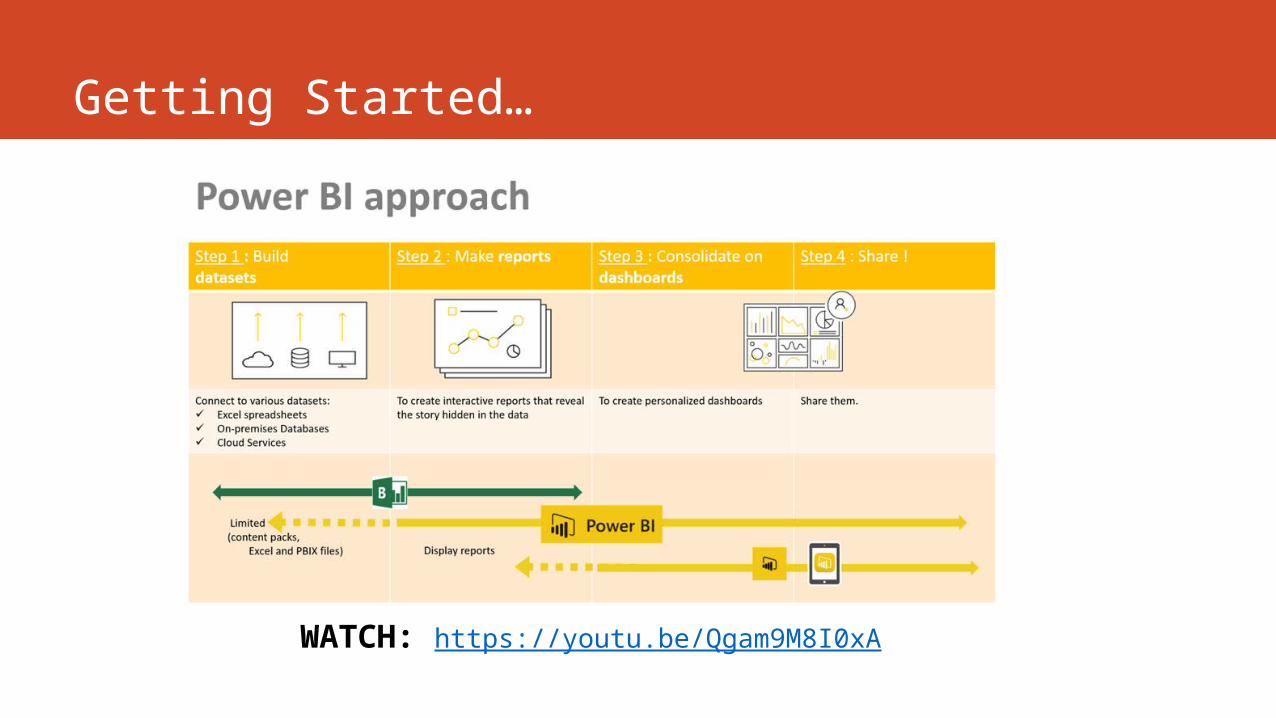
Getting Started…
Step 1: Go to Powerbi.com, download and install
Free $12.20
Per user, per month
Free vs. Paid
E5