Embed Size (px)
Citation preview
1
Reduce losses, improve efficiency and protect revenues with analyticsTrue Grid Intelligence (TGI) using In-Grid Analytics
April 28th, 2015
Jean-Yves Blanc, Schneider electricMischa Steiner-Jovic, Awesense

22
Schneider Electric protects grid revenue by helping distribution utilities easily locate energy losses and improve grid operations & efficiency.
Schneider Electric has partnered with Awesense Inc. to deliver a best in class grid data analytics solution.
3
Over $200B of energy wasted yearly
Annual value of global Non Technical electricity losses (annual increase +2,5%)
Source: World Bank 2011-2014
4
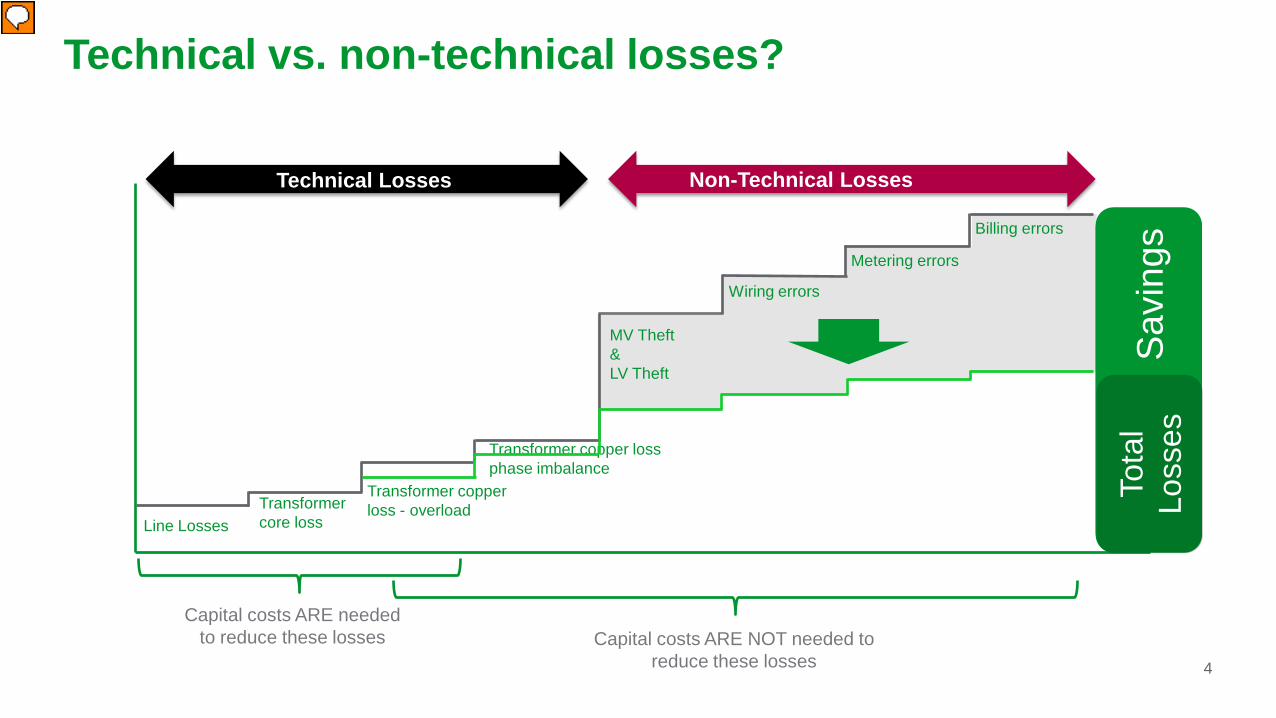
Technical Losses
MV Theft&LV Theft
Wiring errors
Tota
l Los
ses
Metering errors
Line LossesTransformer core loss
Transformer copper loss - overload
Transformer copper loss phase imbalance
Billing errors
Capital costs ARE NOT needed to reduce these losses
Capital costs ARE needed to reduce these losses
Non-Technical Losses
Technical vs. non-technical losses?
Savi
ngs
Tota
l Lo
sses
5
What do you think your non-technical losses currently are?
a - < 2%b - 2% to 5%c - 5% to 10%d - >10%e - Don’t know
6
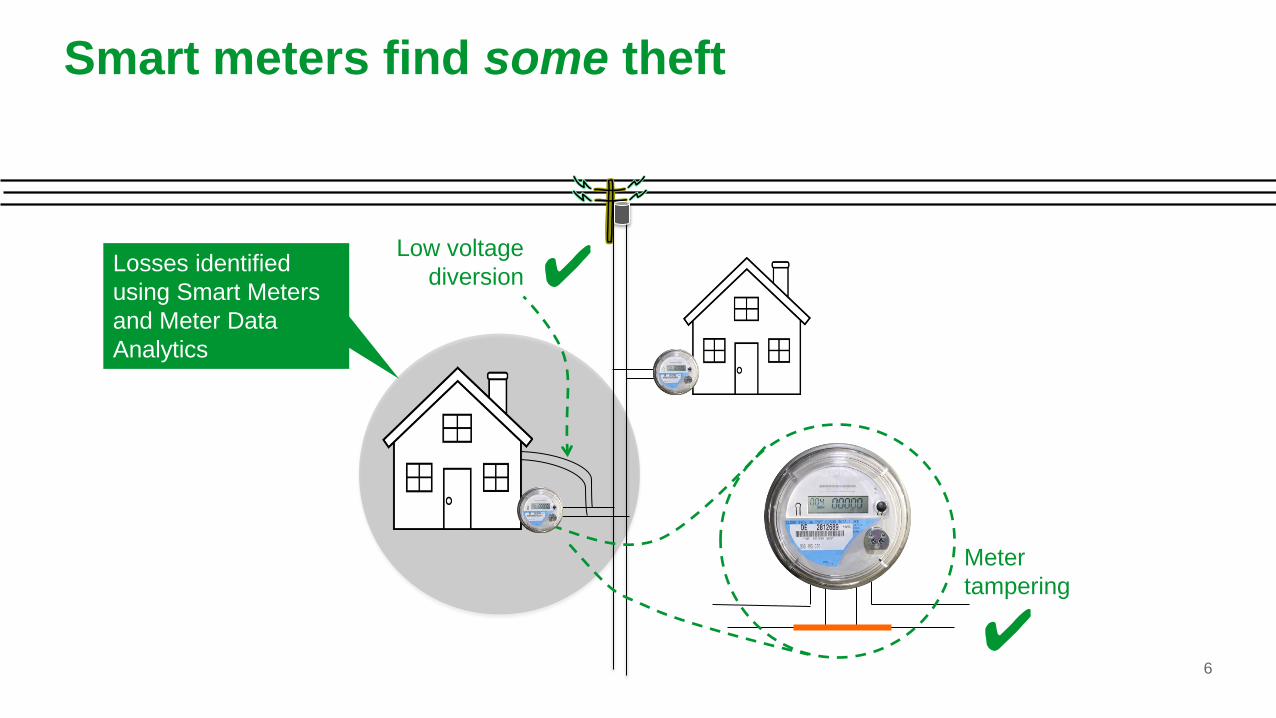
Smart meters find some theft
Meter tampering
Low voltage diversionLosses identified
using Smart Meters and Meter Data Analytics
✔
✔
7
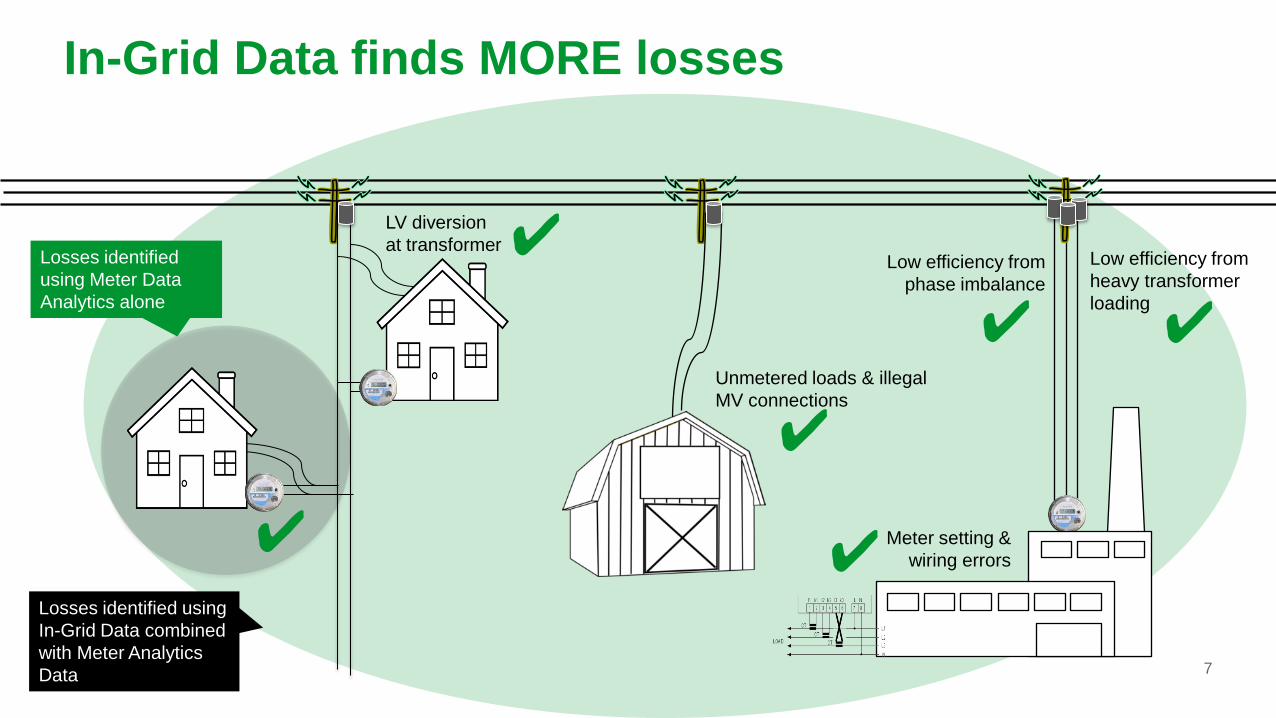
In-Grid Data finds MORE losses
Losses identified using Meter Data Analytics alone
LV diversion at transformer
Unmetered loads & illegal MV connections
Low efficiency from phase imbalance
Low efficiency from heavy transformer loading
Losses identified using In-Grid Data combined with Meter Analytics Data
Meter setting & wiring errors
✔
✔
✔✔
✔✔
8
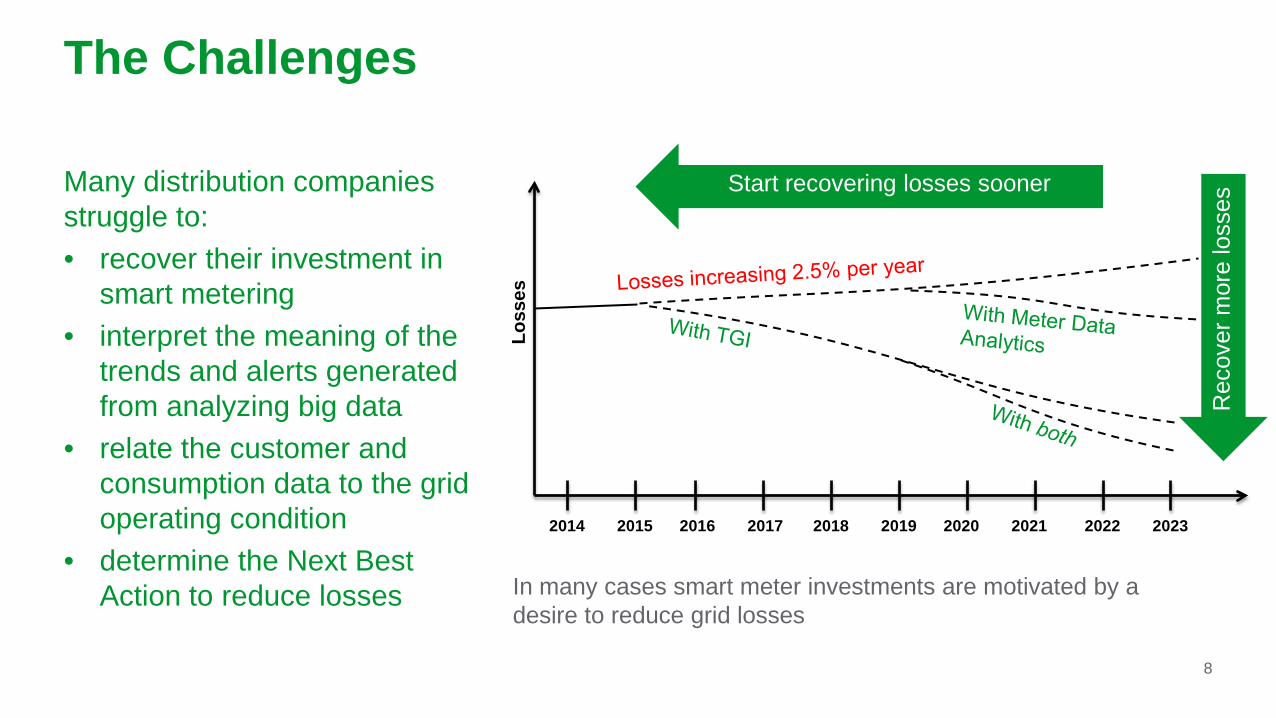
The Challenges
Many distribution companies struggle to:• recover their investment in
smart metering• interpret the meaning of the
trends and alerts generated from analyzing big data
• relate the customer and consumption data to the grid operating condition
• determine the Next Best Action to reduce losses In many cases smart meter investments are motivated by a
desire to reduce grid losses
Tota
l Lo
sses
Start recovering losses sooner
Rec
over
mor
e lo
sses
20152014 20172016 20192018 20212020 20232022Lo
sses
9
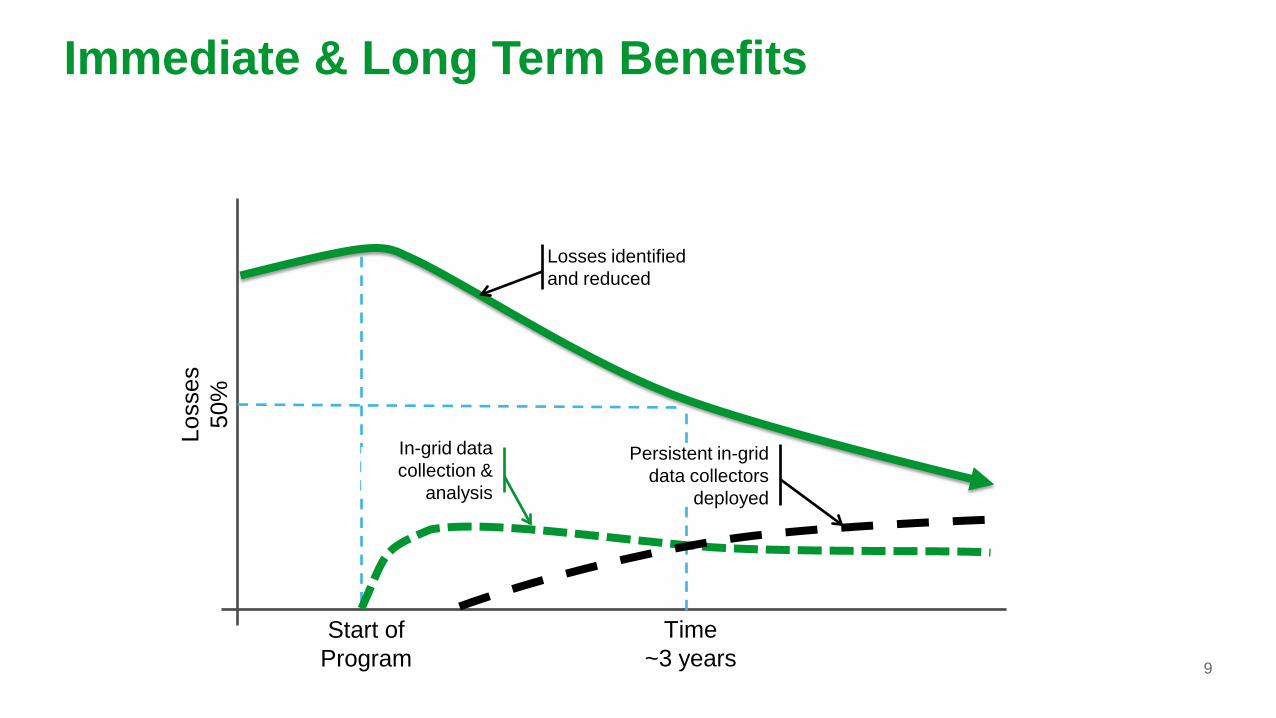
Immediate & Long Term Benefits
Loss
es50
%
Time~3 years
Start of Program
In-grid data collection &
analysis
Losses identified and reduced
Persistent in-grid data collectors
deployed
1010
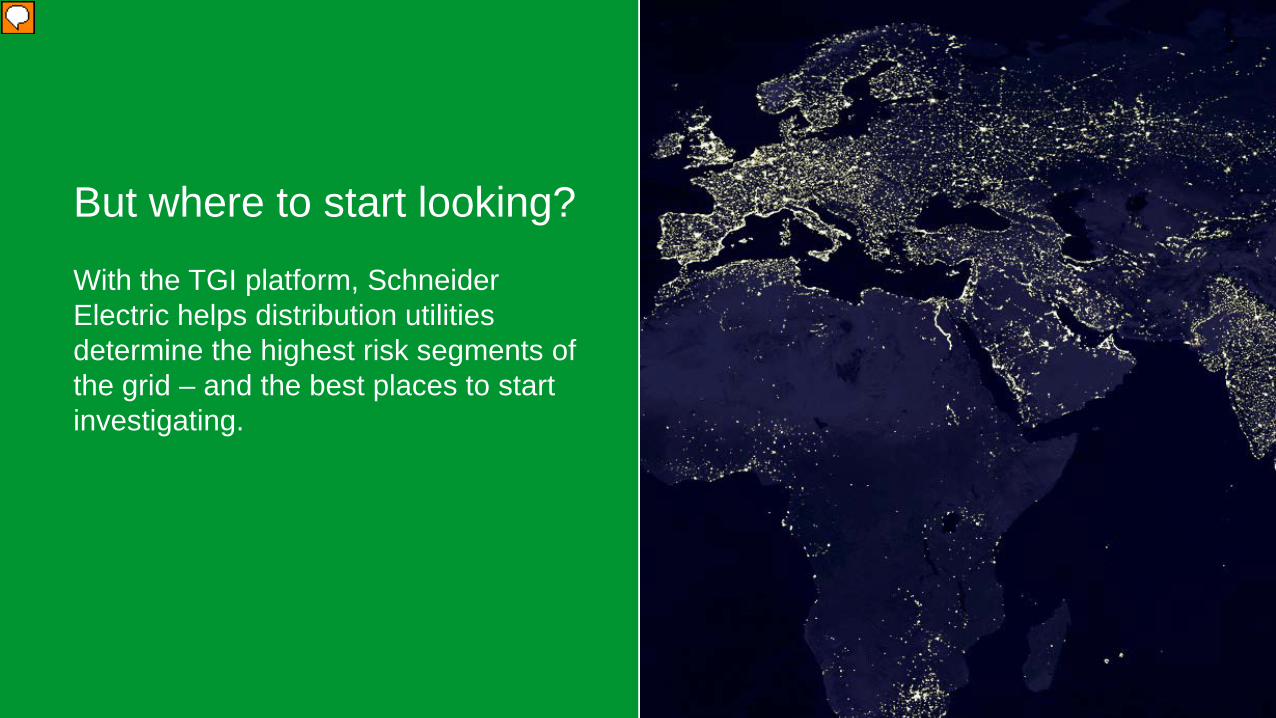
But where to start looking?
With the TGI platform, Schneider Electric helps distribution utilities determine the highest risk segments of the grid – and the best places to start investigating.
11
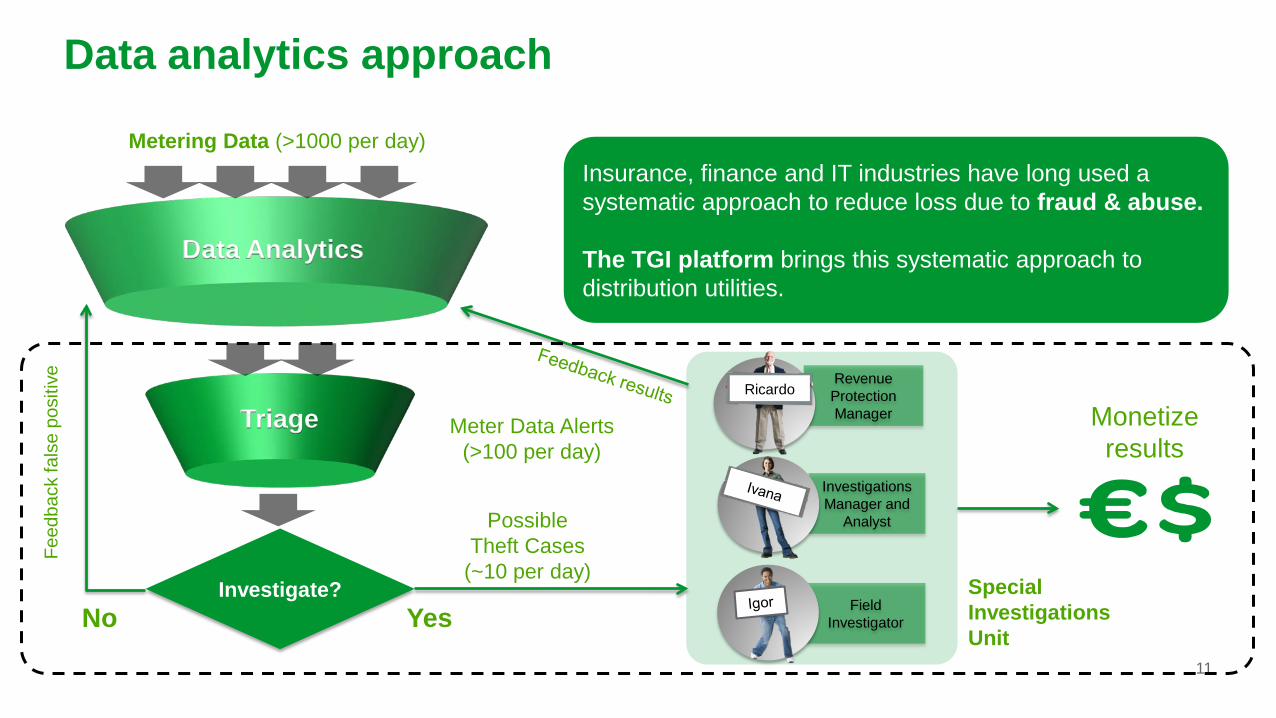
Revenue Protection Manager
Investigations Manager and
Analyst
Field Investigator
Data analytics approach
PossibleTheft Cases
(~10 per day)
Monetize results
Special InvestigationsUnit
Investigate?No Yes
Data Analytics
Triage Meter Data Alerts (>100 per day)
Feed
back
fals
e po
sitiv
e
Metering Data (>1000 per day)Insurance, finance and IT industries have long used a systematic approach to reduce loss due to fraud & abuse.
The TGI platform brings this systematic approach to distribution utilities.
Ricardo
12
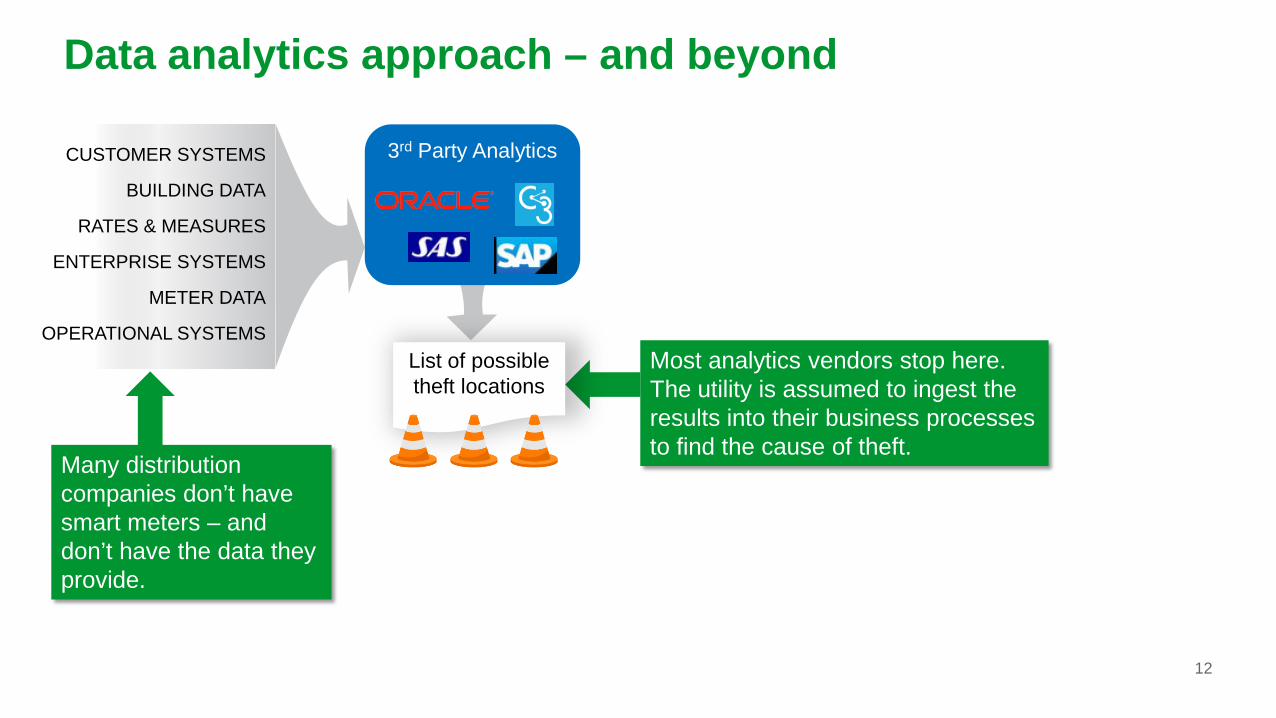
Data analytics approach – and beyond
Most analytics vendors stop here. The utility is assumed to ingest the results into their business processes to find the cause of theft.
CUSTOMER SYSTEMS
BUILDING DATA
RATES & MEASURES
ENTERPRISE SYSTEMS
METER DATA
OPERATIONAL SYSTEMSList of possible theft locations
3rd Party Analytics
Many distribution companies don’t have smart meters – and don’t have the data they provide.
13
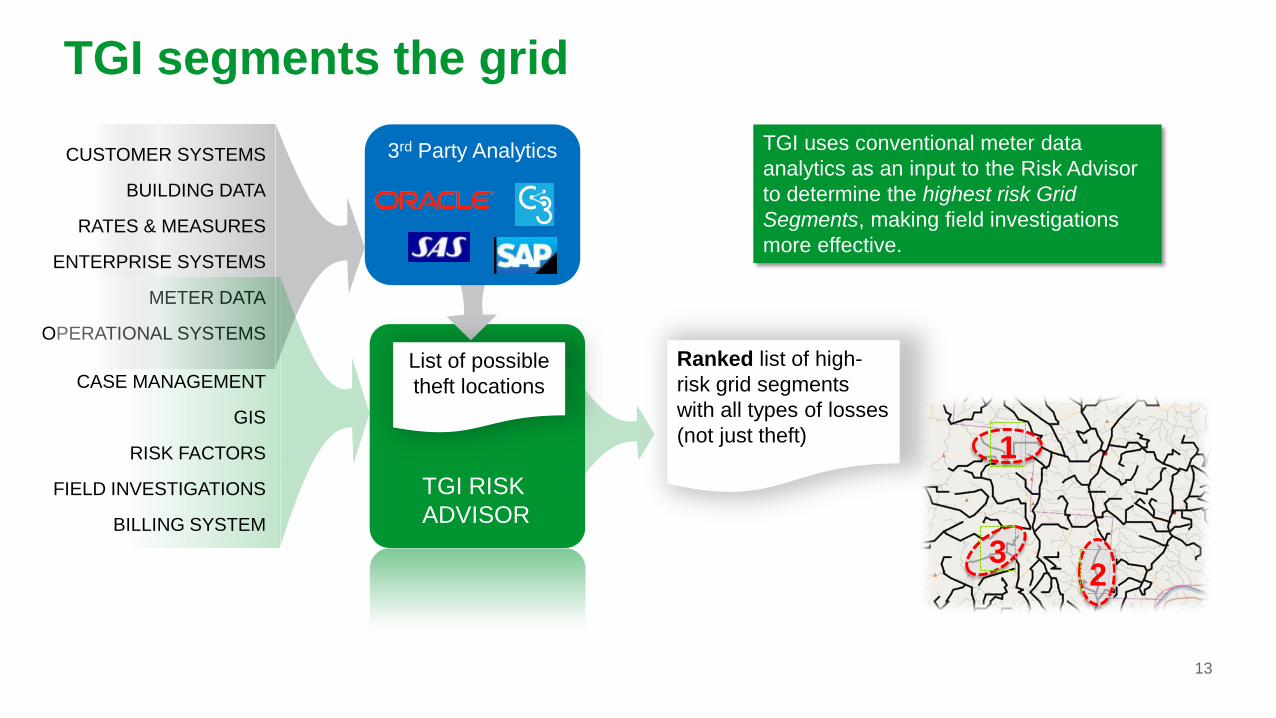
TGI segments the grid
List of possible theft locations
TGI uses conventional meter data analytics as an input to the Risk Advisor to determine the highest risk Grid Segments, making field investigations more effective.
TGI RISKADVISOR
Ranked list of high-risk grid segments with all types of losses (not just theft)
CUSTOMER SYSTEMS
BUILDING DATA
RATES & MEASURES
ENTERPRISE SYSTEMS
METER DATA
OPERATIONAL SYSTEMS
CASE MANAGEMENT
GIS
RISK FACTORS
FIELD INVESTIGATIONS
BILLING SYSTEM
1
23
3rd Party Analytics
14
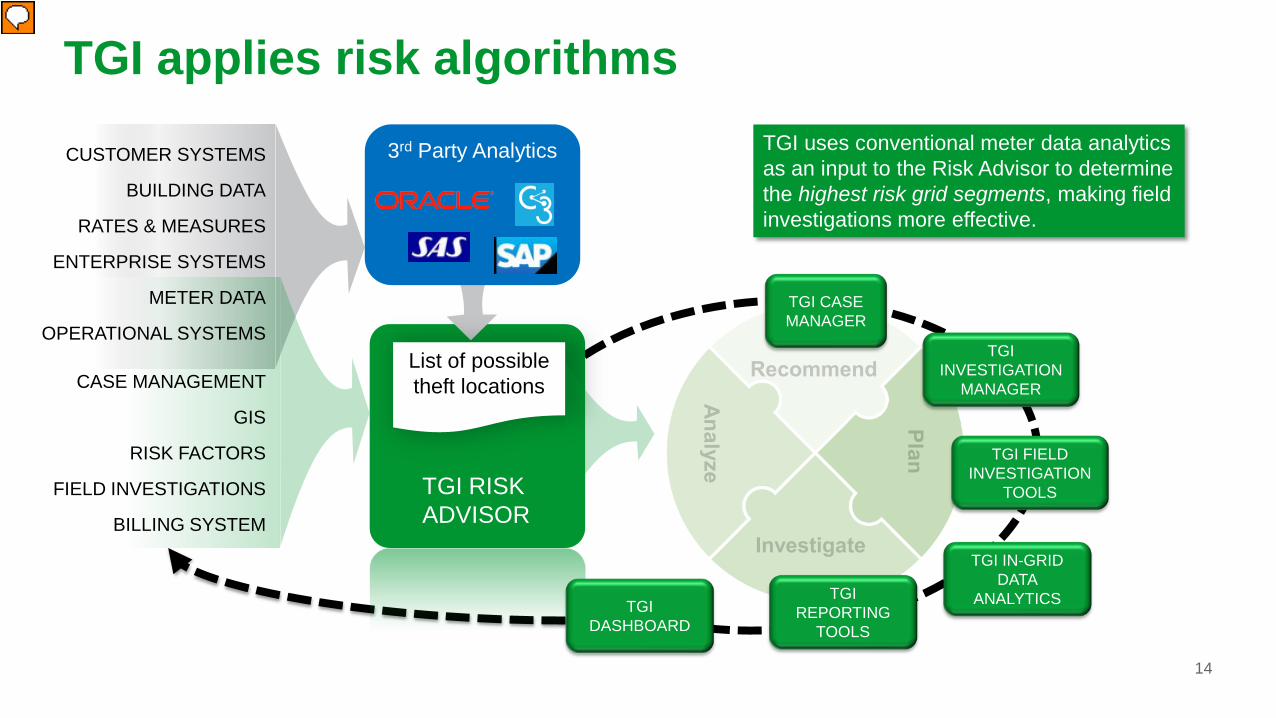
TGI applies risk algorithms
List of possible theft locations
TGI uses conventional meter data analytics as an input to the Risk Advisor to determine the highest risk grid segments, making field investigations more effective.
TGI RISKADVISOR
CUSTOMER SYSTEMS
BUILDING DATA
RATES & MEASURES
ENTERPRISE SYSTEMS
METER DATA
OPERATIONAL SYSTEMS
CASE MANAGEMENT
GIS
RISK FACTORS
FIELD INVESTIGATIONS
BILLING SYSTEM
TGI CASE MANAGER
TGI REPORTING
TOOLS
TGI INVESTIGATION
MANAGER
TGI FIELD INVESTIGATION
TOOLS
TGI DASHBOARD
TGI IN-GRID DATA
ANALYTICS
3rd Party Analytics
17
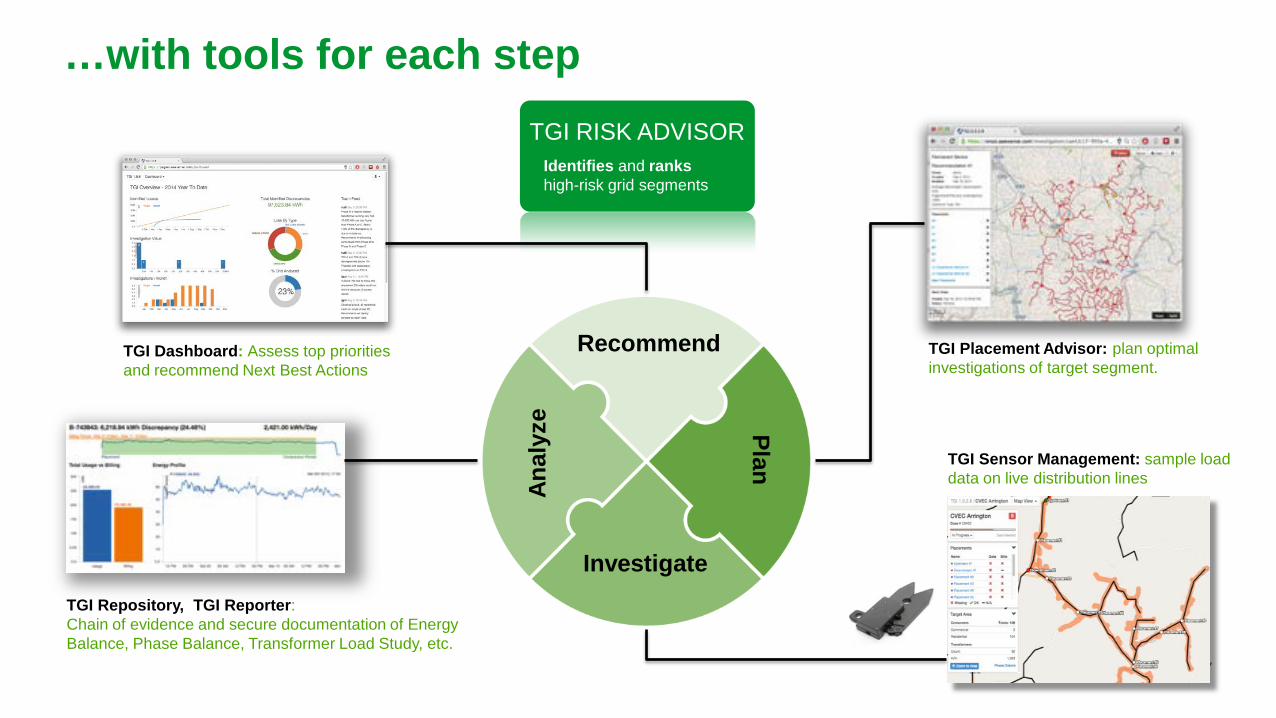
TGI RISK ADVISORIdentifies and rankshigh-risk grid segments
TGI Dashboard: Assess top priorities and recommend Next Best Actions
TGI Placement Advisor: plan optimal investigations of target segment.
TGI Repository, TGI Reporter:Chain of evidence and secure documentation of Energy Balance, Phase Balance, Transformer Load Study, etc.
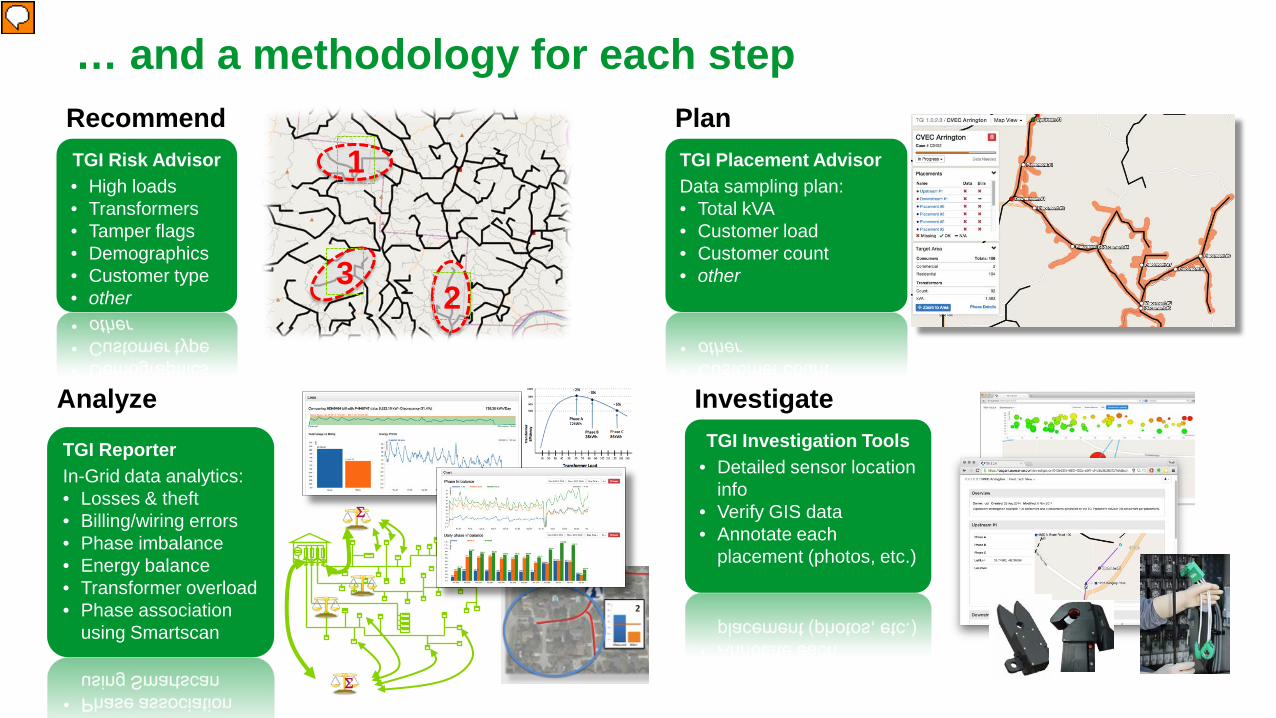
…with tools for each step
Recommend
Plan
InvestigateAn
alyz
e
TGI Sensor Management: sample load data on live distribution lines
18
… and a methodology for each stepRecommendTGI Risk Advisor• High loads• Transformers• Tamper flags• Demographics• Customer type• other
1
23
PlanTGI Placement AdvisorData sampling plan:• Total kVA• Customer load• Customer count• other
InvestigateTGI Investigation Tools
• Detailed sensor location info
• Verify GIS data• Annotate each
placement (photos, etc.)
TGI ReporterIn-Grid data analytics:• Losses & theft• Billing/wiring errors• Phase imbalance• Energy balance• Transformer overload• Phase association
using Smartscan
Σ
Σ
Analyze
1919
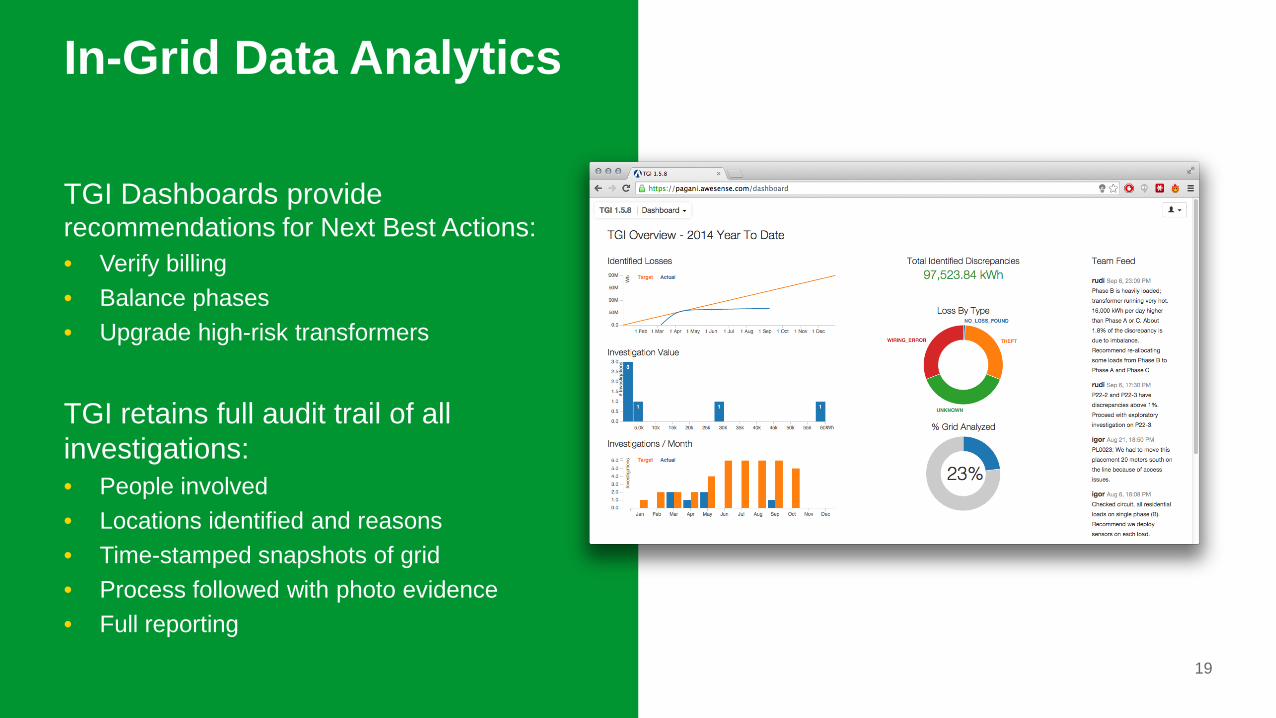
In-Grid Data Analytics
TGI Dashboards provide recommendations for Next Best Actions:• Verify billing• Balance phases• Upgrade high-risk transformers
TGI retains full audit trail of all investigations:• People involved• Locations identified and reasons• Time-stamped snapshots of grid• Process followed with photo evidence• Full reporting
20
Does NTL´s analysis require a Big Data Architecture?
a - Yes, alwaysb - Not at allc - Most of the timesd - It depends of data volumes to be
managed
21
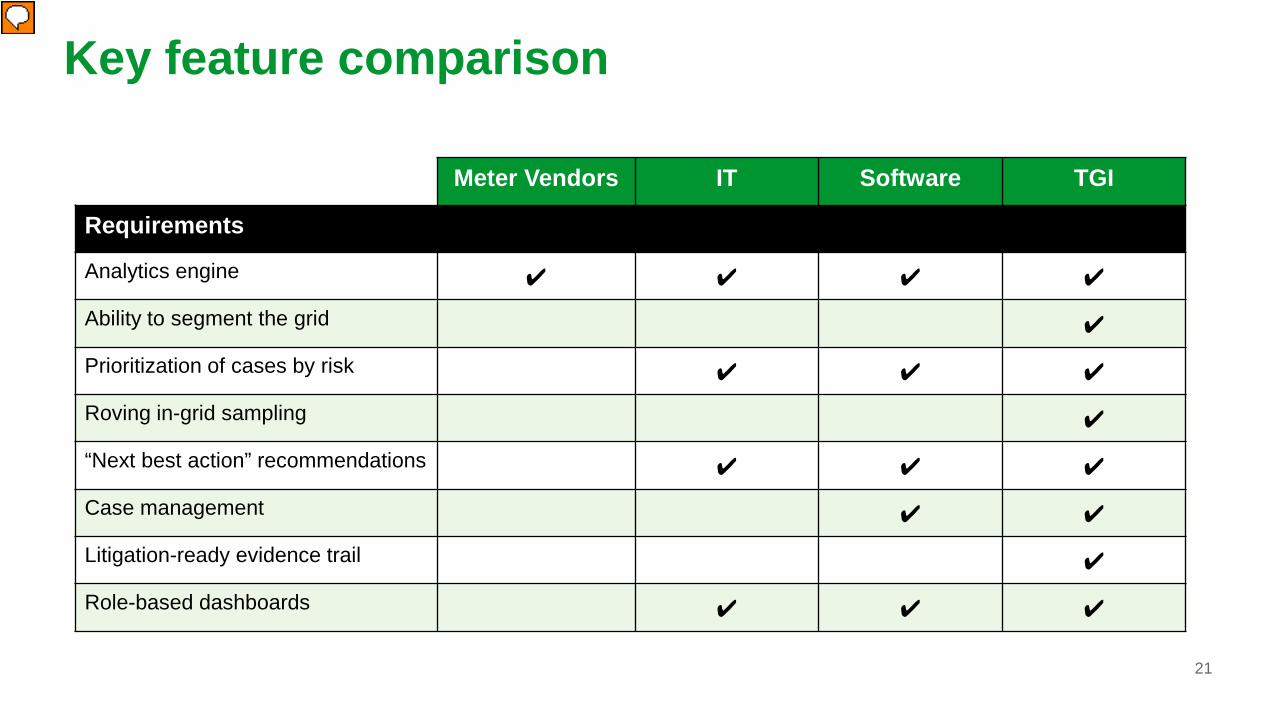
Key feature comparison
Meter Vendors IT Software TGI
Requirements
Analytics engine ✔ ✔ ✔ ✔
Ability to segment the grid ✔
Prioritization of cases by risk ✔ ✔ ✔
Roving in-grid sampling ✔
“Next best action” recommendations ✔ ✔ ✔
Case management ✔ ✔
Litigation-ready evidence trail ✔
Role-based dashboards ✔ ✔ ✔
22
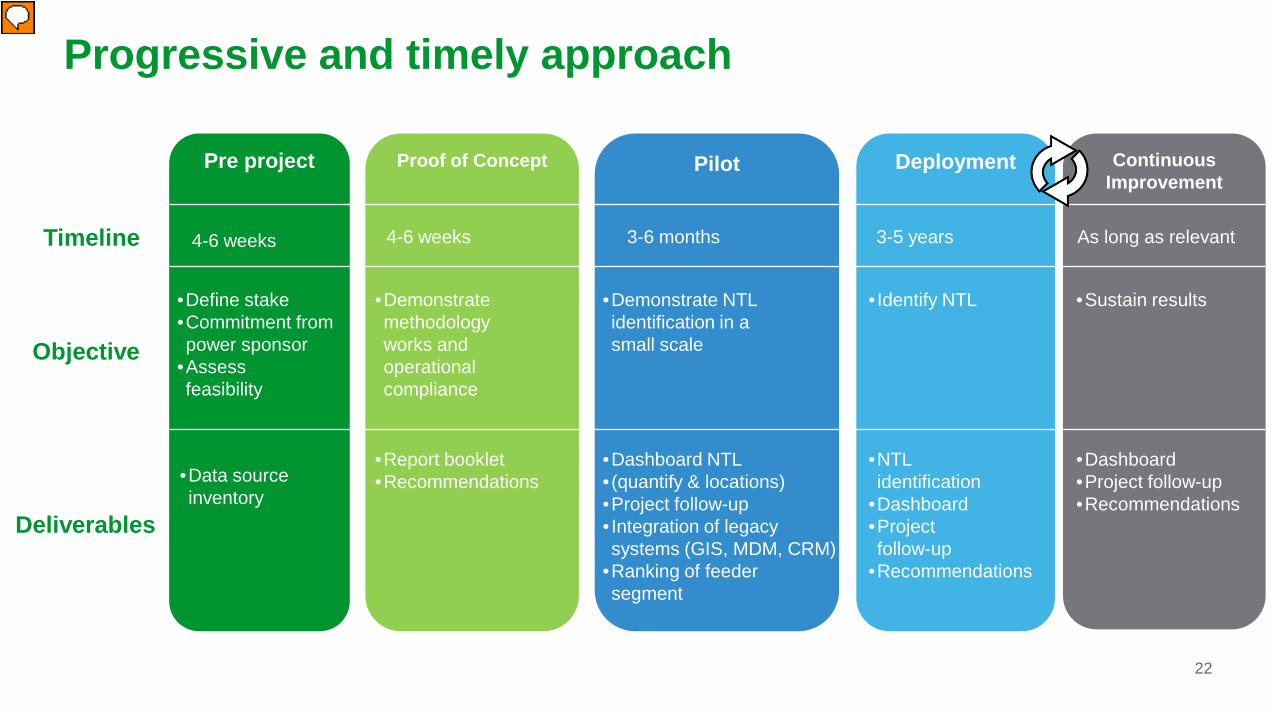
Progressive and timely approach
Pre project Proof of Concept Pilot Deployment Continuous Improvement
•Define stake•Commitment from power sponsor
•Assessfeasibility
4-6 weeks 3-6 months 3-5 years As long as relevant
•Demonstrate methodology works and operational compliance
•Demonstrate NTL identification in a small scale
• Identify NTL •Sustain results
•Dashboard•Project follow-up•Recommendations
•NTLidentification
•Dashboard•Projectfollow-up
•Recommendations
•Dashboard NTL • (quantify & locations)•Project follow-up• Integration of legacysystems (GIS, MDM, CRM)
•Ranking of feeder segment
•Report booklet•Recommendations
Timeline
Objective
Deliverables
4-6 weeks
•Data source inventory
2323
Conclusion
As the global specialist in EnergyManagement™, Schneider Electric helpsElectric Distribution Utilities to identify,measure and locate Non TechnicalLosses:
• Minimize the losses• Improving grid operations• Improve grid efficiency

24
Make the most of your energySM


![Privacy-Preserving Smart Metering€¦ · to protect privacy in the smart grid. Wagner et al. [40] propose a privacy-aware framework for the smart grid based on semantic web technologies](https://img.pdfslide.us/doc/110x75/5fc9de2752de1242f91e9e4f/privacy-preserving-smart-metering-to-protect-privacy-in-the-smart-grid-wagner-et.jpg)