Embed Size (px)
Citation preview
Copyright © 2012, Oracle and/or its affiliates. All rights
reserved.
Understanding Query Optimization
with ‘regular’ and ‘Exadata’ OracleThomas Kyte
http://asktom.oracle.com/
Copyright © 2012, Oracle and/or its affiliates. All rights
reserved.
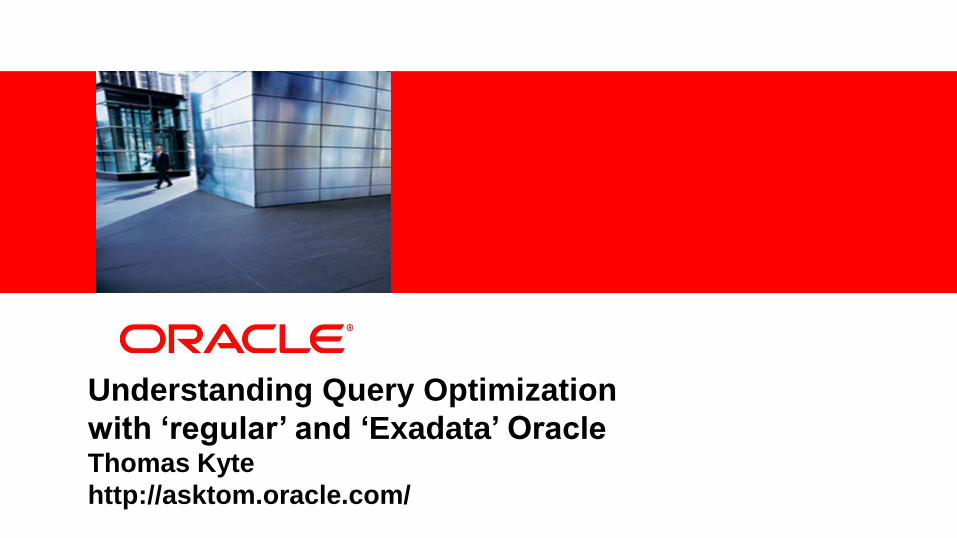
Statement Processing and the OptimizerWhat Happens when a SQL statement is issued?
User
Library Cache
Shared SQL Area
Shared Pool
CnC1 C2 …
3
Cost Estimator
Query Transformation
Plan Generator
Optimizer
Oracle Database 1
Syntax Check
Semantic Check
Shared Pool check
2
Parsing
4
SQL Execution
Code GeneratorDecision on what processing is
offloaded occurs here
<Insert Picture Here>
What is an execution plan and how to
generate one
What is an Execution plan?
• Execution plans show the detailed steps necessary to
execute a SQL statement
• These steps are expressed as a set of database
operators that consumes and produces rows
• The order of the operators and their implementation is
decided by the optimizer using a combination of query
transformations and physical optimization techniques
• The display is commonly shown in a tabular format,
but a plan is in fact tree-shaped
Group By
HASH JOIN
TABLE ACCESS SALES
TABLE ACCESS PRODUCTS
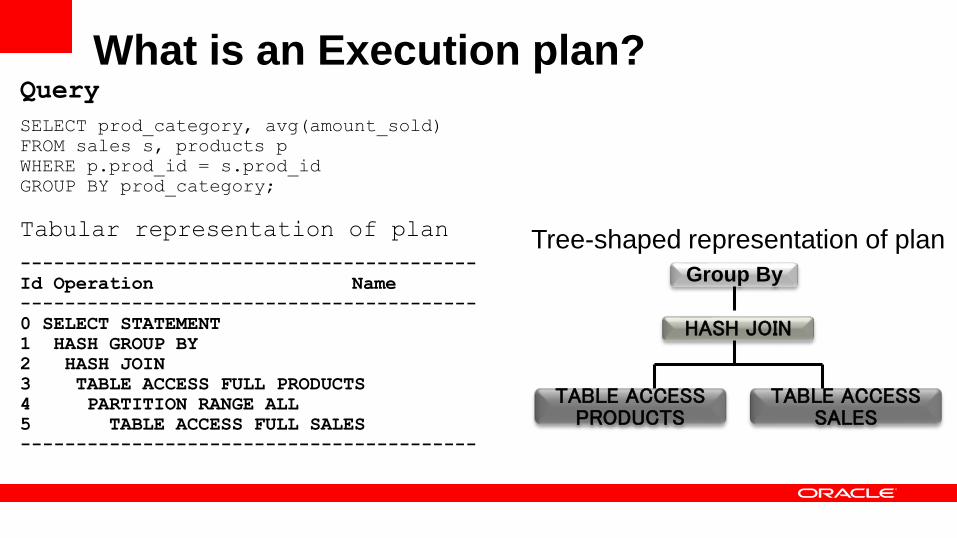
What is an Execution plan?Query
SELECT prod_category, avg(amount_sold)
FROM sales s, products p
WHERE p.prod_id = s.prod_id
GROUP BY prod_category;
Tabular representation of plan
-----------------------------------------
Id Operation Name
-----------------------------------------
0 SELECT STATEMENT
1 HASH GROUP BY
2 HASH JOIN
3 TABLE ACCESS FULL PRODUCTS
4 PARTITION RANGE ALL
5 TABLE ACCESS FULL SALES
-----------------------------------------
Tree-shaped representation of plan
How to get an Execution Plan
Two methods for looking at the execution plan
1.EXPLAIN PLAN command
• Displays an execution plan for a SQL statement without actually
executing the statement
2.V$SQL_PLAN
• A dictionary view introduced in Oracle 9i that shows the execution
plan for a SQL statement that has been compiled into a cursor in
the cursor cache
Use DBMS_XPLAN package to display plansUnder certain conditions the plan shown with EXPLAIN PLAN can be different from the plan shown using V$SQL_PLAN
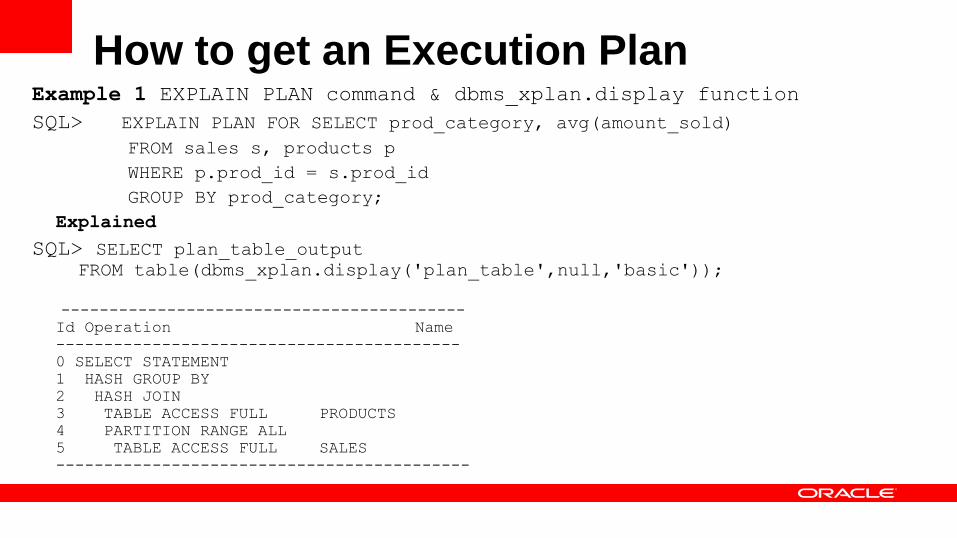
How to get an Execution PlanExample 1 EXPLAIN PLAN command & dbms_xplan.display function
SQL> EXPLAIN PLAN FOR SELECT prod_category, avg(amount_sold)
FROM sales s, products p
WHERE p.prod_id = s.prod_id
GROUP BY prod_category;
Explained
SQL> SELECT plan_table_outputFROM table(dbms_xplan.display('plan_table',null,'basic'));
------------------------------------------
Id Operation Name
------------------------------------------
0 SELECT STATEMENT
1 HASH GROUP BY
2 HASH JOIN
3 TABLE ACCESS FULL PRODUCTS
4 PARTITION RANGE ALL
5 TABLE ACCESS FULL SALES
-------------------------------------------
Explain Plan “lies”
• Explain plan should hardly ever be used…
• You have to be careful when using autotrace and related tools
• Never use “explain=u/p” with tkprof
• Avoid dbms_xplan.display, use display_cursor
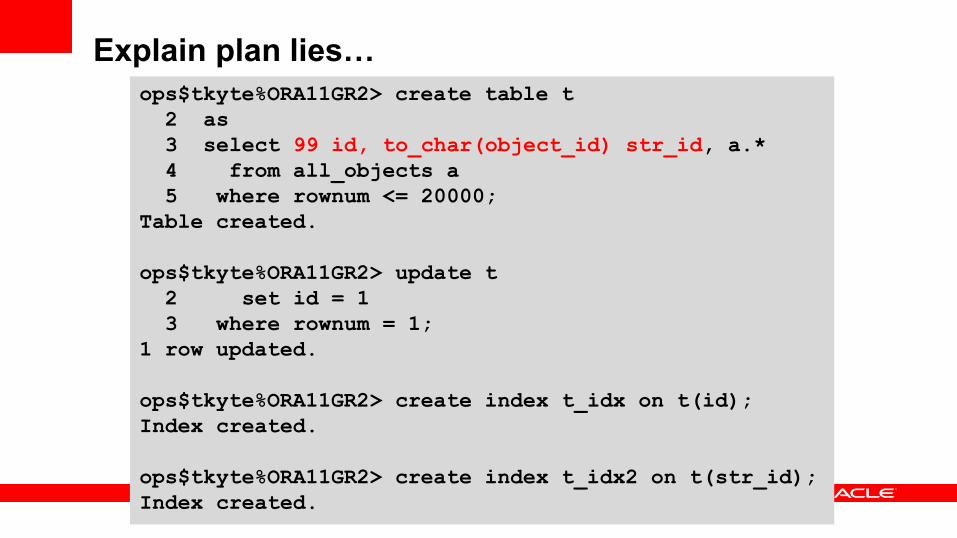
Explain plan lies…
ops$tkyte%ORA11GR2> create table t
2 as
3 select 99 id, to_char(object_id) str_id, a.*
4 from all_objects a
5 where rownum <= 20000;
Table created.
ops$tkyte%ORA11GR2> update t
2 set id = 1
3 where rownum = 1;
1 row updated.
ops$tkyte%ORA11GR2> create index t_idx on t(id);
Index created.
ops$tkyte%ORA11GR2> create index t_idx2 on t(str_id);
Index created.
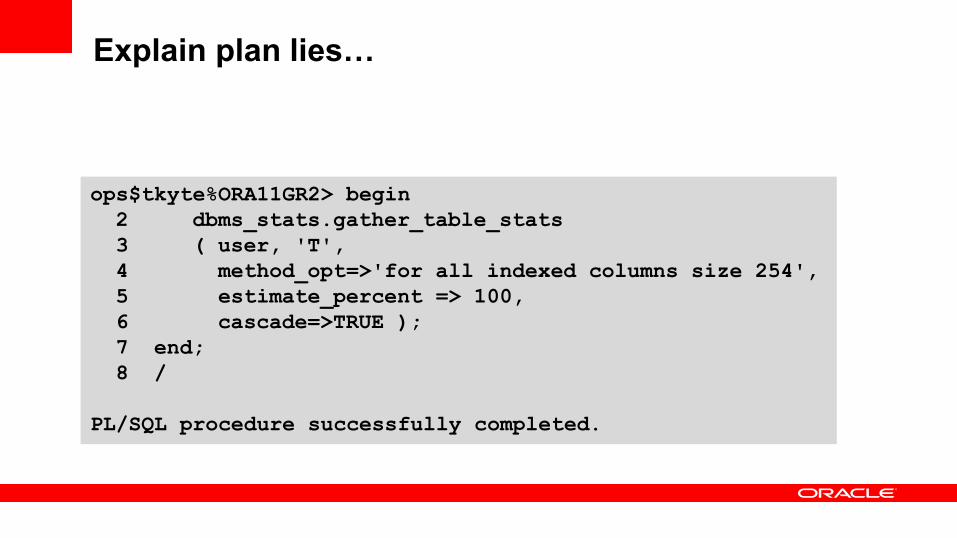
Explain plan lies…
ops$tkyte%ORA11GR2> begin
2 dbms_stats.gather_table_stats
3 ( user, 'T',
4 method_opt=>'for all indexed columns size 254',
5 estimate_percent => 100,
6 cascade=>TRUE );
7 end;
8 /
PL/SQL procedure successfully completed.
Explain plan lies…
Need a volunteer
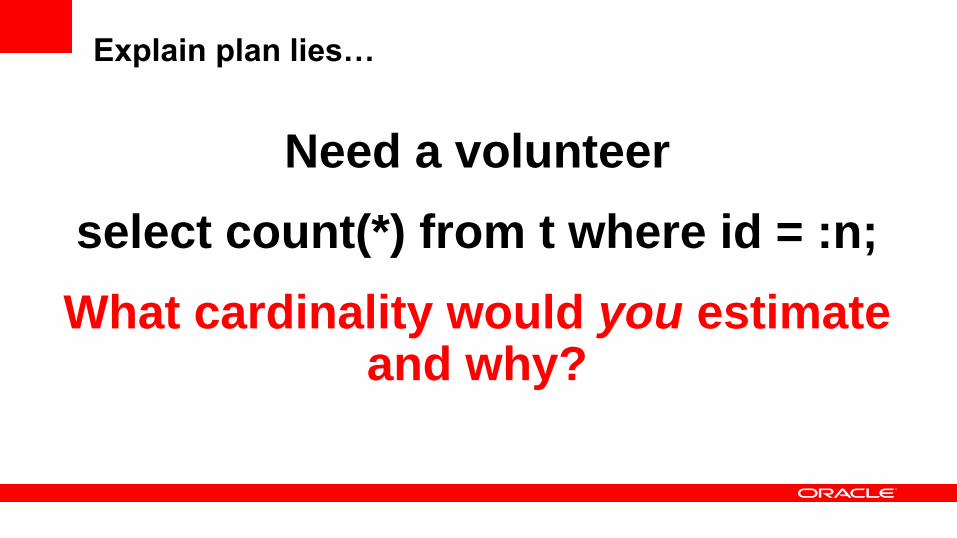
Explain plan lies…
Need a volunteer
select count(*) from t where id = :n;
What cardinality would you estimate and why?
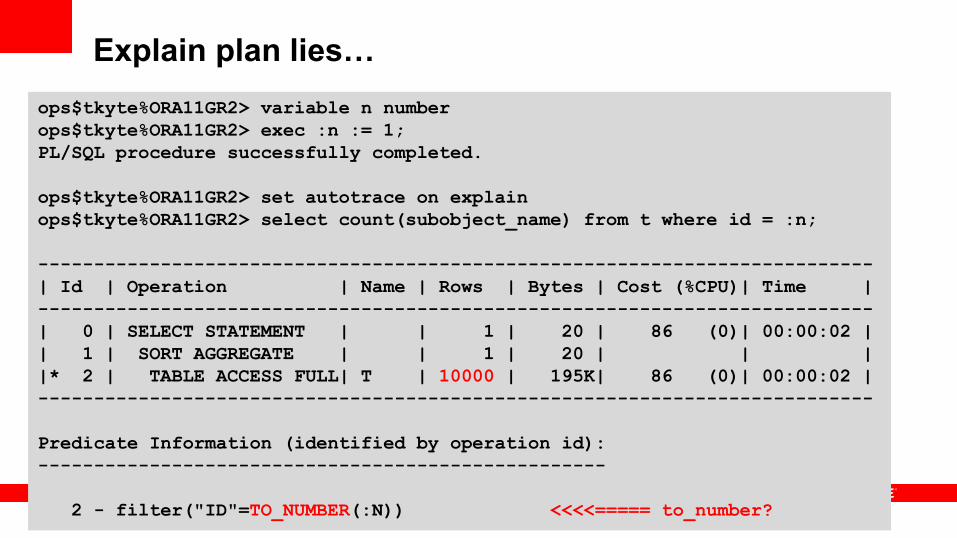
Explain plan lies…
ops$tkyte%ORA11GR2> variable n number
ops$tkyte%ORA11GR2> exec :n := 1;
PL/SQL procedure successfully completed.
ops$tkyte%ORA11GR2> set autotrace on explain
ops$tkyte%ORA11GR2> select count(subobject_name) from t where id = :n;
---------------------------------------------------------------------------
| Id | Operation | Name | Rows | Bytes | Cost (%CPU)| Time |
---------------------------------------------------------------------------
| 0 | SELECT STATEMENT | | 1 | 20 | 86 (0)| 00:00:02 |
| 1 | SORT AGGREGATE | | 1 | 20 | | |
|* 2 | TABLE ACCESS FULL| T | 10000 | 195K| 86 (0)| 00:00:02 |
---------------------------------------------------------------------------
Predicate Information (identified by operation id):
---------------------------------------------------
2 - filter("ID"=TO_NUMBER(:N)) <<<<===== to_number?
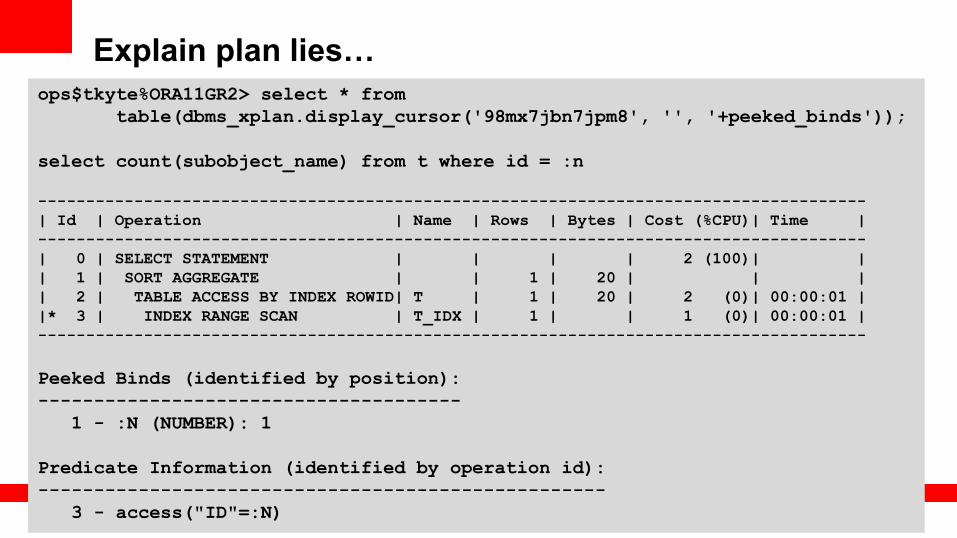
Explain plan lies…
ops$tkyte%ORA11GR2> select * from
table(dbms_xplan.display_cursor('98mx7jbn7jpm8', '', '+peeked_binds'));
select count(subobject_name) from t where id = :n
--------------------------------------------------------------------------------------
| Id | Operation | Name | Rows | Bytes | Cost (%CPU)| Time |
--------------------------------------------------------------------------------------
| 0 | SELECT STATEMENT | | | | 2 (100)| |
| 1 | SORT AGGREGATE | | 1 | 20 | | |
| 2 | TABLE ACCESS BY INDEX ROWID| T | 1 | 20 | 2 (0)| 00:00:01 |
|* 3 | INDEX RANGE SCAN | T_IDX | 1 | | 1 (0)| 00:00:01 |
--------------------------------------------------------------------------------------
Peeked Binds (identified by position):
--------------------------------------
1 - :N (NUMBER): 1
Predicate Information (identified by operation id):
---------------------------------------------------
3 - access("ID"=:N)
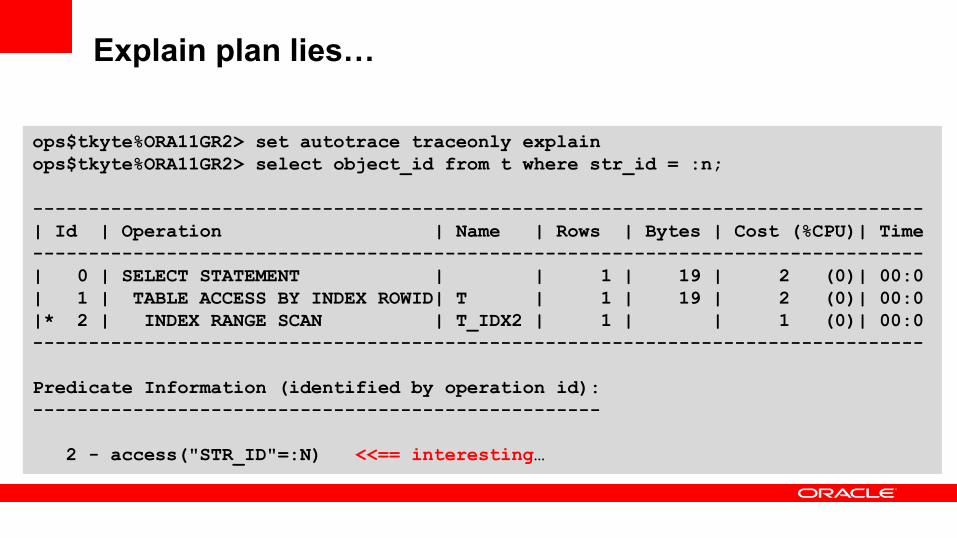
Explain plan lies…
ops$tkyte%ORA11GR2> set autotrace traceonly explain
ops$tkyte%ORA11GR2> select object_id from t where str_id = :n;
--------------------------------------------------------------------------------
| Id | Operation | Name | Rows | Bytes | Cost (%CPU)| Time
--------------------------------------------------------------------------------
| 0 | SELECT STATEMENT | | 1 | 19 | 2 (0)| 00:0
| 1 | TABLE ACCESS BY INDEX ROWID| T | 1 | 19 | 2 (0)| 00:0
|* 2 | INDEX RANGE SCAN | T_IDX2 | 1 | | 1 (0)| 00:0
--------------------------------------------------------------------------------
Predicate Information (identified by operation id):
---------------------------------------------------
2 - access("STR_ID"=:N) <<== interesting…
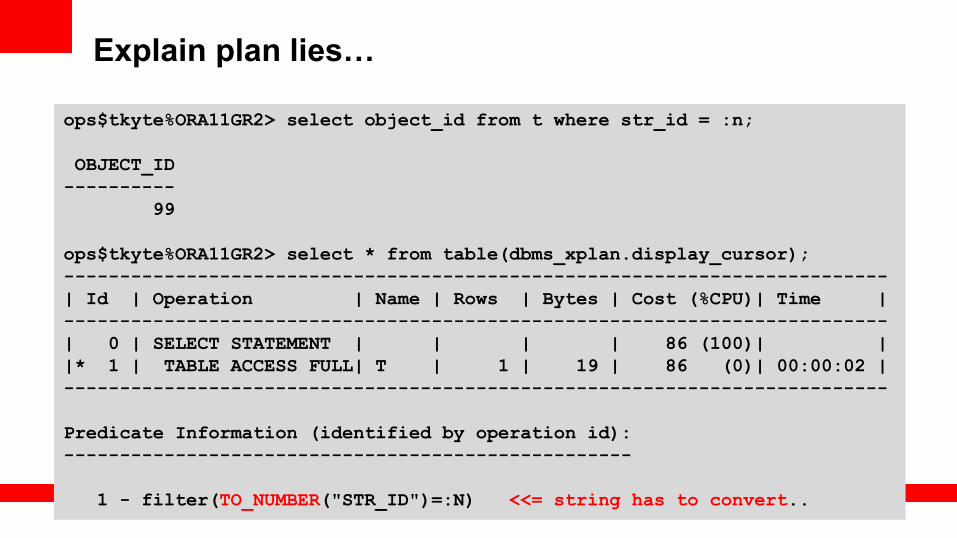
Explain plan lies…
ops$tkyte%ORA11GR2> select object_id from t where str_id = :n;
OBJECT_ID
----------
99
ops$tkyte%ORA11GR2> select * from table(dbms_xplan.display_cursor);
--------------------------------------------------------------------------
| Id | Operation | Name | Rows | Bytes | Cost (%CPU)| Time |
--------------------------------------------------------------------------
| 0 | SELECT STATEMENT | | | | 86 (100)| |
|* 1 | TABLE ACCESS FULL| T | 1 | 19 | 86 (0)| 00:00:02 |
--------------------------------------------------------------------------
Predicate Information (identified by operation id):
---------------------------------------------------
1 - filter(TO_NUMBER("STR_ID")=:N) <<= string has to convert..
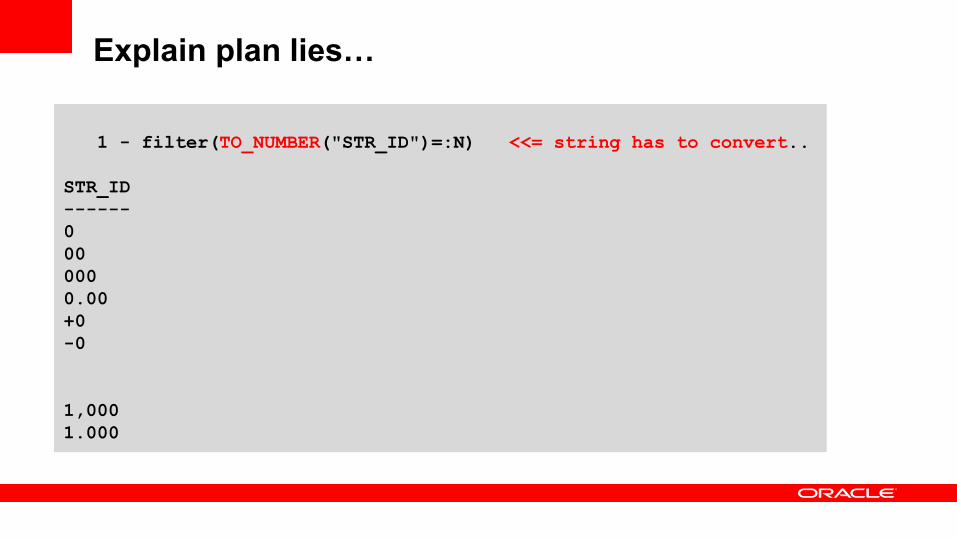
Explain plan lies…
1 - filter(TO_NUMBER("STR_ID")=:N) <<= string has to convert..
STR_ID
------
0
00
000
0.00
+0
-0
1,000
1.000
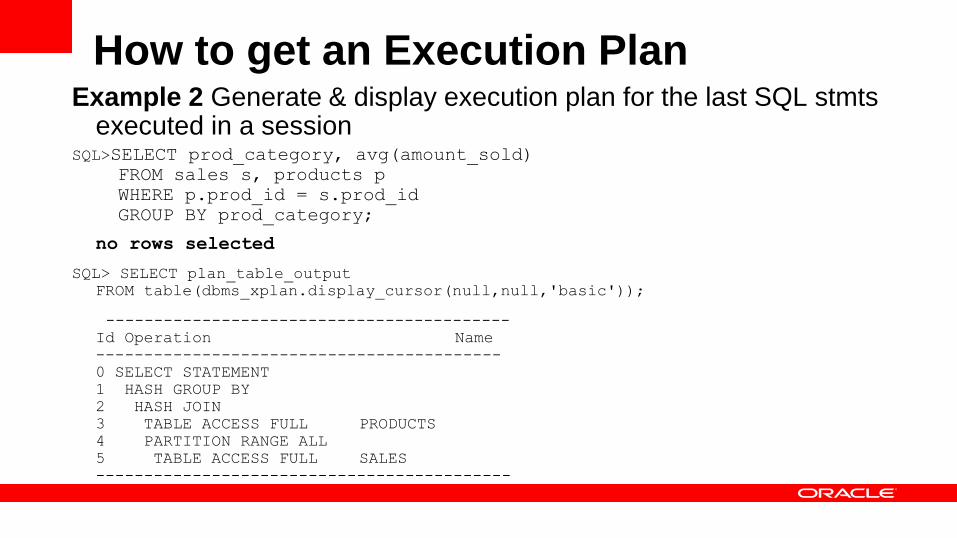
How to get an Execution PlanExample 2 Generate & display execution plan for the last SQL stmts
executed in a sessionSQL>SELECT prod_category, avg(amount_sold)
FROM sales s, products p
WHERE p.prod_id = s.prod_id
GROUP BY prod_category;
no rows selected
SQL> SELECT plan_table_output
FROM table(dbms_xplan.display_cursor(null,null,'basic'));
------------------------------------------
Id Operation Name
------------------------------------------
0 SELECT STATEMENT
1 HASH GROUP BY
2 HASH JOIN
3 TABLE ACCESS FULL PRODUCTS
4 PARTITION RANGE ALL
5 TABLE ACCESS FULL SALES
-------------------------------------------
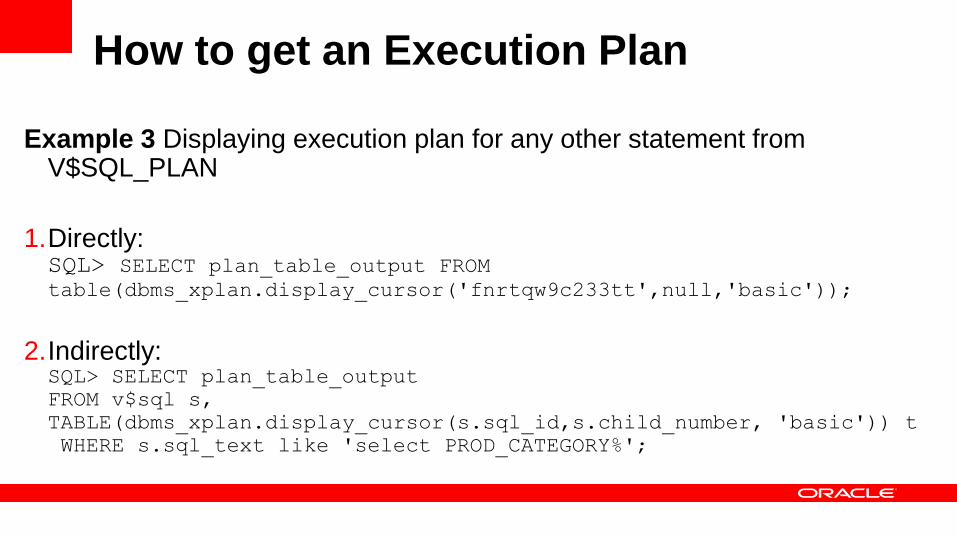
How to get an Execution Plan
Example 3 Displaying execution plan for any other statement from V$SQL_PLAN
1.Directly:SQL> SELECT plan_table_output FROM
table(dbms_xplan.display_cursor('fnrtqw9c233tt',null,'basic'));
2.Indirectly:SQL> SELECT plan_table_output
FROM v$sql s,
TABLE(dbms_xplan.display_cursor(s.sql_id,s.child_number, 'basic')) t
WHERE s.sql_text like 'select PROD_CATEGORY%';
Copyright © 2012, Oracle and/or its affiliates. All rights
reserved.
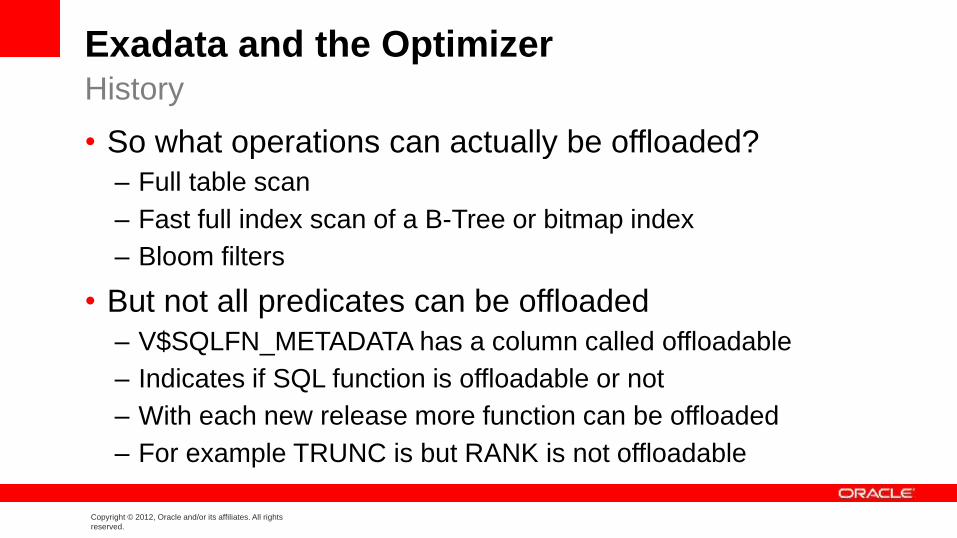
Exadata and the Optimizer
• So what operations can actually be offloaded?
– Full table scan
– Fast full index scan of a B-Tree or bitmap index
– Bloom filters
• But not all predicates can be offloaded
– V$SQLFN_METADATA has a column called offloadable
– Indicates if SQL function is offloadable or not
– With each new release more function can be offloaded
– For example TRUNC is but RANK is not offloadable
History
Copyright © 2012, Oracle and/or its affiliates. All rights
reserved.
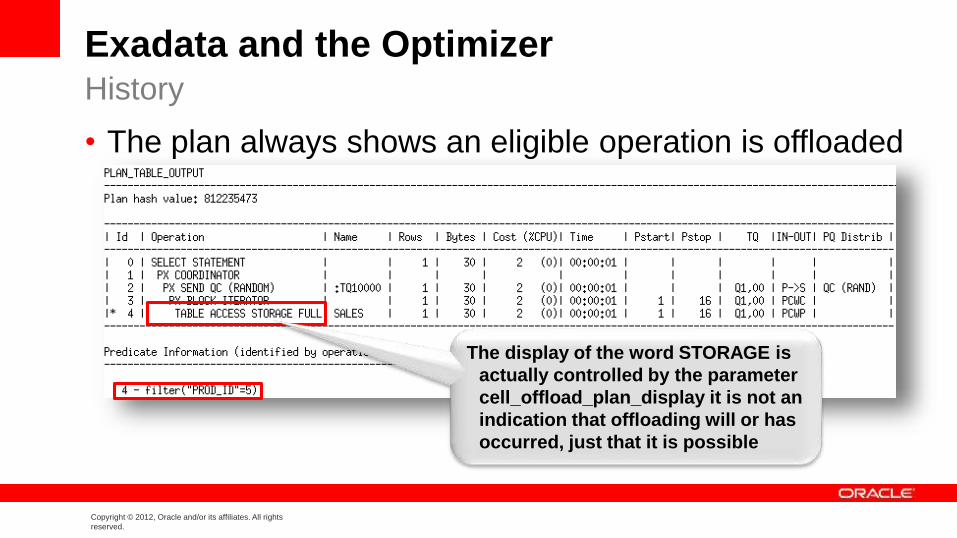
Exadata and the Optimizer
• The plan always shows an eligible operation is offloaded
History
The display of the word STORAGE is
actually controlled by the parameter
cell_offload_plan_display it is not an
indication that offloading will or has
occurred, just that it is possible
Copyright © 2012, Oracle and/or its affiliates. All rights
reserved.
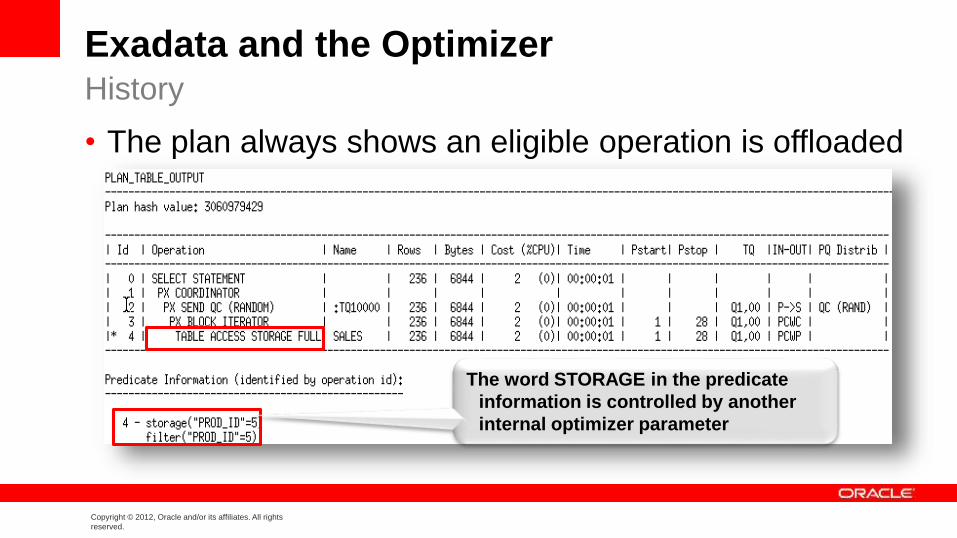
Exadata and the Optimizer
• The plan always shows an eligible operation is offloaded
History
The word STORAGE in the predicate
information is controlled by another
internal optimizer parameter
<Insert Picture Here>
What is a good plan for the optimizer
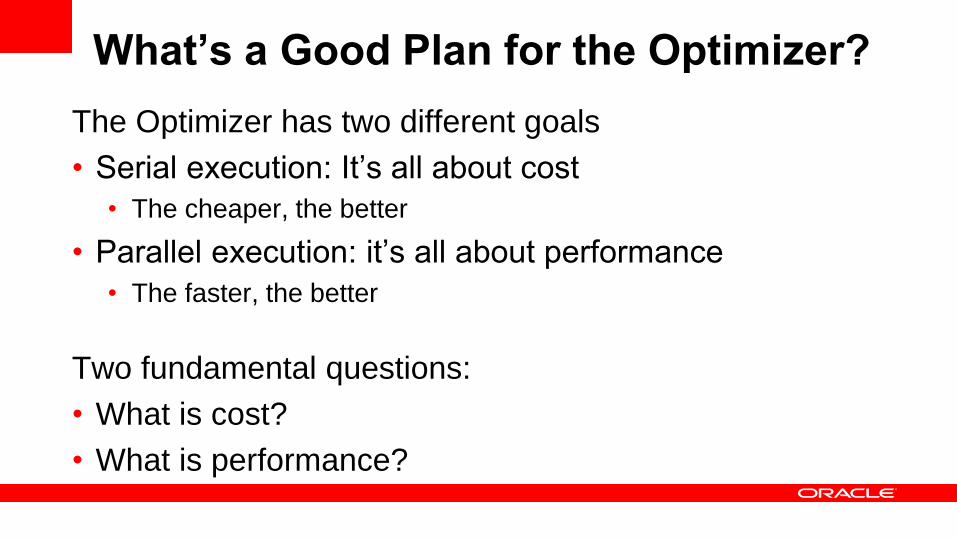
What’s a Good Plan for the Optimizer?
The Optimizer has two different goals
• Serial execution: It’s all about cost
• The cheaper, the better
• Parallel execution: it’s all about performance
• The faster, the better
Two fundamental questions:
• What is cost?
• What is performance?
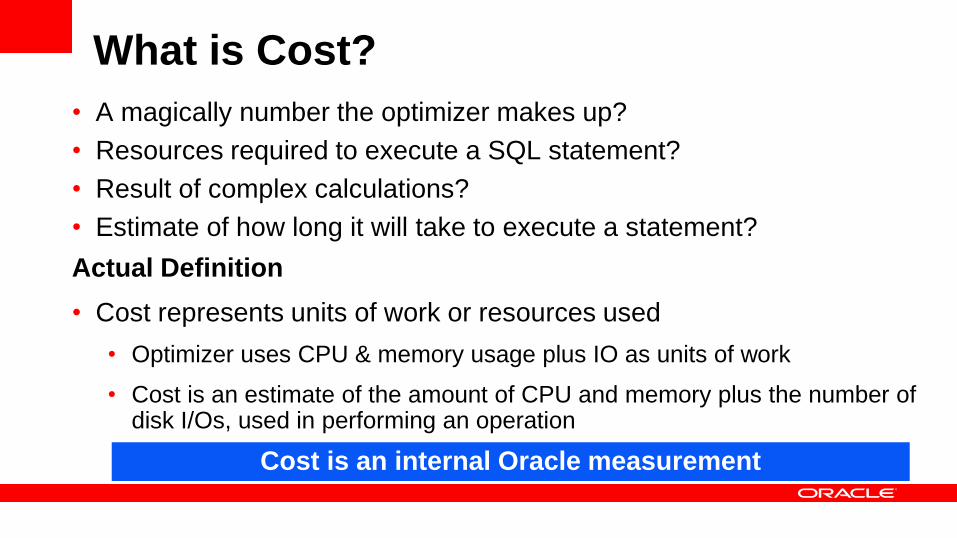
What is Cost?
• A magically number the optimizer makes up?
• Resources required to execute a SQL statement?
• Result of complex calculations?
• Estimate of how long it will take to execute a statement?
Actual Definition
• Cost represents units of work or resources used
• Optimizer uses CPU & memory usage plus IO as units of work
• Cost is an estimate of the amount of CPU and memory plus the number of disk I/Os, used in performing an operation
Cost is an internal Oracle measurement
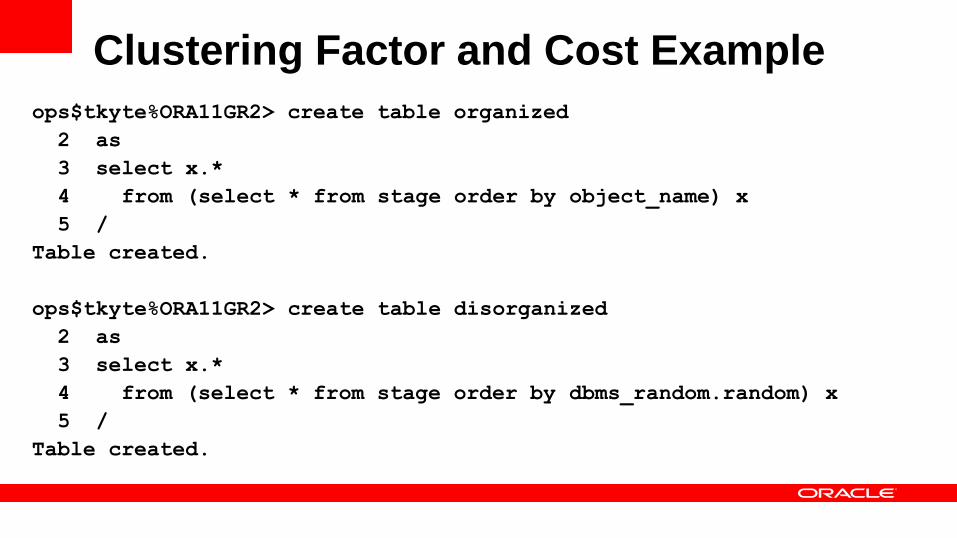
Clustering Factor and Cost Example
ops$tkyte%ORA11GR2> create table organized
2 as
3 select x.*
4 from (select * from stage order by object_name) x
5 /
Table created.
ops$tkyte%ORA11GR2> create table disorganized
2 as
3 select x.*
4 from (select * from stage order by dbms_random.random) x
5 /
Table created.
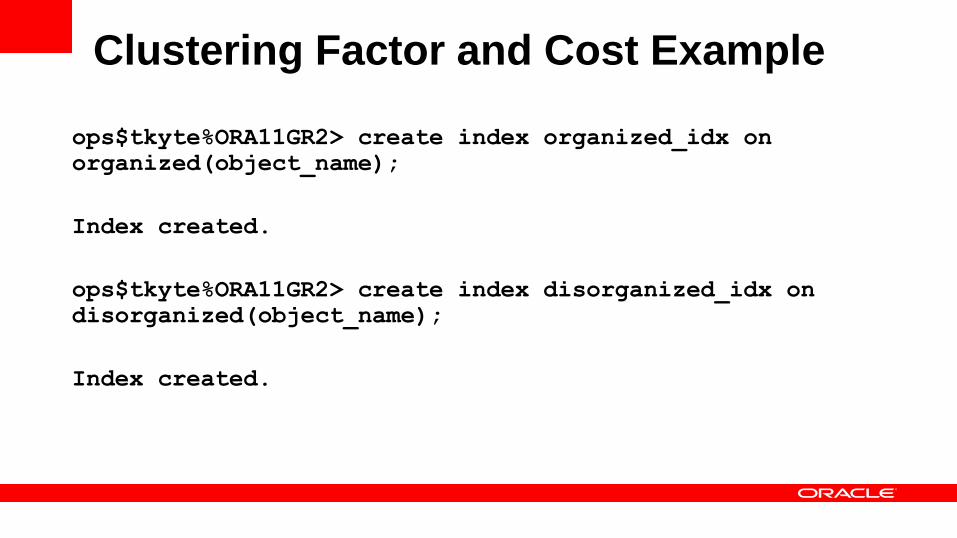
Clustering Factor and Cost Example
ops$tkyte%ORA11GR2> create index organized_idx on
organized(object_name);
Index created.
ops$tkyte%ORA11GR2> create index disorganized_idx on
disorganized(object_name);
Index created.
Clustering Factor and Cost Example
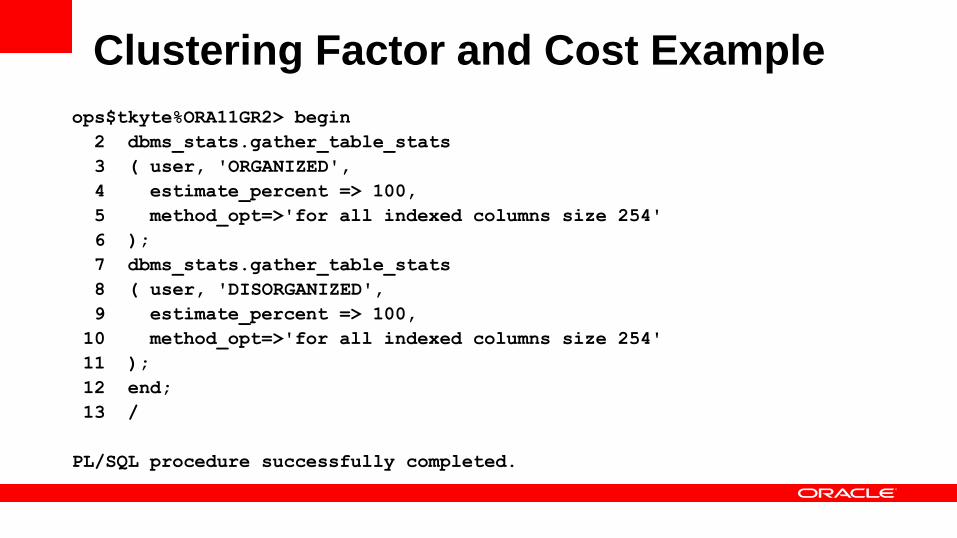
ops$tkyte%ORA11GR2> begin
2 dbms_stats.gather_table_stats
3 ( user, 'ORGANIZED',
4 estimate_percent => 100,
5 method_opt=>'for all indexed columns size 254'
6 );
7 dbms_stats.gather_table_stats
8 ( user, 'DISORGANIZED',
9 estimate_percent => 100,
10 method_opt=>'for all indexed columns size 254'
11 );
12 end;
13 /
PL/SQL procedure successfully completed.
Clustering Factor and Cost Example
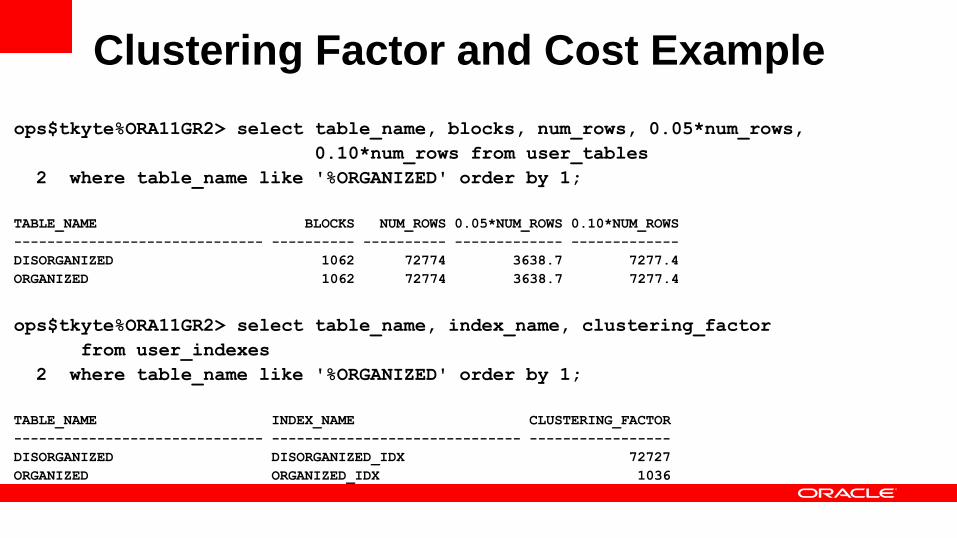
ops$tkyte%ORA11GR2> select table_name, blocks, num_rows, 0.05*num_rows,
0.10*num_rows from user_tables
2 where table_name like '%ORGANIZED' order by 1;
TABLE_NAME BLOCKS NUM_ROWS 0.05*NUM_ROWS 0.10*NUM_ROWS
------------------------------ ---------- ---------- ------------- -------------
DISORGANIZED 1062 72774 3638.7 7277.4
ORGANIZED 1062 72774 3638.7 7277.4
ops$tkyte%ORA11GR2> select table_name, index_name, clustering_factor
from user_indexes
2 where table_name like '%ORGANIZED' order by 1;
TABLE_NAME INDEX_NAME CLUSTERING_FACTOR
------------------------------ ------------------------------ -----------------
DISORGANIZED DISORGANIZED_IDX 72727
ORGANIZED ORGANIZED_IDX 1036
Clustering Factor and Cost Example
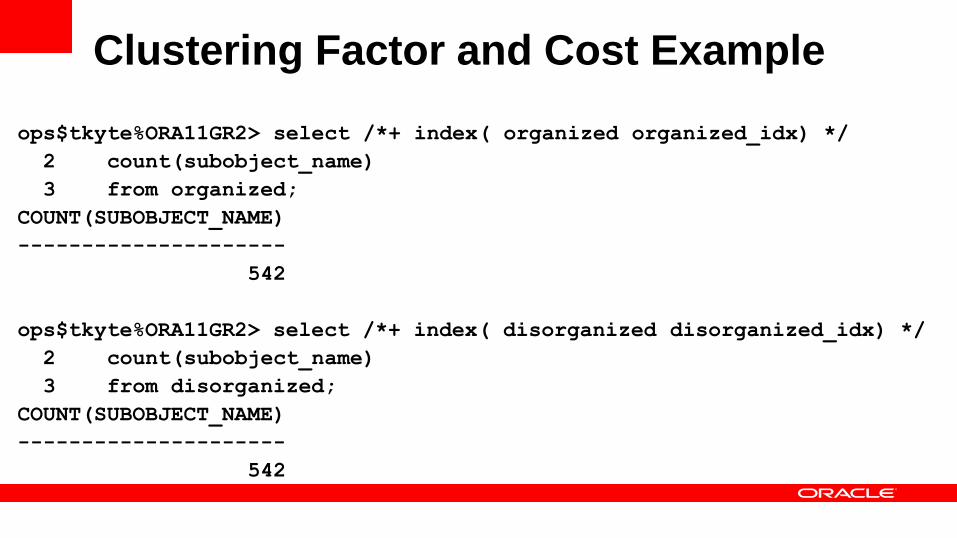
ops$tkyte%ORA11GR2> select /*+ index( organized organized_idx) */
2 count(subobject_name)
3 from organized;
COUNT(SUBOBJECT_NAME)
---------------------
542
ops$tkyte%ORA11GR2> select /*+ index( disorganized disorganized_idx) */
2 count(subobject_name)
3 from disorganized;
COUNT(SUBOBJECT_NAME)
---------------------
542
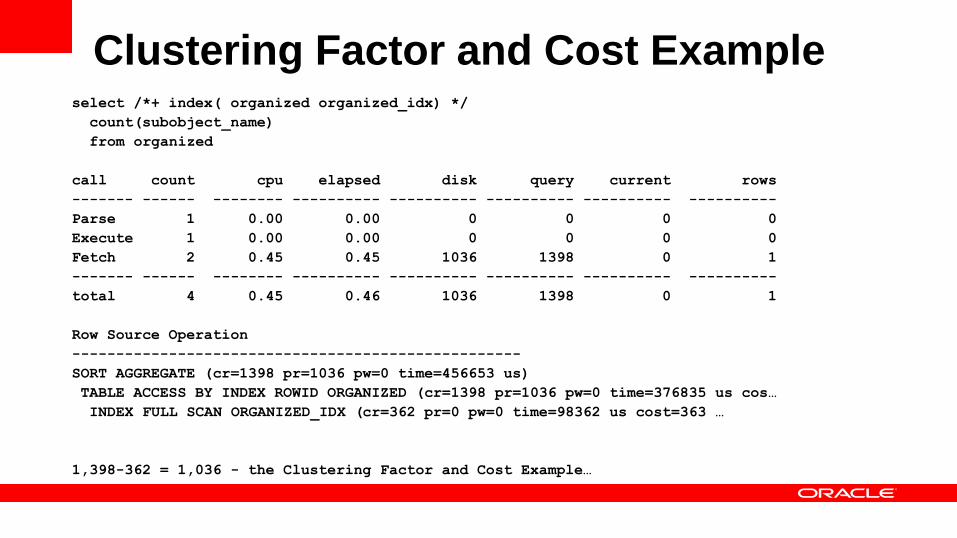
Clustering Factor and Cost Exampleselect /*+ index( organized organized_idx) */
count(subobject_name)
from organized
call count cpu elapsed disk query current rows
------- ------ -------- ---------- ---------- ---------- ---------- ----------
Parse 1 0.00 0.00 0 0 0 0
Execute 1 0.00 0.00 0 0 0 0
Fetch 2 0.45 0.45 1036 1398 0 1
------- ------ -------- ---------- ---------- ---------- ---------- ----------
total 4 0.45 0.46 1036 1398 0 1
Row Source Operation
---------------------------------------------------
SORT AGGREGATE (cr=1398 pr=1036 pw=0 time=456653 us)
TABLE ACCESS BY INDEX ROWID ORGANIZED (cr=1398 pr=1036 pw=0 time=376835 us cos…
INDEX FULL SCAN ORGANIZED_IDX (cr=362 pr=0 pw=0 time=98362 us cost=363 …
1,398-362 = 1,036 - the Clustering Factor and Cost Example…
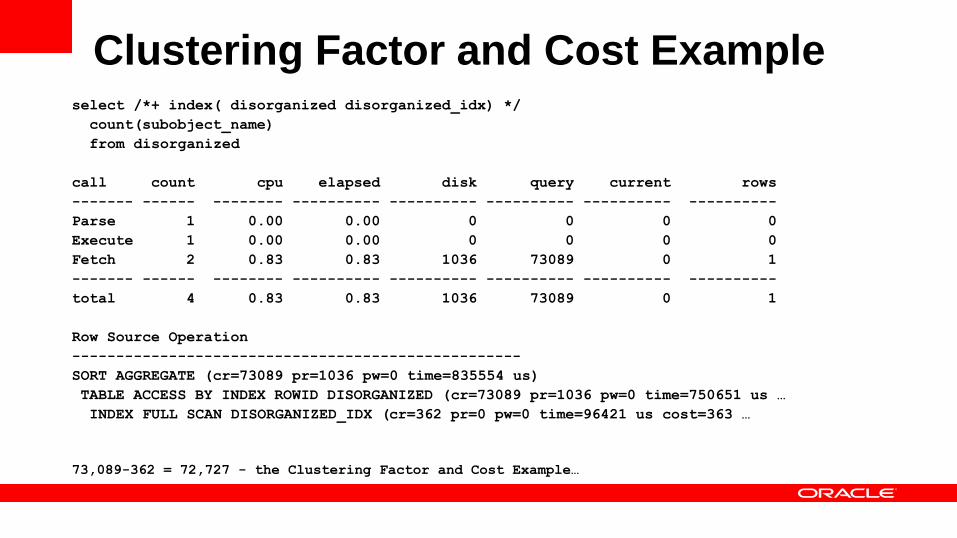
Clustering Factor and Cost Exampleselect /*+ index( disorganized disorganized_idx) */
count(subobject_name)
from disorganized
call count cpu elapsed disk query current rows
------- ------ -------- ---------- ---------- ---------- ---------- ----------
Parse 1 0.00 0.00 0 0 0 0
Execute 1 0.00 0.00 0 0 0 0
Fetch 2 0.83 0.83 1036 73089 0 1
------- ------ -------- ---------- ---------- ---------- ---------- ----------
total 4 0.83 0.83 1036 73089 0 1
Row Source Operation
---------------------------------------------------
SORT AGGREGATE (cr=73089 pr=1036 pw=0 time=835554 us)
TABLE ACCESS BY INDEX ROWID DISORGANIZED (cr=73089 pr=1036 pw=0 time=750651 us …
INDEX FULL SCAN DISORGANIZED_IDX (cr=362 pr=0 pw=0 time=96421 us cost=363 …
73,089-362 = 72,727 - the Clustering Factor and Cost Example…

Clustering Factor and Cost Example
ops$tkyte%ORA11GR2> select * from organized where object_name like 'F%';
Execution Plan
----------------------------------------------------------
Plan hash value: 1925627673
-------------------------------------------------------------------------------
| Id | Operation | Name | Rows | Bytes | Cost (%CP
-------------------------------------------------------------------------------
| 0 | SELECT STATEMENT | | 149 | 14453 | 6 (
| 1 | TABLE ACCESS BY INDEX ROWID| ORGANIZED | 149 | 14453 | 6 (
|* 2 | INDEX RANGE SCAN | ORGANIZED_IDX | 149 | | 3 (
-------------------------------------------------------------------------------
Predicate Information (identified by operation id):
---------------------------------------------------
2 - access("OBJECT_NAME" LIKE 'F%')
filter("OBJECT_NAME" LIKE 'F%')

Clustering Factor and Cost Example
ops$tkyte%ORA11GR2> select * from disorganized where object_name like 'F%';
Execution Plan
----------------------------------------------------------
Plan hash value: 3767053355
-------------------------------------------------------------------------------
| Id | Operation | Name | Rows | Bytes | Cost (
-------------------------------------------------------------------------------
| 0 | SELECT STATEMENT | | 149 | 14453 | 152
| 1 | TABLE ACCESS BY INDEX ROWID| DISORGANIZED | 149 | 14453 | 152
|* 2 | INDEX RANGE SCAN | DISORGANIZED_IDX | 149 | | 3
-------------------------------------------------------------------------------
Predicate Information (identified by operation id):
---------------------------------------------------
2 - access("OBJECT_NAME" LIKE 'F%')
filter("OBJECT_NAME" LIKE 'F%')
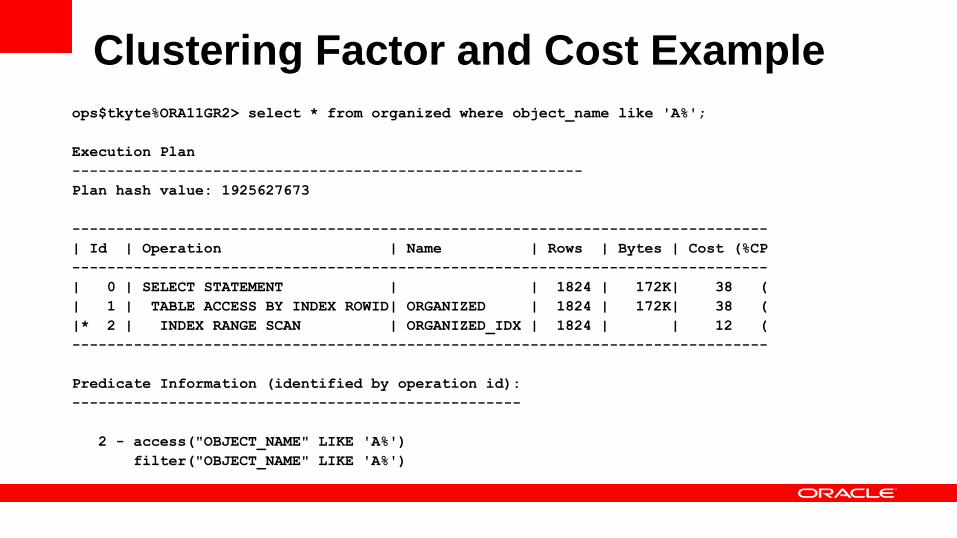
Clustering Factor and Cost Example
ops$tkyte%ORA11GR2> select * from organized where object_name like 'A%';
Execution Plan
----------------------------------------------------------
Plan hash value: 1925627673
-------------------------------------------------------------------------------
| Id | Operation | Name | Rows | Bytes | Cost (%CP
-------------------------------------------------------------------------------
| 0 | SELECT STATEMENT | | 1824 | 172K| 38 (
| 1 | TABLE ACCESS BY INDEX ROWID| ORGANIZED | 1824 | 172K| 38 (
|* 2 | INDEX RANGE SCAN | ORGANIZED_IDX | 1824 | | 12 (
-------------------------------------------------------------------------------
Predicate Information (identified by operation id):
---------------------------------------------------
2 - access("OBJECT_NAME" LIKE 'A%')
filter("OBJECT_NAME" LIKE 'A%')
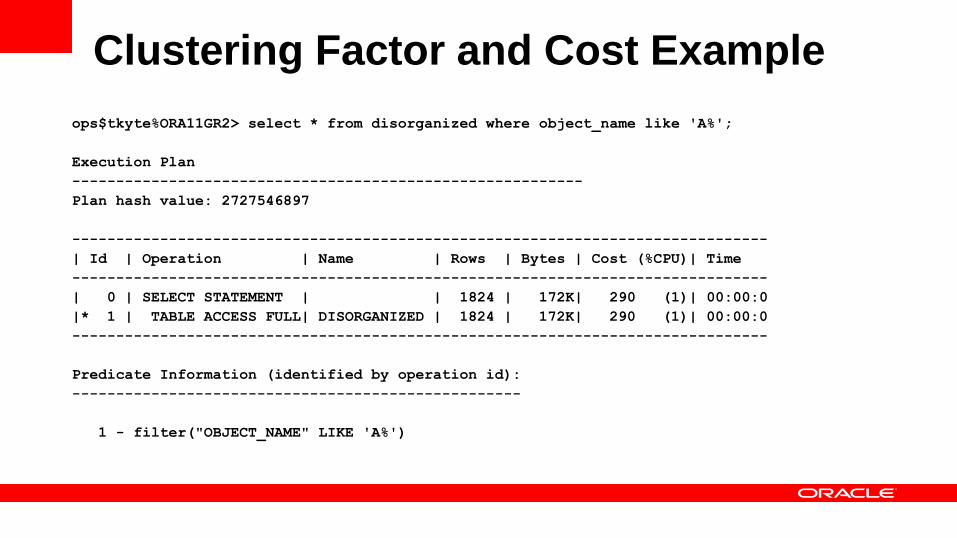
Clustering Factor and Cost Example
ops$tkyte%ORA11GR2> select * from disorganized where object_name like 'A%';
Execution Plan
----------------------------------------------------------
Plan hash value: 2727546897
-------------------------------------------------------------------------------
| Id | Operation | Name | Rows | Bytes | Cost (%CPU)| Time
-------------------------------------------------------------------------------
| 0 | SELECT STATEMENT | | 1824 | 172K| 290 (1)| 00:00:0
|* 1 | TABLE ACCESS FULL| DISORGANIZED | 1824 | 172K| 290 (1)| 00:00:0
-------------------------------------------------------------------------------
Predicate Information (identified by operation id):
---------------------------------------------------
1 - filter("OBJECT_NAME" LIKE 'A%')
Copyright © 2012, Oracle and/or its affiliates. All rights
reserved.
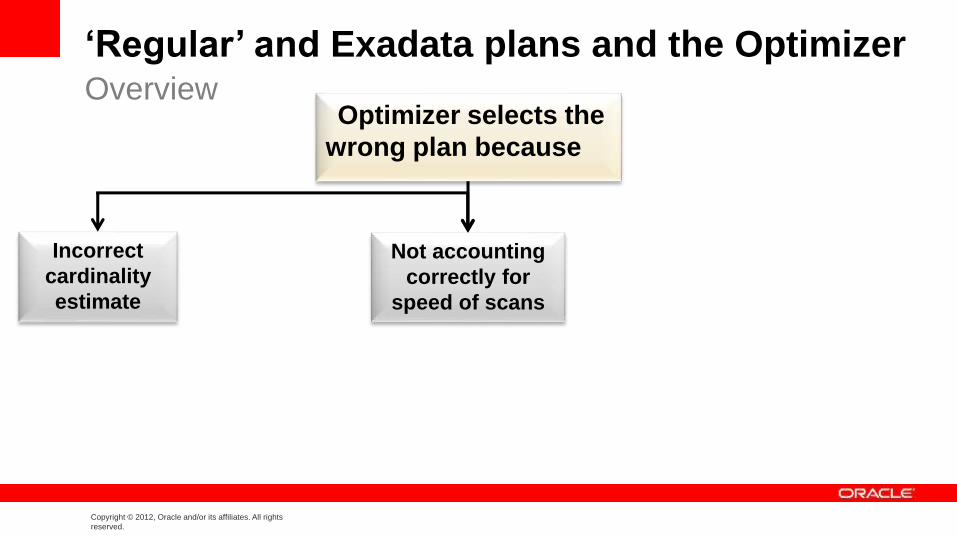
‘Regular’ and Exadata plans and the OptimizerOverview
Optimizer selects the
wrong plan because
Incorrect
cardinality
estimate
Not accounting
correctly for
speed of scans
Copyright © 2012, Oracle and/or its affiliates. All rights
reserved.
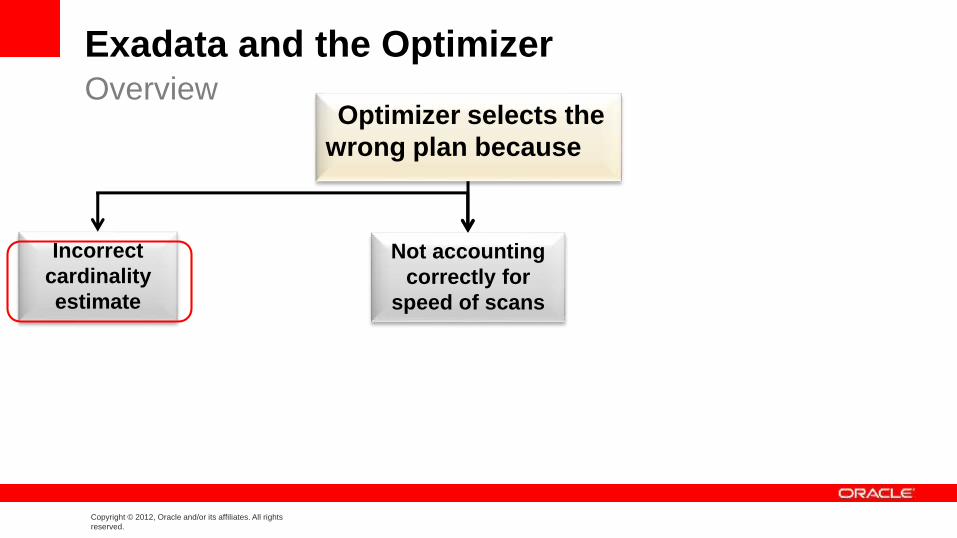
Exadata and the OptimizerOverview
Optimizer selects the
wrong plan because
Incorrect
cardinality
estimate
Not accounting
correctly for
speed of scans
<Insert Picture Here>
Understanding an Execution Plan
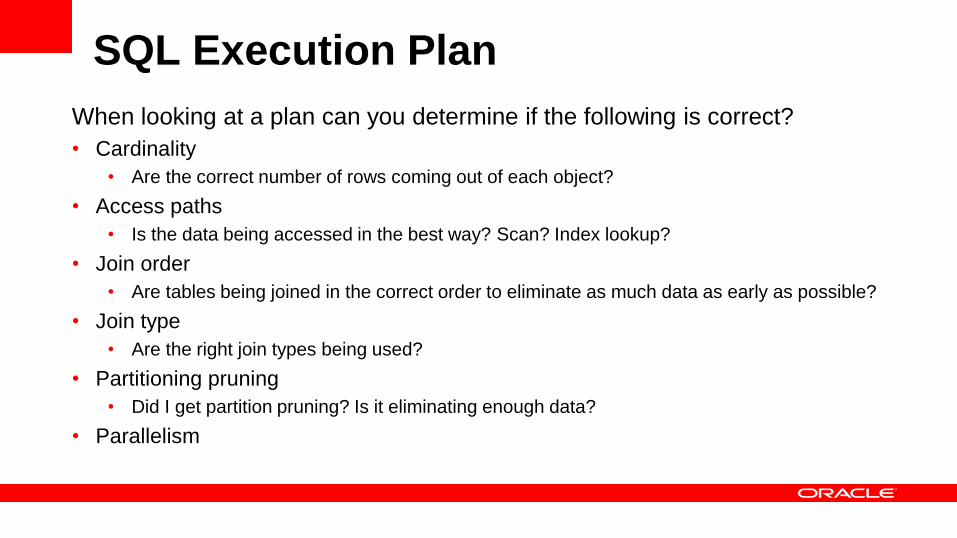
SQL Execution Plan
When looking at a plan can you determine if the following is correct?
• Cardinality
• Are the correct number of rows coming out of each object?
• Access paths
• Is the data being accessed in the best way? Scan? Index lookup?
• Join order
• Are tables being joined in the correct order to eliminate as much data as early as possible?
• Join type
• Are the right join types being used?
• Partitioning pruning
• Did I get partition pruning? Is it eliminating enough data?
• Parallelism
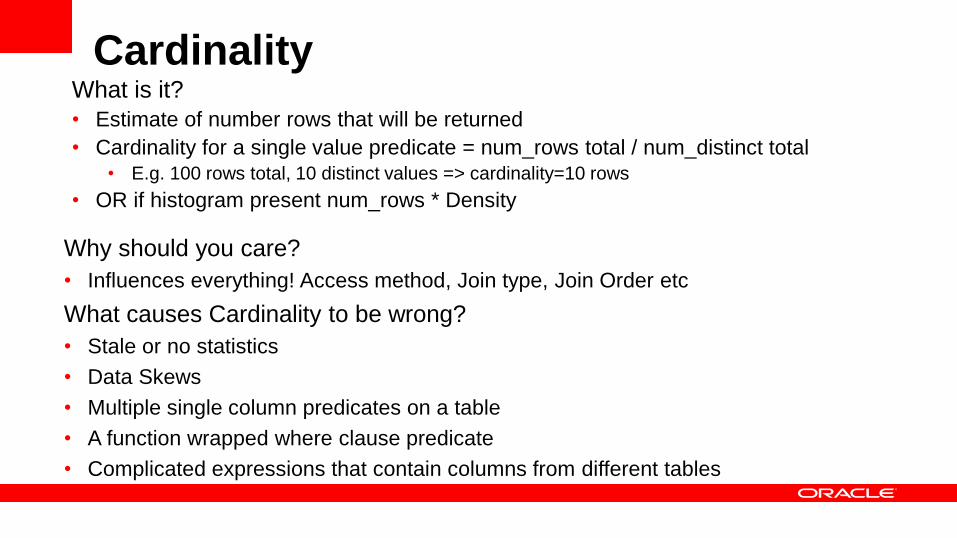
CardinalityWhat is it?
• Estimate of number rows that will be returned
• Cardinality for a single value predicate = num_rows total / num_distinct total
• E.g. 100 rows total, 10 distinct values => cardinality=10 rows
• OR if histogram present num_rows * Density
Why should you care?
• Influences everything! Access method, Join type, Join Order etc
What causes Cardinality to be wrong?
• Stale or no statistics
• Data Skews
• Multiple single column predicates on a table
• A function wrapped where clause predicate
• Complicated expressions that contain columns from different tables
“Wrong Plan =>
Wrong Cardinality”
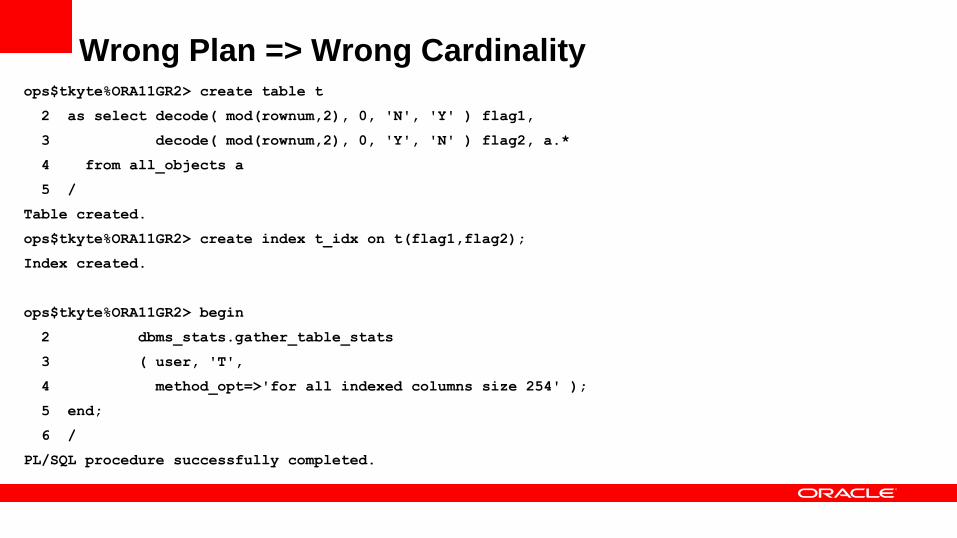
Wrong Plan => Wrong Cardinalityops$tkyte%ORA11GR2> create table t
2 as select decode( mod(rownum,2), 0, 'N', 'Y' ) flag1,
3 decode( mod(rownum,2), 0, 'Y', 'N' ) flag2, a.*
4 from all_objects a
5 /
Table created.
ops$tkyte%ORA11GR2> create index t_idx on t(flag1,flag2);
Index created.
ops$tkyte%ORA11GR2> begin
2 dbms_stats.gather_table_stats
3 ( user, 'T',
4 method_opt=>'for all indexed columns size 254' );
5 end;
6 /
PL/SQL procedure successfully completed.
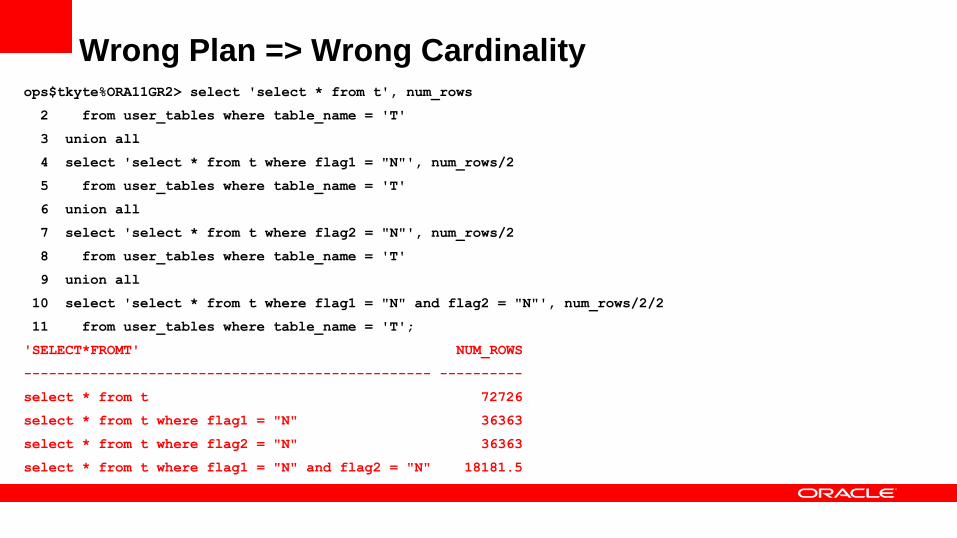
Wrong Plan => Wrong Cardinalityops$tkyte%ORA11GR2> select 'select * from t', num_rows
2 from user_tables where table_name = 'T'
3 union all
4 select 'select * from t where flag1 = "N"', num_rows/2
5 from user_tables where table_name = 'T'
6 union all
7 select 'select * from t where flag2 = "N"', num_rows/2
8 from user_tables where table_name = 'T'
9 union all
10 select 'select * from t where flag1 = "N" and flag2 = "N"', num_rows/2/2
11 from user_tables where table_name = 'T';
'SELECT*FROMT' NUM_ROWS
------------------------------------------------- ----------
select * from t 72726
select * from t where flag1 = "N" 36363
select * from t where flag2 = "N" 36363
select * from t where flag1 = "N" and flag2 = "N" 18181.5
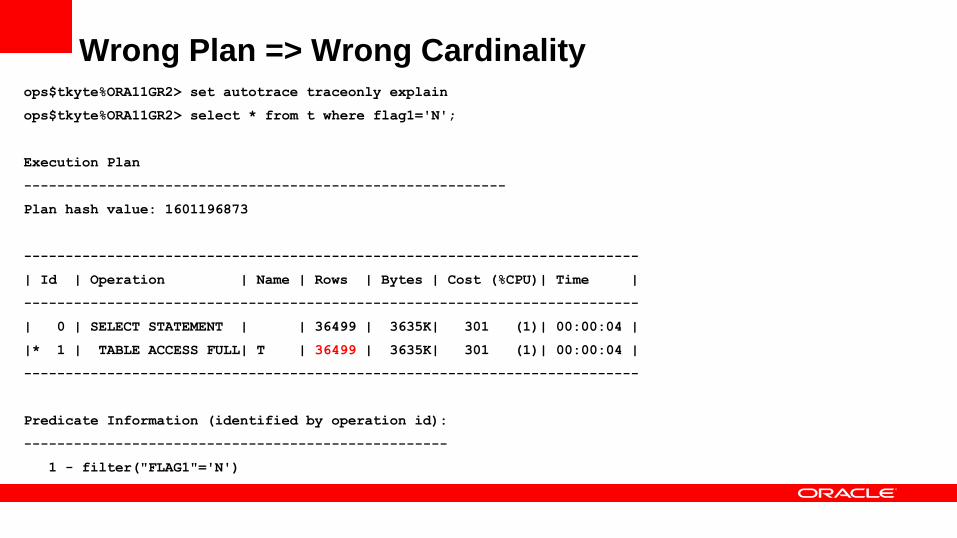
Wrong Plan => Wrong Cardinalityops$tkyte%ORA11GR2> set autotrace traceonly explain
ops$tkyte%ORA11GR2> select * from t where flag1='N';
Execution Plan
----------------------------------------------------------
Plan hash value: 1601196873
--------------------------------------------------------------------------
| Id | Operation | Name | Rows | Bytes | Cost (%CPU)| Time |
--------------------------------------------------------------------------
| 0 | SELECT STATEMENT | | 36499 | 3635K| 301 (1)| 00:00:04 |
|* 1 | TABLE ACCESS FULL| T | 36499 | 3635K| 301 (1)| 00:00:04 |
--------------------------------------------------------------------------
Predicate Information (identified by operation id):
---------------------------------------------------
1 - filter("FLAG1"='N')
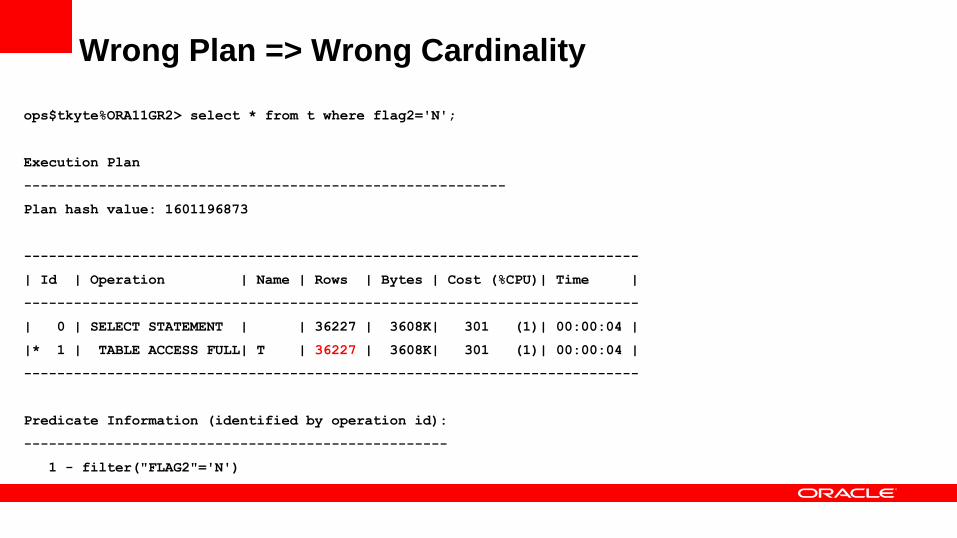
Wrong Plan => Wrong Cardinality
ops$tkyte%ORA11GR2> select * from t where flag2='N';
Execution Plan
----------------------------------------------------------
Plan hash value: 1601196873
--------------------------------------------------------------------------
| Id | Operation | Name | Rows | Bytes | Cost (%CPU)| Time |
--------------------------------------------------------------------------
| 0 | SELECT STATEMENT | | 36227 | 3608K| 301 (1)| 00:00:04 |
|* 1 | TABLE ACCESS FULL| T | 36227 | 3608K| 301 (1)| 00:00:04 |
--------------------------------------------------------------------------
Predicate Information (identified by operation id):
---------------------------------------------------
1 - filter("FLAG2"='N')
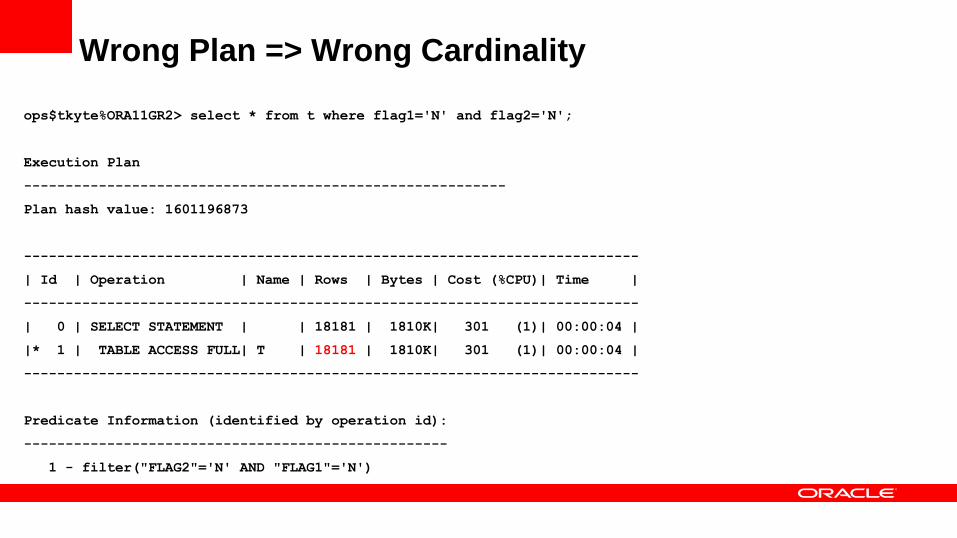
Wrong Plan => Wrong Cardinality
ops$tkyte%ORA11GR2> select * from t where flag1='N' and flag2='N';
Execution Plan
----------------------------------------------------------
Plan hash value: 1601196873
--------------------------------------------------------------------------
| Id | Operation | Name | Rows | Bytes | Cost (%CPU)| Time |
--------------------------------------------------------------------------
| 0 | SELECT STATEMENT | | 18181 | 1810K| 301 (1)| 00:00:04 |
|* 1 | TABLE ACCESS FULL| T | 18181 | 1810K| 301 (1)| 00:00:04 |
--------------------------------------------------------------------------
Predicate Information (identified by operation id):
---------------------------------------------------
1 - filter("FLAG2"='N' AND "FLAG1"='N')
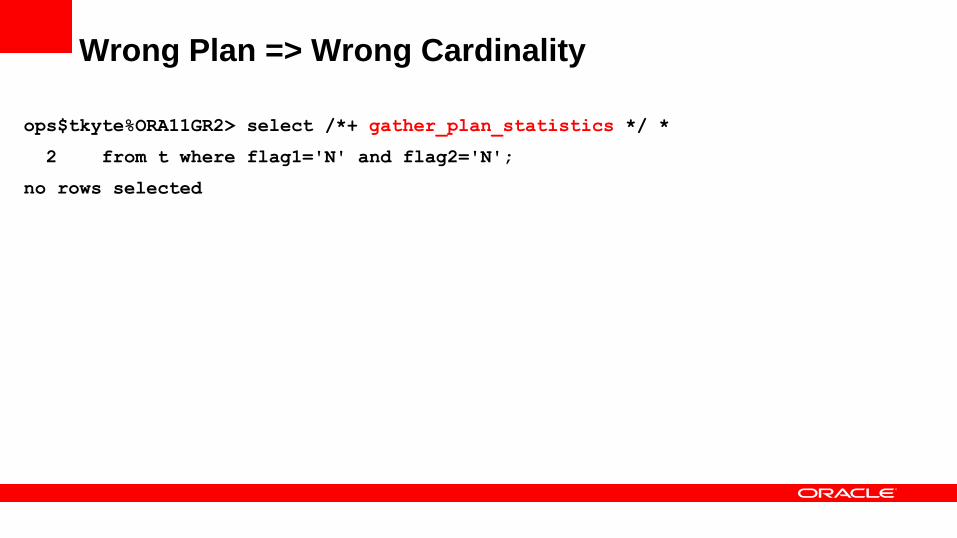
Wrong Plan => Wrong Cardinality
ops$tkyte%ORA11GR2> select /*+ gather_plan_statistics */ *
2 from t where flag1='N' and flag2='N';
no rows selected
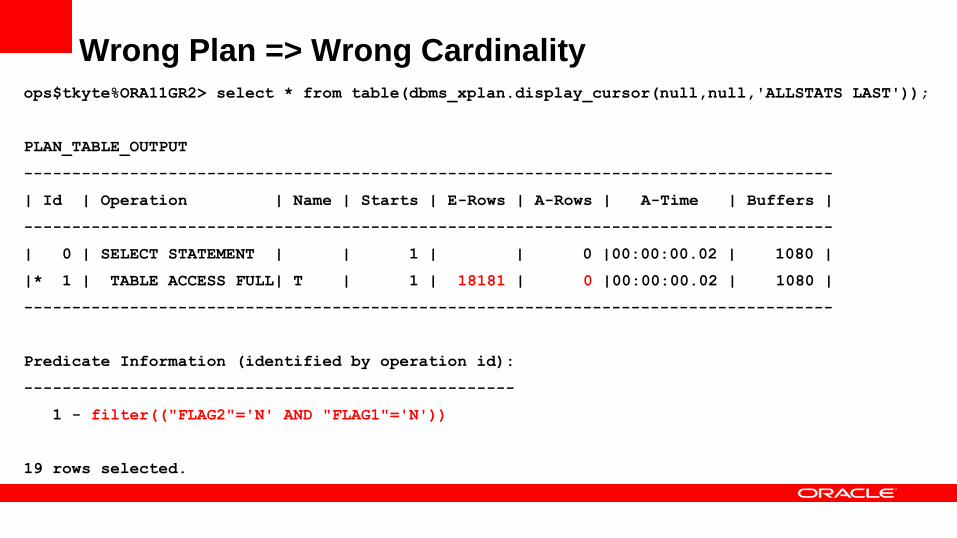
Wrong Plan => Wrong Cardinalityops$tkyte%ORA11GR2> select * from table(dbms_xplan.display_cursor(null,null,'ALLSTATS LAST'));
PLAN_TABLE_OUTPUT
------------------------------------------------------------------------------------
| Id | Operation | Name | Starts | E-Rows | A-Rows | A-Time | Buffers |
------------------------------------------------------------------------------------
| 0 | SELECT STATEMENT | | 1 | | 0 |00:00:00.02 | 1080 |
|* 1 | TABLE ACCESS FULL| T | 1 | 18181 | 0 |00:00:00.02 | 1080 |
------------------------------------------------------------------------------------
Predicate Information (identified by operation id):
---------------------------------------------------
1 - filter(("FLAG2"='N' AND "FLAG1"='N'))
19 rows selected.
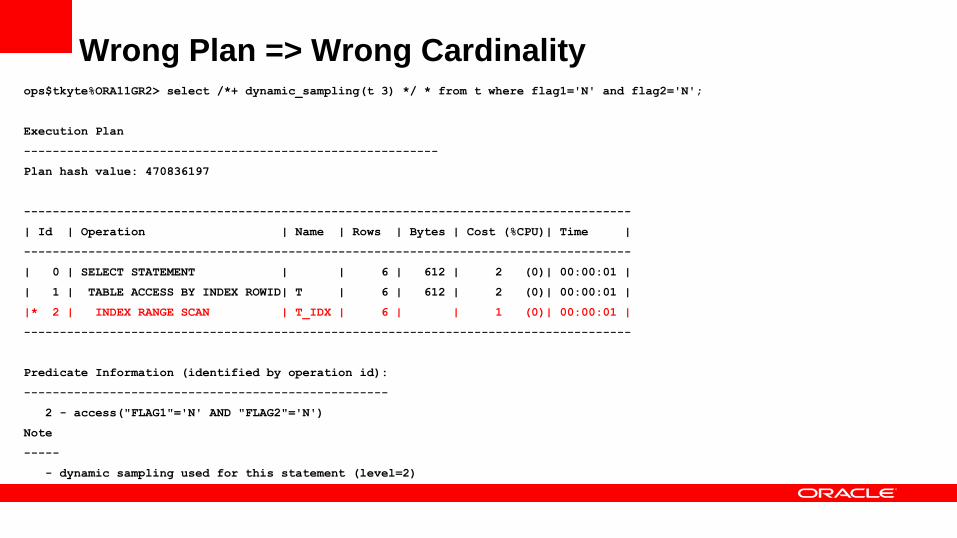
Wrong Plan => Wrong Cardinalityops$tkyte%ORA11GR2> select /*+ dynamic_sampling(t 3) */ * from t where flag1='N' and flag2='N';
Execution Plan
----------------------------------------------------------
Plan hash value: 470836197
-------------------------------------------------------------------------------------
| Id | Operation | Name | Rows | Bytes | Cost (%CPU)| Time |
-------------------------------------------------------------------------------------
| 0 | SELECT STATEMENT | | 6 | 612 | 2 (0)| 00:00:01 |
| 1 | TABLE ACCESS BY INDEX ROWID| T | 6 | 612 | 2 (0)| 00:00:01 |
|* 2 | INDEX RANGE SCAN | T_IDX | 6 | | 1 (0)| 00:00:01 |
-------------------------------------------------------------------------------------
Predicate Information (identified by operation id):
---------------------------------------------------
2 - access("FLAG1"='N' AND "FLAG2"='N')
Note
-----
- dynamic sampling used for this statement (level=2)
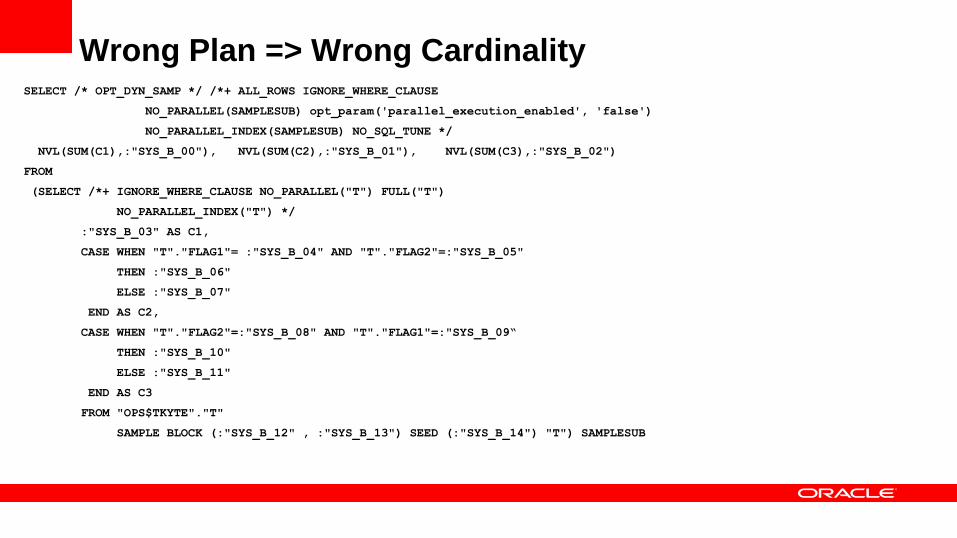
Wrong Plan => Wrong CardinalitySELECT /* OPT_DYN_SAMP */ /*+ ALL_ROWS IGNORE_WHERE_CLAUSE
NO_PARALLEL(SAMPLESUB) opt_param('parallel_execution_enabled', 'false')
NO_PARALLEL_INDEX(SAMPLESUB) NO_SQL_TUNE */
NVL(SUM(C1),:"SYS_B_00"), NVL(SUM(C2),:"SYS_B_01"), NVL(SUM(C3),:"SYS_B_02")
FROM
(SELECT /*+ IGNORE_WHERE_CLAUSE NO_PARALLEL("T") FULL("T")
NO_PARALLEL_INDEX("T") */
:"SYS_B_03" AS C1,
CASE WHEN "T"."FLAG1"= :"SYS_B_04" AND "T"."FLAG2"=:"SYS_B_05"
THEN :"SYS_B_06"
ELSE :"SYS_B_07"
END AS C2,
CASE WHEN "T"."FLAG2"=:"SYS_B_08" AND "T"."FLAG1"=:"SYS_B_09“
THEN :"SYS_B_10"
ELSE :"SYS_B_11"
END AS C3
FROM "OPS$TKYTE"."T"
SAMPLE BLOCK (:"SYS_B_12" , :"SYS_B_13") SEED (:"SYS_B_14") "T") SAMPLESUB
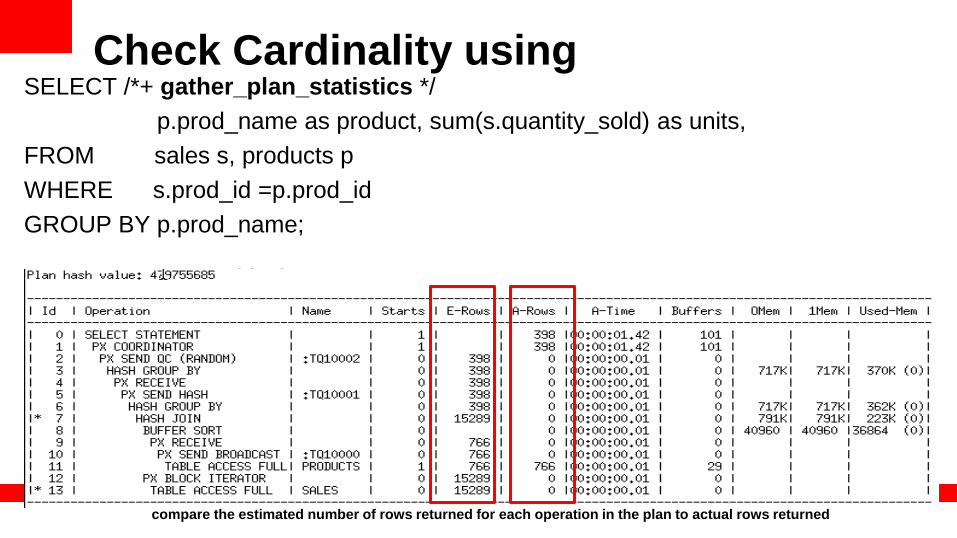
Check Cardinality using SELECT /*+ gather_plan_statistics */
p.prod_name as product, sum(s.quantity_sold) as units,
FROM sales s, products p
WHERE s.prod_id =p.prod_id
GROUP BY p.prod_name;
SELECT * FROM table (
DBMS_XPLAN.DISPLAY_CURSOR(FORMAT=>'ALLSTATS LAST'));
compare the estimated number of rows returned for each operation in the plan to actual rows returned
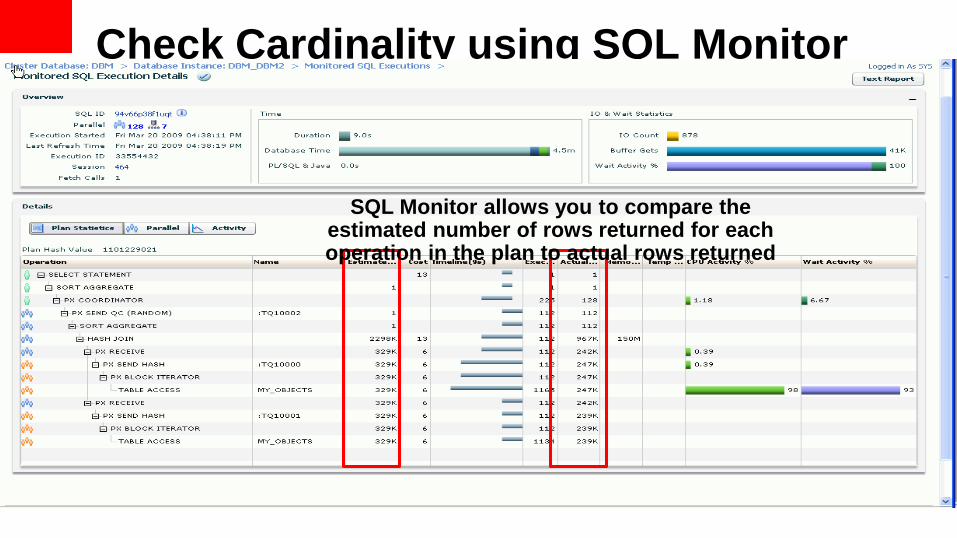
Check Cardinality using SQL Monitor
SQL Monitor allows you to compare the estimated number of rows returned for each operation in the plan to actual rows returned
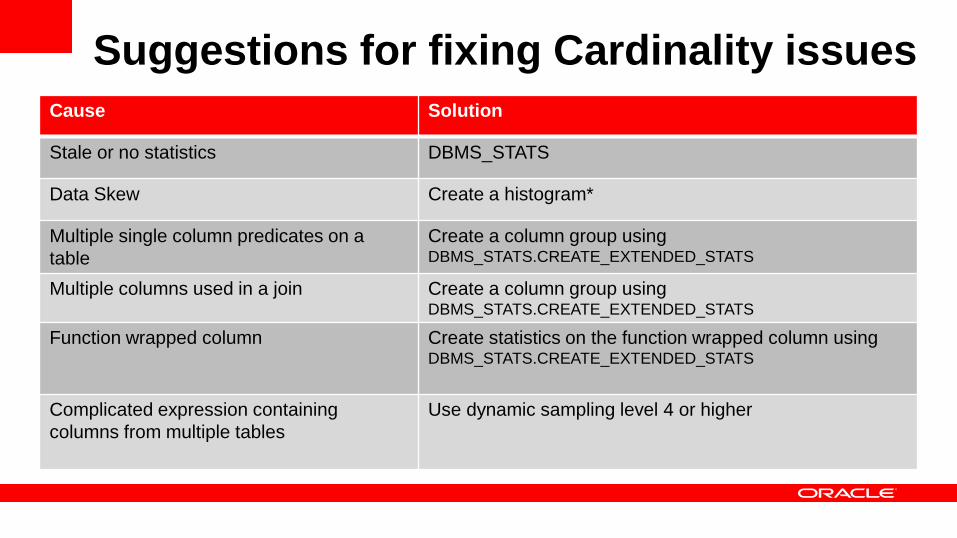
Suggestions for fixing Cardinality issues
Cause Solution
Stale or no statistics DBMS_STATS
Data Skew Create a histogram*
Multiple single column predicates on a
table
Create a column group using DBMS_STATS.CREATE_EXTENDED_STATS
Multiple columns used in a join Create a column group using DBMS_STATS.CREATE_EXTENDED_STATS
Function wrapped column Create statistics on the function wrapped column using DBMS_STATS.CREATE_EXTENDED_STATS
Complicated expression containing
columns from multiple tables
Use dynamic sampling level 4 or higher
Copyright © 2012, Oracle and/or its affiliates. All rights
reserved.
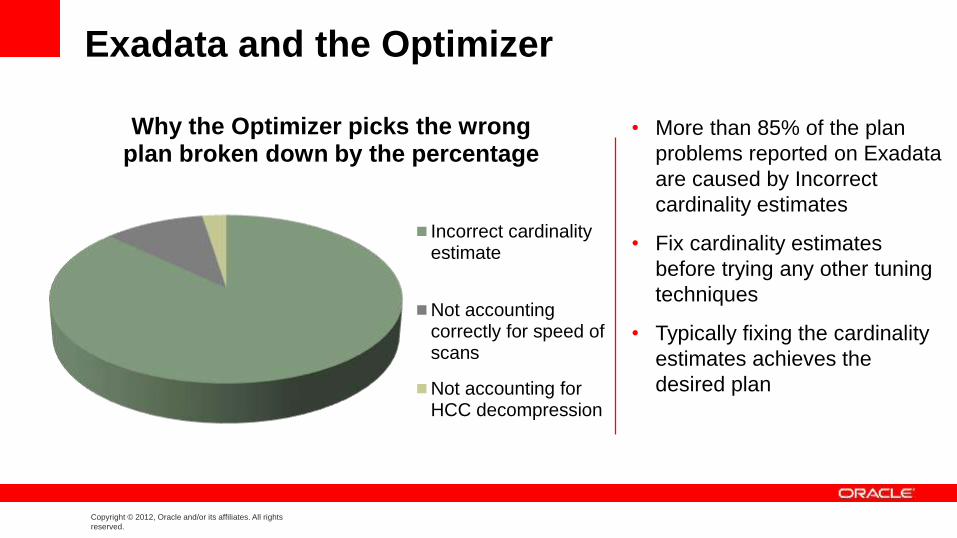
Exadata and the Optimizer
Why the Optimizer picks the wrong plan broken down by the percentage
Incorrect cardinalityestimate
Not accountingcorrectly for speed ofscans
Not accounting forHCC decompression
• More than 85% of the plan
problems reported on Exadata
are caused by Incorrect
cardinality estimates
• Fix cardinality estimates
before trying any other tuning
techniques
• Typically fixing the cardinality
estimates achieves the
desired plan
Copyright © 2012, Oracle and/or its affiliates. All rights
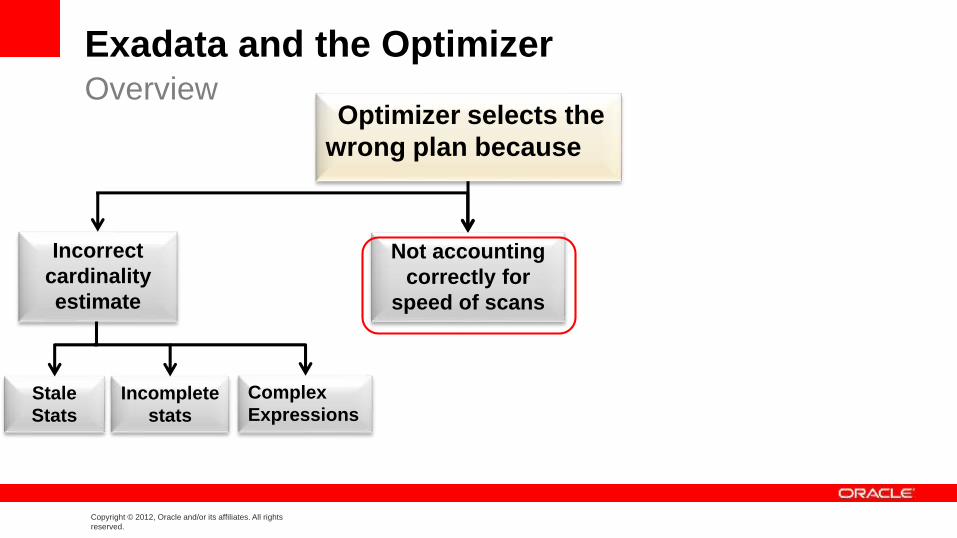
reserved.
Exadata and the Optimizer Overview
Optimizer selects the
wrong plan because
Incorrect
cardinality
estimate
Not accounting
correctly for
speed of scans
Complex
ExpressionsIncomplete
stats
Stale
Stats
Copyright © 2012, Oracle and/or its affiliates. All rights
reserved.
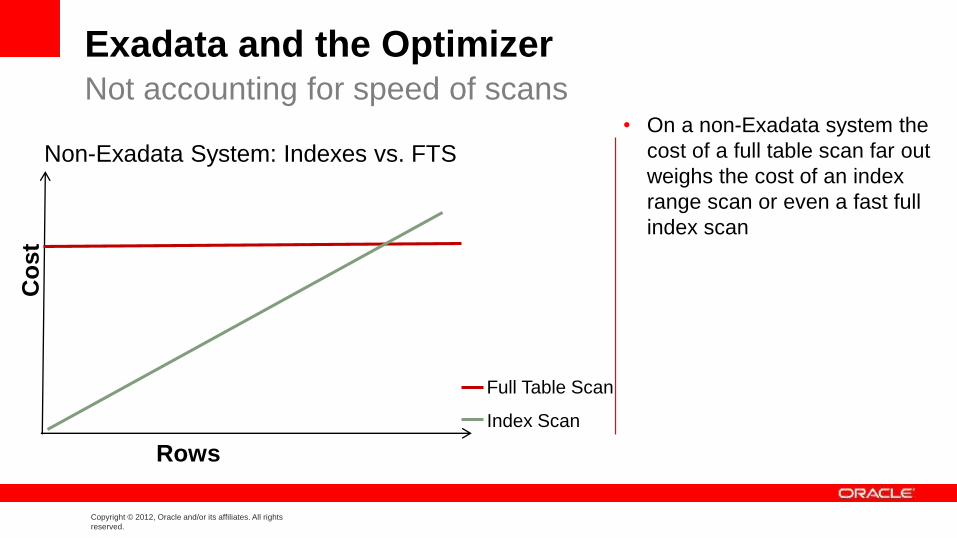
Exadata and the Optimizer
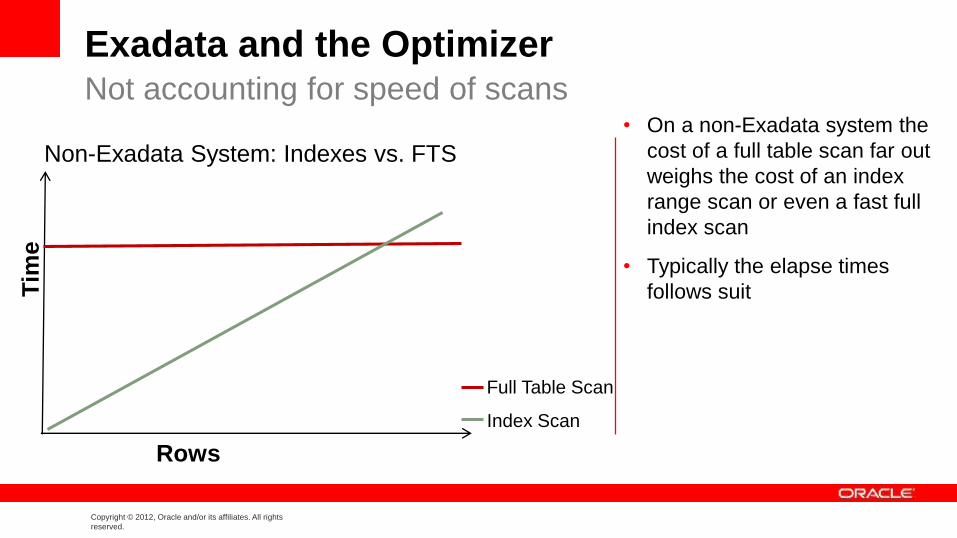
Non-Exadata System: Indexes vs. FTS
Not accounting for speed of scans• On a non-Exadata system the
cost of a full table scan far out
weighs the cost of an index
range scan or even a fast full
index scan
Rows
Full Table Scan
Index Scan
Co
st
Copyright © 2012, Oracle and/or its affiliates. All rights
reserved.
Exadata and the Optimizer
Non-Exadata System: Indexes vs. FTS
Not accounting for speed of scans• On a non-Exadata system the
cost of a full table scan far out
weighs the cost of an index
range scan or even a fast full
index scan
• Typically the elapse times
follows suit
Rows
Full Table Scan
Index Scan
Tim
e
Copyright © 2012, Oracle and/or its affiliates. All rights
reserved.
Exadata and the Optimizer
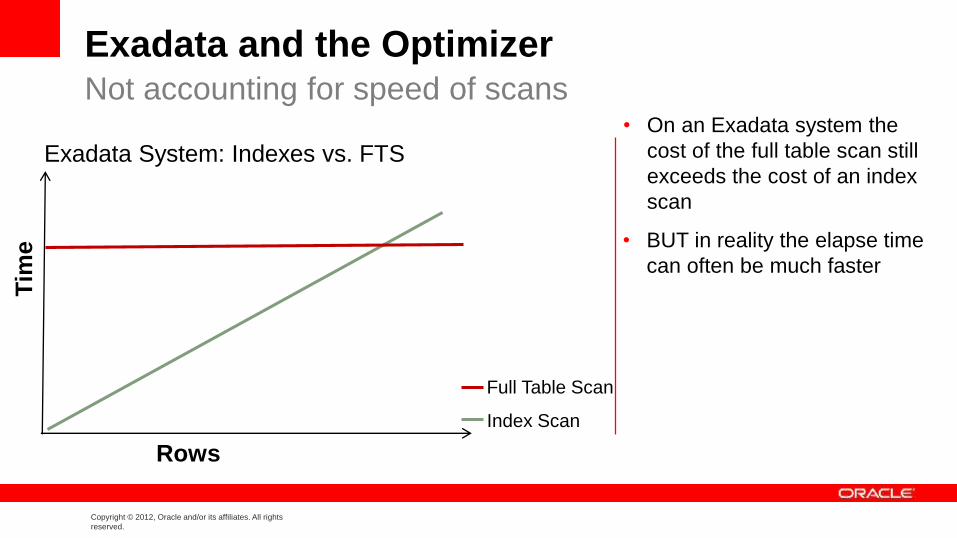
Exadata System: Indexes vs. FTS
Not accounting for speed of scans
Rows
Full Table Scan
Index Scan
• On an Exadata system the
cost of the full table scan still
exceeds the cost of an index
scan
Co
st
Tim
e • BUT in reality the elapse time
can often be much faster
Copyright © 2012, Oracle and/or its affiliates. All rights
reserved.
Exadata and the Optimizer
• TEST_TBL table contains 20 million rows
– 22 Columns consisting of numbers and string data types
• Compressed using HCC query high
• Index created on UK column
– This is a unique index
– Values range from 1 to 20 million
Not accounting correctly for the speed of scan
Copyright © 2012, Oracle and/or its affiliates. All rights
reserved.
Exadata and the Optimizer
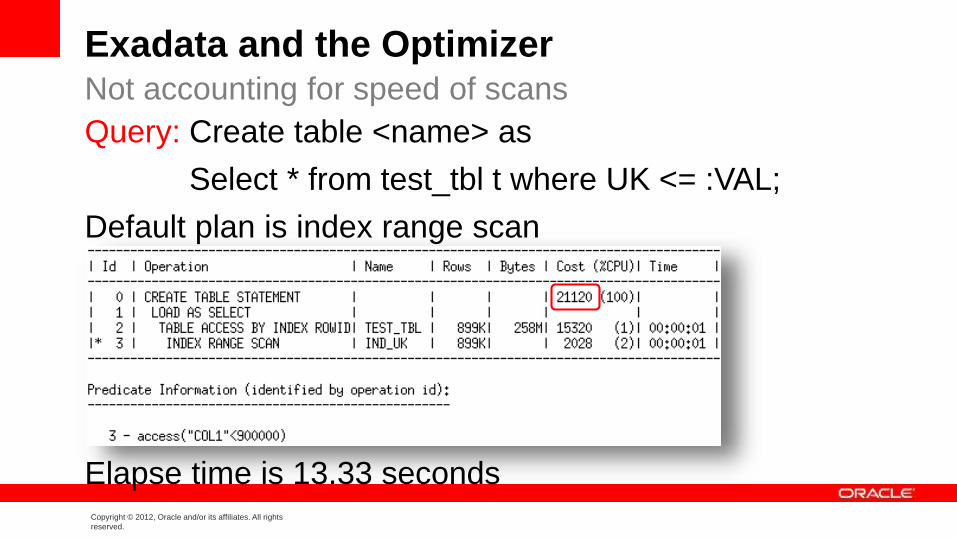
Query: Create table <name> as
Select * from test_tbl t where UK <= :VAL;
Default plan is index range scan
Elapse time is 13.33 seconds
Not accounting for speed of scans
Copyright © 2012, Oracle and/or its affiliates. All rights
reserved.
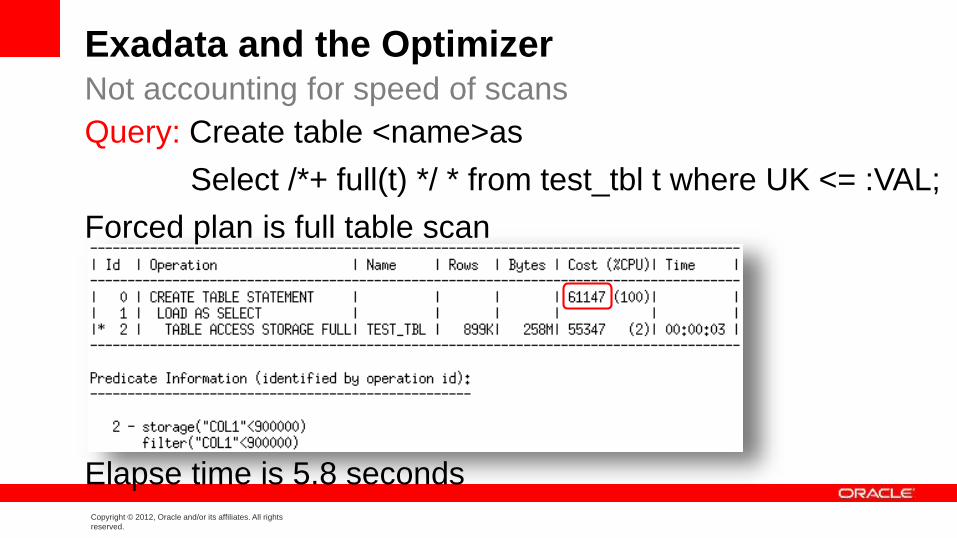
Exadata and the Optimizer
Query: Create table <name>as
Select /*+ full(t) */ * from test_tbl t where UK <= :VAL;
Forced plan is full table scan
Elapse time is 5.8 seconds
Not accounting for speed of scans
Copyright © 2012, Oracle and/or its affiliates. All rights
reserved.
Exadata and the Optimizer
• So the answer is simple
• Drop all of the indexes
• Everything will be faster via a full table scan
Not accounting for speed of scans
• Not so fast
• What happens when you have multiple concurrent users?
Copyright © 2012, Oracle and/or its affiliates. All rights
reserved.
Non-Exadata
Exadata
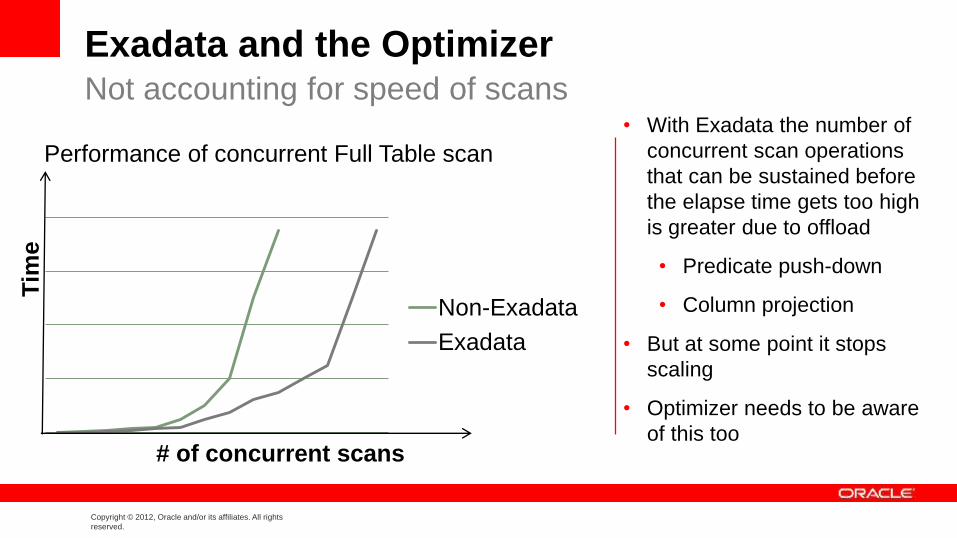
Exadata and the Optimizer
Performance of concurrent Full Table scan
Not accounting for speed of scans
# of concurrent scans
• With Exadata the number of
concurrent scan operations
that can be sustained before
the elapse time gets too high
is greater due to offload
• Predicate push-down
• Column projection
• But at some point it stops
scaling
• Optimizer needs to be aware
of this too
Tim
e
Copyright © 2012, Oracle and/or its affiliates. All rights
reserved.
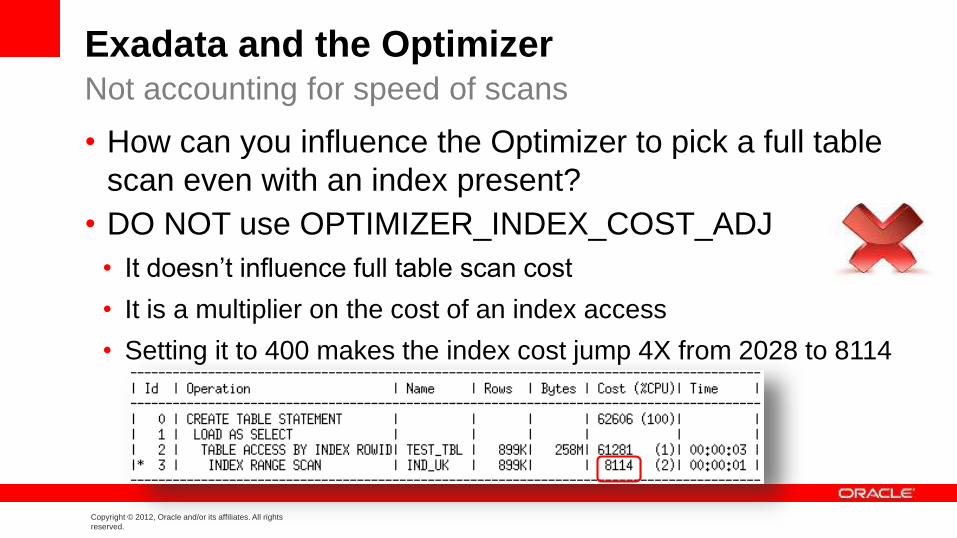
Exadata and the Optimizer
• How can you influence the Optimizer to pick a full table
scan even with an index present?
Not accounting for speed of scans
• DO NOT use OPTIMIZER_INDEX_COST_ADJ
• It doesn’t influence full table scan cost
• It is a multiplier on the cost of an index access
• Setting it to 400 makes the index cost jump 4X from 2028 to 8114
Copyright © 2012, Oracle and/or its affiliates. All rights
reserved.
Exadata and the Optimizer
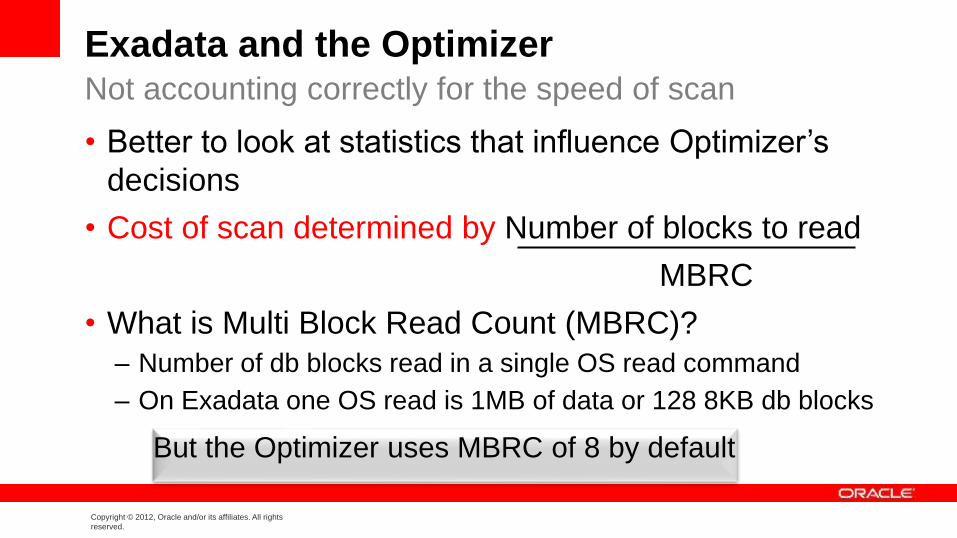
• Better to look at statistics that influence Optimizer’s
decisions
• Cost of scan determined by Number of blocks to read
MBRC
• What is Multi Block Read Count (MBRC)?
– Number of db blocks read in a single OS read command
– On Exadata one OS read is 1MB of data or 128 8KB db blocks
Not accounting correctly for the speed of scan
But the Optimizer uses MBRC of 8 by default
Copyright © 2012, Oracle and/or its affiliates. All rights
reserved.
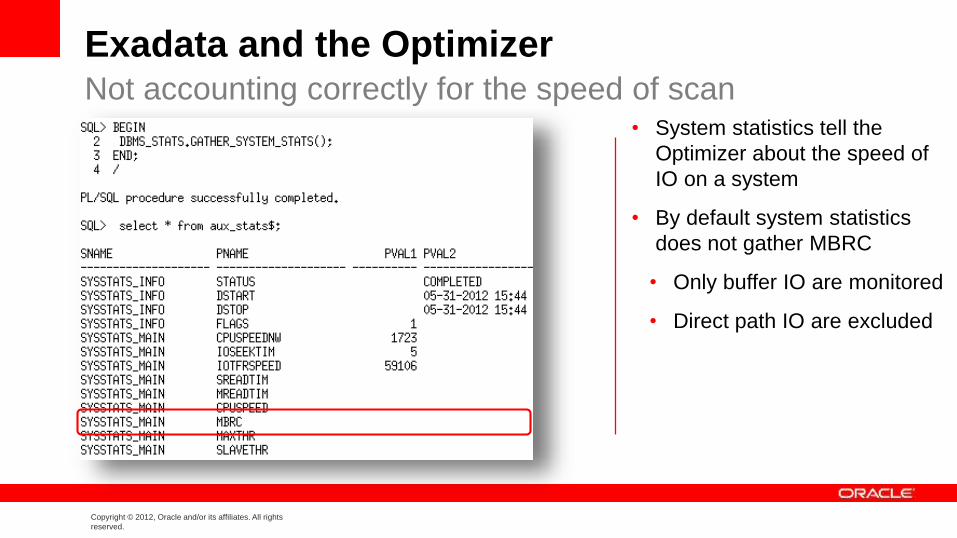
Exadata and the OptimizerNot accounting correctly for the speed of scan
• System statistics tell the
Optimizer about the speed of
IO on a system
• By default system statistics
does not gather MBRC
• Only buffer IO are monitored
• Direct path IO are excluded
Copyright © 2012, Oracle and/or its affiliates. All rights
reserved.
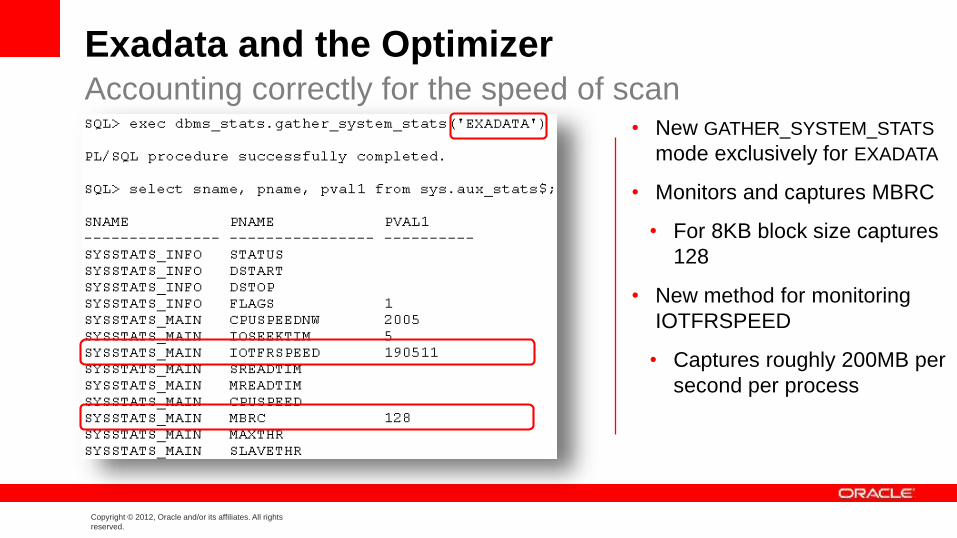
Exadata and the OptimizerAccounting correctly for the speed of scan
• New GATHER_SYSTEM_STATS
mode exclusively for EXADATA
• Monitors and captures MBRC
• For 8KB block size captures
128
• New method for monitoring
IOTFRSPEED
• Captures roughly 200MB per
second per process
Copyright © 2012, Oracle and/or its affiliates. All rights
reserved.
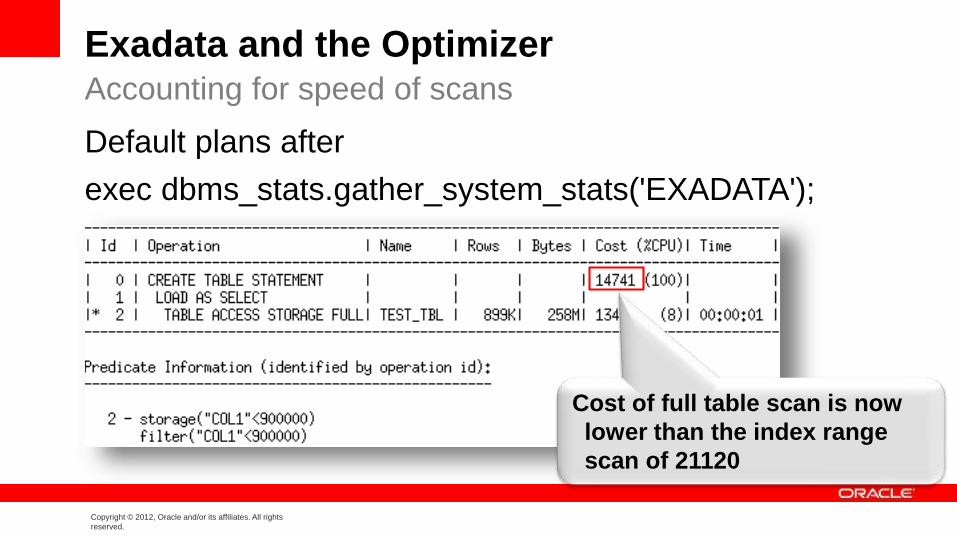
Exadata and the Optimizer
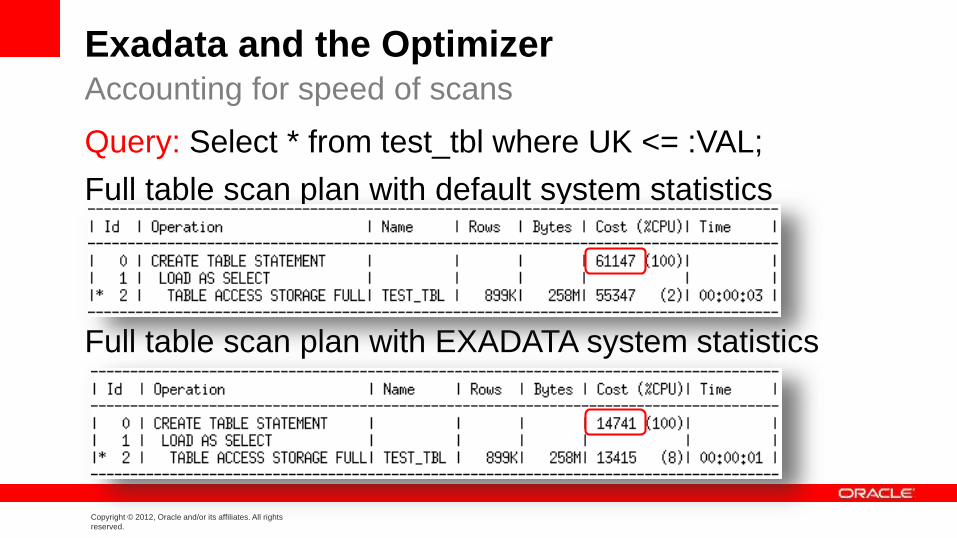
Default plans after
exec dbms_stats.gather_system_stats('EXADATA');
Accounting for speed of scans
Cost of full table scan is now
lower than the index range
scan of 21120
Copyright © 2012, Oracle and/or its affiliates. All rights
reserved.
Exadata and the Optimizer
Query: Select * from test_tbl where UK <= :VAL;
Full table scan plan with default system statistics
Full table scan plan with EXADATA system statistics
Accounting for speed of scans
Copyright © 2012, Oracle and/or its affiliates. All rights
reserved.
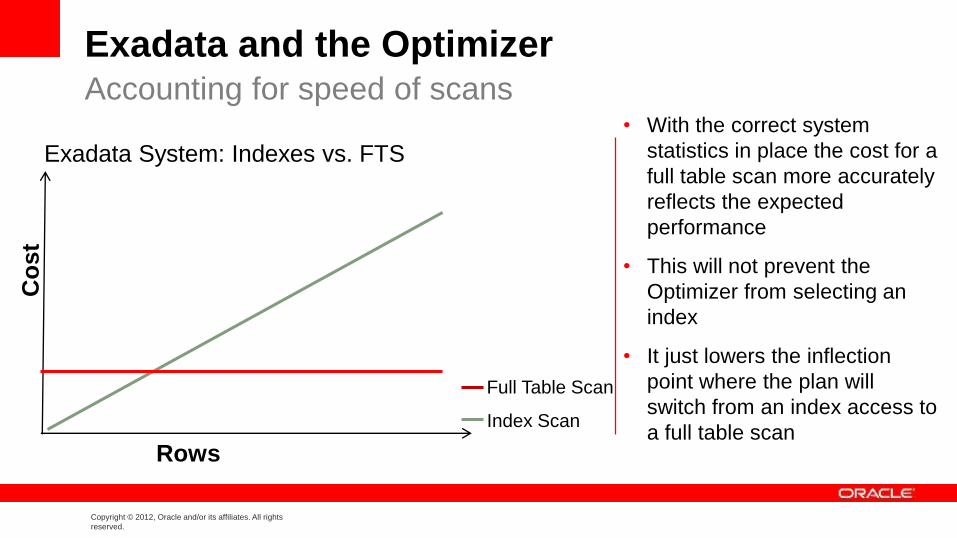
Exadata and the Optimizer
Exadata System: Indexes vs. FTS
Accounting for speed of scans• With the correct system
statistics in place the cost for a
full table scan more accurately
reflects the expected
performance
• This will not prevent the
Optimizer from selecting an
index
• It just lowers the inflection
point where the plan will
switch from an index access to
a full table scanRows
Full Table Scan
Index Scan
Co
st
Copyright © 2012, Oracle and/or its affiliates. All rights
reserved.
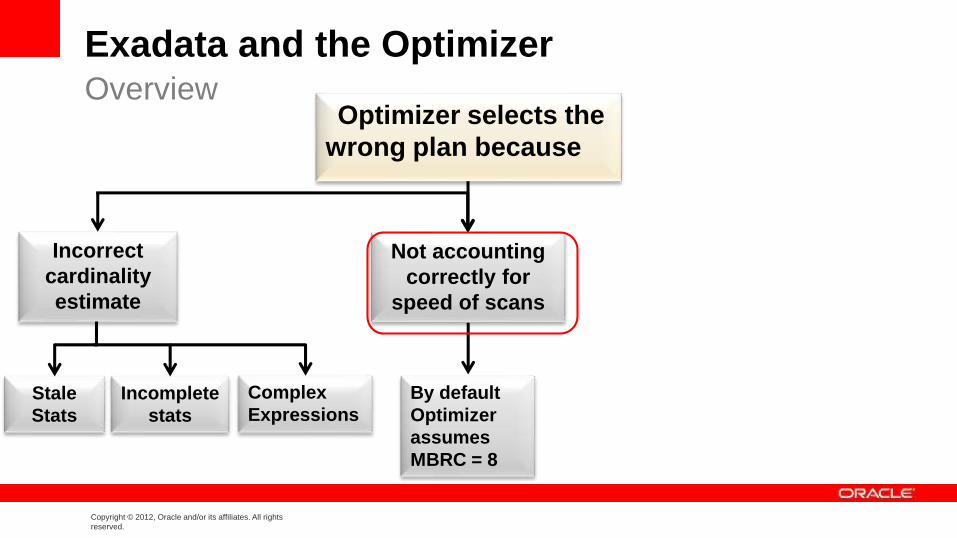
Exadata and the OptimizerOverview
Optimizer selects the
wrong plan because
Incorrect
cardinality
estimate
Not accounting
correctly for
speed of scans
Complex
ExpressionsIncomplete
stats
Stale
Stats
By default
Optimizer
assumes
MBRC = 8
Copyright © 2012, Oracle and/or its affiliates. All rights
reserved.
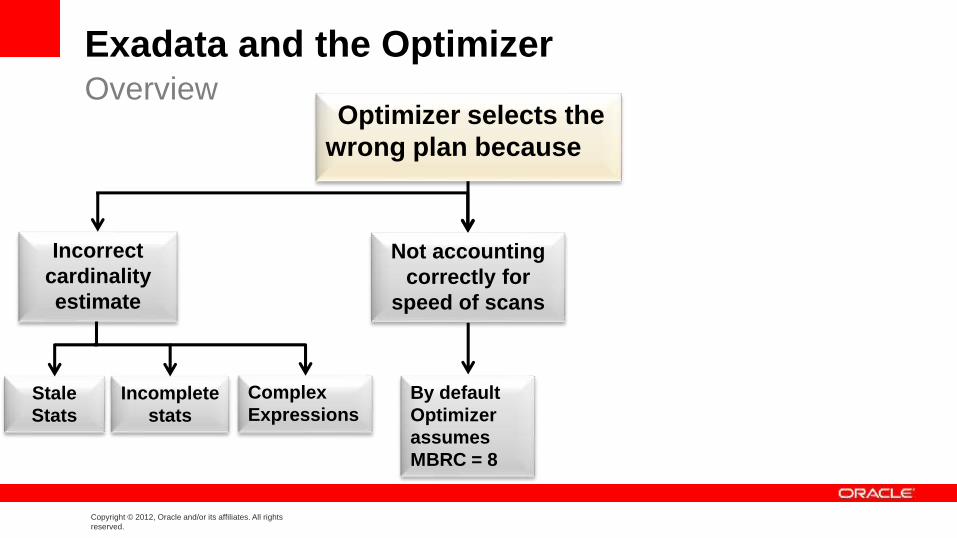
Exadata and the OptimizerOverview
Optimizer selects the
wrong plan because
Incorrect
cardinality
estimate
Not accounting
correctly for
speed of scans
Complex
ExpressionsIncomplete
stats
Stale
Stats
By default
Optimizer
assumes
MBRC = 8
Copyright © 2012, Oracle and/or its affiliates. All rights
reserved.
More Information
• White papers
– Technical overview of the Exadata Database Machine
– What to expect from the Oracle Optimizer in 11g
• Optimizer Blog
– http://blogs.oracle.com/optimizer
• Oracle.com
– http://www.oracle.com/us/products/database/exadata/overview/in
dex.html
– http://www.oracle.com/technetwork/database/focus-areas/bi-
datawarehousing/dbbi-tech-info-optmztn-092214.html

Copyright © 2012, Oracle and/or its affiliates. All rights
reserved.
Q&A

Copyright © 2012, Oracle and/or its affiliates. All rights
reserved.