Embed Size (px)
Citation preview

TOMAS.BP
Business plan
www.tomasdse.com

Page 2
DEFINITION OF THE PROJECT
The solution can be used for various planning
purposes; annual plans, strategic plans,
company plans, plan for group of
Companies , etc.

Page 3
CREATION OF THE PROJECT
You can create
several projects, e.g.
you can create a
strategic plan with
less tables but more
aggregate. You can
also save plans from
year to year creating
a history to look back
on.

Page 4
PROJECT TRANSFERS
When you open new
project, you can
create all tables from
scrap or it can be
copied from
previouse projects.

Page 5
SETTINGS OF BASIC TABLES
You can arrange tables (input or
import from existing applications)
to be used for input or
calculations.

Page 6
PRODUCTS / SERVICES TABLE
You can input product tables
for which you will plan sales
and calculate planned
profitability. Then it can be
organised in hierarchal order,
or arranged by type, rank and
classification.

Page 7
MARKETS TABLE
You can input market
tables for which you will
plan sales and calculate
planned profitability.
It can then be organised
hierarchal order or
arranged by type, rank
and classification

Page 8
BUSINESS UNITS TABLE
Business units can be
inserted for which there is
planned sales and profit. It
can be organised by groups
of companies too. Groups
or division can have their
seperate reports or
statements but it can be
consolidated as well.

Page 9
MARKETING CHANNELS TABLE
Marketing-channel tables
can be inputted for which
planned sales and
profitability has been
calculated. It can be
organised by importance,
type, classification and
hierarchally.

Page 10
ADDITIONAL TABLES
Tables can be edited to reflect
your particular currency, version
and users. The solution has
language options; besides the
many languages that it has
been translated to, your
adminitrator can add any new
language to suit your needs.

Page 11
ADDITIONAL TABLES – VERSION
There are many
options for planning
whether it is
optimistic or
pessimistic. The
process is
simplified with
copying options.

Page 12
INPUT TABLES DEFINITION
A number of tables for planning
can be inputted , also, preexisting
reports can be used or altered
here.

Page 13
INPUT TABLES – ITEMS
You can open all
items that you want
to use in reports and
tables in „Items table‟,
also, determine for
every Item, if it will be
input (Value) or
calculated (formula).

Page 14
ITEMS – FORMULAS
For every item you can
define a formula for its
calculation; planners
can individually create
any kind of report
similar to excel , being
less dependant on the
IT Department or
provider.

Page 15
INPUT TABLES
The solution
enables total
freedom regarding
definition and
number of tables, it
also alerts you to
delayed input.

Page 16
INPUT TABLES – RIGHTS
You can set up who can put
in data and limit the time to
do so, rights can be
determined with even more
details, such as; for which
Markets, Products,
Marketing channels and
Business units.

Page 17
DATA INPUT, REVIEW AND CONFIRMATION
The administrator can monitor the progress
of data input; which tables are finished or
delayed. Inputted data can be approved or
rejected here.

Page 18
DATA INPUT
Input of data is
arranged similar
to that of excel’s
functionality, i.e.,
data can be
copied values
and percentages
can be increased
formulas can be
prepared with all
basic
mathematical
operations.

Page 19
CREDITS INPUT
You can enter all pre-
existing credits along with
all planned credits for the
next year, the solution can
calculate interests rates,
etc.

Page 20
INVESTMENTS AND EXISTING ASSETS INPUT
Here you can input all pre-existing assets
(possible just in main groups too)and
planned investments. The solution will calculate cost of depreciation, net
present value, etc.

Page 21
PLAN CALCULATIONS
You can calculate plans,
allocate data by month and
indirect costs on production
per business unit or products.

Page 22
SIMULATIONS
When all responsible people input their planned data and planners confirm it, you can
perform simulations and “What if” analysis. A change of any parameter of the plan, can
immediately be seen in the success of the whole company, specific BU, market,
product or marketing channel. You can prepare unlimited versions of plans or
simulations in the matter of seconds.
EASY TO USE
Change one or more
parameters, recalculate and
review new Income statement
per business units, products or
markets

Page 23
ALLOCATION OF INDIRECT COSTS
If you want complete
calculation of
profitability, you can
do so by allocating
all unproductive
costs (by % or by
keys) to products or
Business units.

Page 24
ANALYSIS
Depending on input data,
planners can then prepare
various numbers of analysis,
along with defining indicators
and formulas from input
items. The solution also
contain a multidimensional
(OLAP) tool which enables
dimension rotation, drill
down and graphical review
of planned data.
Page 25
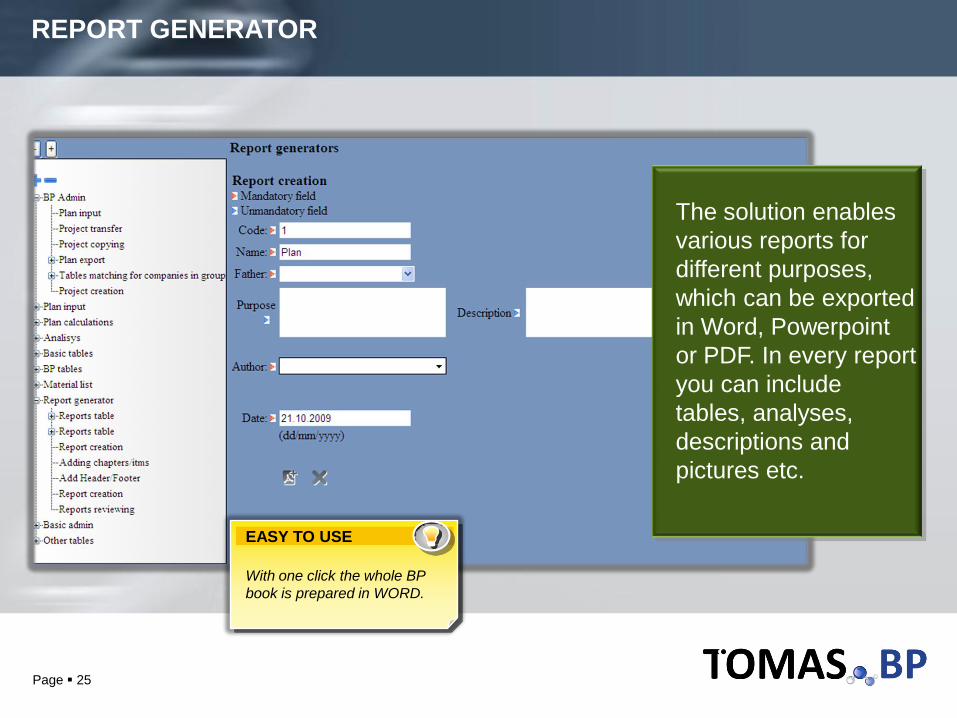
REPORT GENERATOR
The solution enables
various reports for
different purposes,
which can be exported
in Word, Powerpoint
or PDF. In every report
you can include
tables, analyses,
descriptions and
pictures etc.
EASY TO USE
With one click the whole BP
book is prepared in WORD.

Page 26
OPTION-PLANNING TO THE LEVEL OF MATERIAL LISTS
Our solution can facilitate
indepth planning e.g. listing
materials (shown on right), it
will encourage performance
simulation even with the
changes of material‟s prices
or other elements. Changing
any parameter of the plan
can reflect immediately and
affect the succes of the
whole company; market,
product or marketing
channel.

Page 27
MATERIAL LISTS – SPECIFICATION
Here you can specify;
materials, packing,
energy, machines,
workers, half products
or other costs , by
quantities needed.
Data can be inputted
manually or imported
from ERP.
Page 28
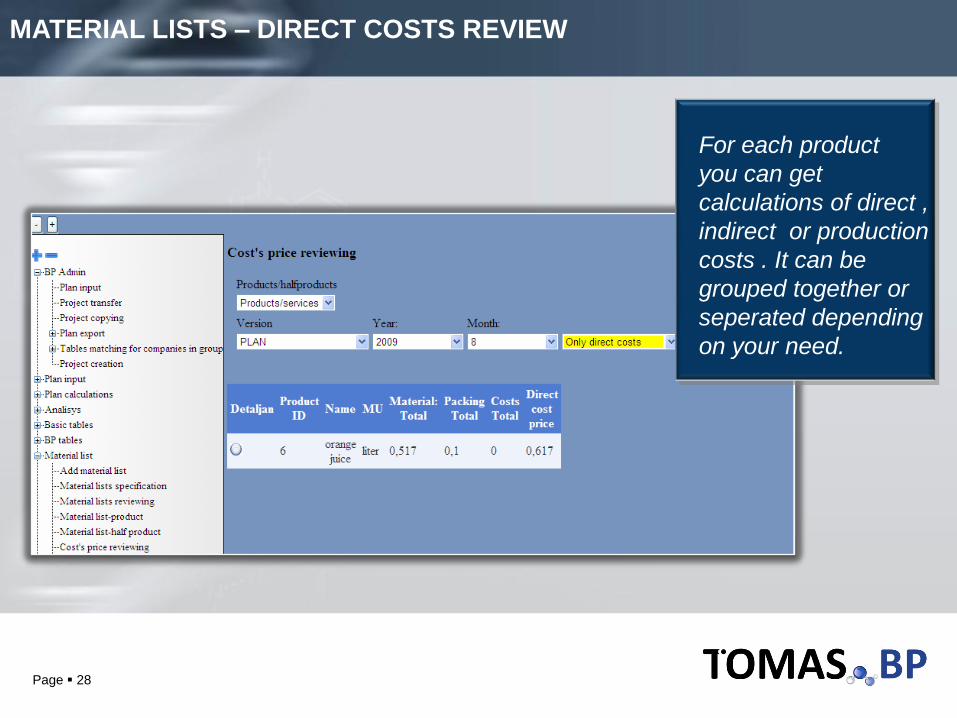
MATERIAL LISTS – DIRECT COSTS REVIEW
For each product
you can get
calculations of direct ,
indirect or production
costs . It can be
grouped together or
seperated depending
on your need.

Page 29
MATERIAL LISTS – SPECIFICATION
You can define which
materials, packing,
energy, machines,
workers, half products,
other costs and in what
quantities are needed for
production of certain
product.
Data can be inputted
manually or imported
from ERP.

Page 30
OPTION-PLANING FOR GROUP OF COMPANIES
•It can help with planning in
group of companies,
especially if every company
has its own database (localy
or on common server), with
help of the solution, all data
can be acummulated into one
common database.
• Through the definition of
rules and formulas
consolidations of plan can be
prepared.
EASY TO USE
Prepare matching tables and
plans of companies are
transferred into one joint plan

Page 31
OLAP Cube Analysis
OLAP analytical tool helps planned data to be analysed; its dimension can be rotated, you can „drill down‟ for more details and prepare charts etc.
.
EASY TO USE
Rotate dimensions, see
agregations, sort data, make
ABC Analysis, prepare your
own Reports and Charts

Page 32
Automated BP report through excel
BP report preparation can be automatized through help of excel add-in.
EASY TO USE
Use existing excel tables,
connect to BP database and
your BP report is prepared

Page 33
BP for group of companies / dislocated units
TOMAS.REPORT
database
Corporate
Headquarter
Comp
USA
Comp.Africa
Comp.Asia
Comp.South
America
Comp.
Australia
TOMAS.BP database
Local companies -
planners
Headquarter„s planners
and managers
EASY TO USE
See all companies BP data
performance in one place
analyse and consolidate them.
• Companies
prepare their own reports through
WEB interface,
data are saved
into Central
Data-warehouse
for Analyses and consolidation

Page 34
TOMAS.BP clients
Controlling
• Define BP versions
• Define periods to prepare tables, mailing
• Define forms to enter (rows, columns)
• Define elements, formulas, controlls
• Define users to plan
• Review received plan „s tables and confirm or reject them
• Calculate and simulate plans
• Using OLAP Analyses and excel-add in
Department managers, Sales persons
• Enter plans through WEB forms
• Cooperate with managers on simulations
Managers
• Monitoring BP data
• Analyzing and simulating plans
• Confirm final version of plan

Page 35
TOMAS.BP Overview
Simulations of
Income
statements for
company, busines
units, products
and markets
Group of
companies
plan
Yearly and
monthly plan
Plan of loans,
Investments,
costs, pruduct
calculation
Sales planPlanners
Managers
Department
managers,
Sales persons
Business units
plan