Embed Size (px)
Citation preview
Layered Layouts for Software Systems Visualizationusing Nested Petri Nets
Alexey Mitsyuk Yaroslav Kotylev
National Research University Higher School of EconomicsFaculty of Computer Science
Laboratory of Process-Aware Information Systems (PAIS Lab)
[email protected], [email protected]
DolgoprudnyMarch 4, 2017
Alexey Mitsyuk, Yaroslav Kotylev (HSE) Layered Layouts for Visualization of NPNs Dolgoprudny March 4, 2017 1 / 26

Overview
1 IntroductionSoftware VisualizationLayered LayoutsSimilar & Related Approaches
2 Visualization of Nested Petri NetsBasic ConceptsOverview of Our ApproachAlgorithmsConcluding Information
3 Visualization of Petri Nets with Data
4 Conclusion
Alexey Mitsyuk, Yaroslav Kotylev (HSE) Layered Layouts for Visualization of NPNs Dolgoprudny March 4, 2017 2 / 26
Introduction Software Visualization
Software Visualization is Useful (Captain Obvious:)
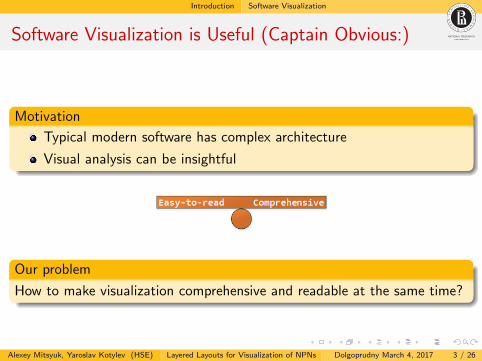
Motivation
Typical modern software has complex architecture
Visual analysis can be insightful
Our problem
How to make visualization comprehensive and readable at the same time?
Alexey Mitsyuk, Yaroslav Kotylev (HSE) Layered Layouts for Visualization of NPNs Dolgoprudny March 4, 2017 3 / 26
Introduction Layered Layouts
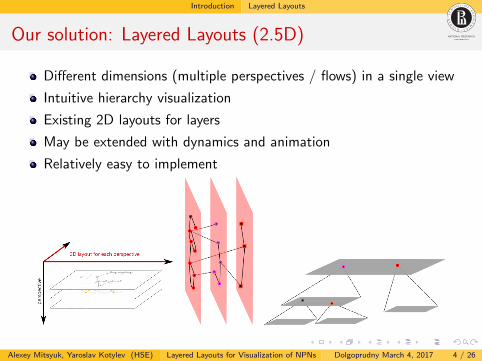
Our solution: Layered Layouts (2.5D)
Different dimensions (multiple perspectives / flows) in a single view
Intuitive hierarchy visualization
Existing 2D layouts for layers
May be extended with dynamics and animation
Relatively easy to implement
Alexey Mitsyuk, Yaroslav Kotylev (HSE) Layered Layouts for Visualization of NPNs Dolgoprudny March 4, 2017 4 / 26

Introduction Similar & Related Approaches
Similar Approaches - 1
(all images are the property of their authors)
Alexey Mitsyuk, Yaroslav Kotylev (HSE) Layered Layouts for Visualization of NPNs Dolgoprudny March 4, 2017 5 / 26

Introduction Similar & Related Approaches
Similar Approaches - 2
(all images are the property of their authors)
Alexey Mitsyuk, Yaroslav Kotylev (HSE) Layered Layouts for Visualization of NPNs Dolgoprudny March 4, 2017 6 / 26
Introduction Similar & Related Approaches
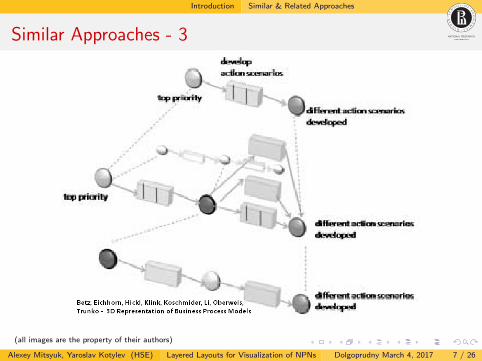
Similar Approaches - 3
(all images are the property of their authors)
Alexey Mitsyuk, Yaroslav Kotylev (HSE) Layered Layouts for Visualization of NPNs Dolgoprudny March 4, 2017 7 / 26

Introduction Similar & Related Approaches
Similar Approaches - 4
(all images are the property of their authors)
Alexey Mitsyuk, Yaroslav Kotylev (HSE) Layered Layouts for Visualization of NPNs Dolgoprudny March 4, 2017 8 / 26

Introduction Similar & Related Approaches
Similar Approaches - 5
(all images are the property of their authors)
Alexey Mitsyuk, Yaroslav Kotylev (HSE) Layered Layouts for Visualization of NPNs Dolgoprudny March 4, 2017 9 / 26
Introduction Similar & Related Approaches
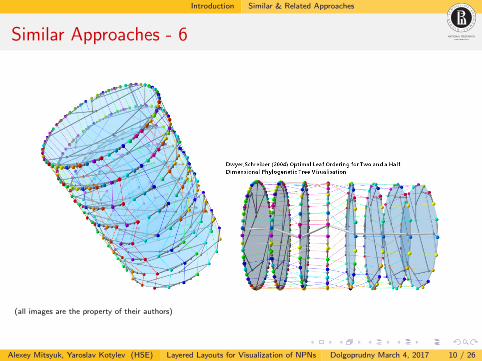
Similar Approaches - 6
(all images are the property of their authors)
Alexey Mitsyuk, Yaroslav Kotylev (HSE) Layered Layouts for Visualization of NPNs Dolgoprudny March 4, 2017 10 / 26
Introduction Similar & Related Approaches
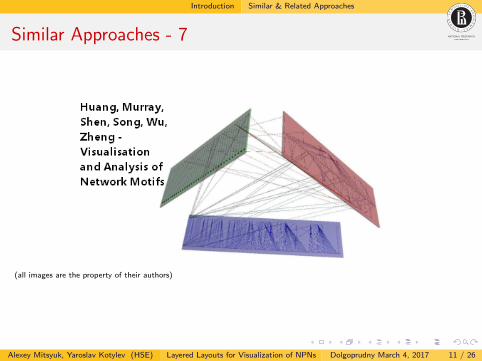
Similar Approaches - 7
(all images are the property of their authors)
Alexey Mitsyuk, Yaroslav Kotylev (HSE) Layered Layouts for Visualization of NPNs Dolgoprudny March 4, 2017 11 / 26

Introduction Similar & Related Approaches
Similar Approaches - 8
(all images are the property of their authors)
Alexey Mitsyuk, Yaroslav Kotylev (HSE) Layered Layouts for Visualization of NPNs Dolgoprudny March 4, 2017 12 / 26

Introduction Similar & Related Approaches
Similar Approaches - Summary
1. Ideas similar to layered layouts (2.5D) are known in graph drawing.
2. 3D methods were already applied in software visualization.
3. Though the idea is not quite new, it reincarnates regularly in differentfields.
4. There are o lot of works on visualization of program structure (classes /packages) and program executions (traces). We visualize flow models.
5. In the remainder we follow this idea and propose the 2.5D layoutsapproach for nested Petri nets visualization.
Alexey Mitsyuk, Yaroslav Kotylev (HSE) Layered Layouts for Visualization of NPNs Dolgoprudny March 4, 2017 13 / 26
Visualization of Nested Petri Nets Basic Concepts
Visualization of Nested Petri Nets (1)
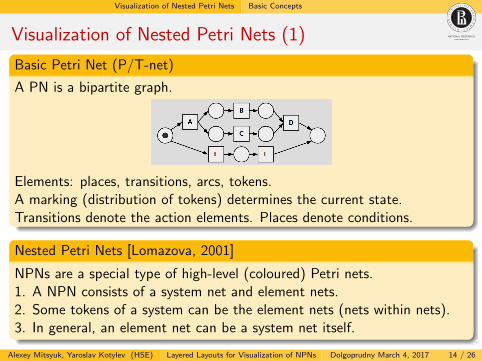
Basic Petri Net (P/T-net)
A PN is a bipartite graph.
Elements: places, transitions, arcs, tokens.A marking (distribution of tokens) determines the current state.Transitions denote the action elements. Places denote conditions.
Nested Petri Nets [Lomazova, 2001]
NPNs are a special type of high-level (coloured) Petri nets.1. A NPN consists of a system net and element nets.2. Some tokens of a system can be the element nets (nets within nets).3. In general, an element net can be a system net itself.
Alexey Mitsyuk, Yaroslav Kotylev (HSE) Layered Layouts for Visualization of NPNs Dolgoprudny March 4, 2017 14 / 26
Visualization of Nested Petri Nets Overview of Our Approach
Visualization of Nested Petri Nets (2)
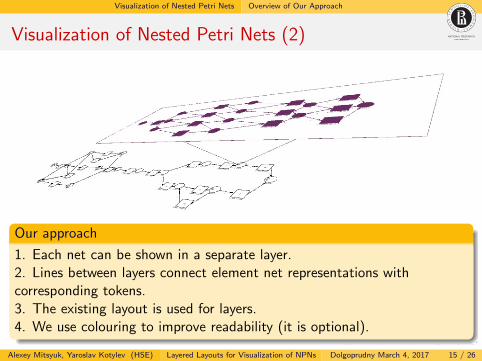
Our approach
1. Each net can be shown in a separate layer.2. Lines between layers connect element net representations withcorresponding tokens.3. The existing layout is used for layers.4. We use colouring to improve readability (it is optional).
Alexey Mitsyuk, Yaroslav Kotylev (HSE) Layered Layouts for Visualization of NPNs Dolgoprudny March 4, 2017 15 / 26

Visualization of Nested Petri Nets Overview of Our Approach
Visualization of Nested Petri Nets (3)
Interactivity
1. Each layer can be shown or hidden.2. Hierarchy can be visualized easily.3. We use zoom in and out functions.4. We use colouring to improve readability (it is optional).5. It is possible to rotate/move the model.
Alexey Mitsyuk, Yaroslav Kotylev (HSE) Layered Layouts for Visualization of NPNs Dolgoprudny March 4, 2017 16 / 26
Visualization of Nested Petri Nets Algorithms
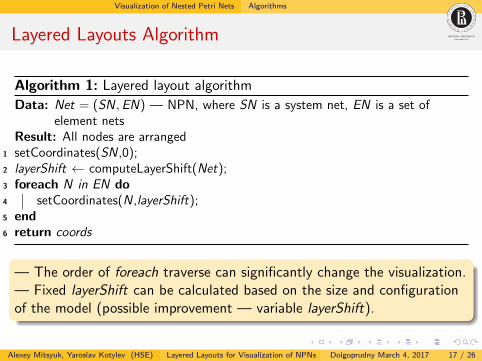
Layered Layouts Algorithm
Algorithm 1: Layered layout algorithm
Data: Net = (SN,EN) — NPN, where SN is a system net, EN is a set ofelement nets
Result: All nodes are arranged1 setCoordinates(SN,0);2 layerShift ← computeLayerShift(Net);3 foreach N in EN do4 setCoordinates(N,layerShift);5 end6 return coords
— The order of foreach traverse can significantly change the visualization.— Fixed layerShift can be calculated based on the size and configurationof the model (possible improvement — variable layerShift).
Alexey Mitsyuk, Yaroslav Kotylev (HSE) Layered Layouts for Visualization of NPNs Dolgoprudny March 4, 2017 17 / 26
Visualization of Nested Petri Nets Algorithms
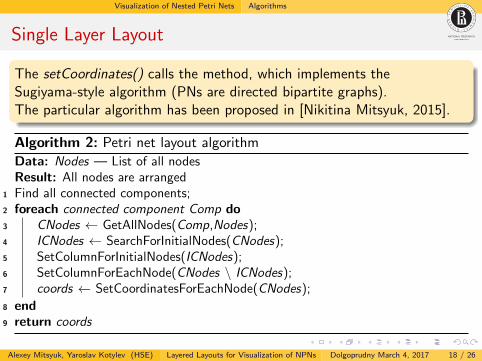
Single Layer Layout
The setCoordinates() calls the method, which implements theSugiyama-style algorithm (PNs are directed bipartite graphs).The particular algorithm has been proposed in [Nikitina Mitsyuk, 2015].
Algorithm 2: Petri net layout algorithm
Data: Nodes — List of all nodesResult: All nodes are arranged
1 Find all connected components;2 foreach connected component Comp do3 CNodes ← GetAllNodes(Comp,Nodes);4 ICNodes ← SearchForInitialNodes(CNodes);5 SetColumnForInitialNodes(ICNodes);6 SetColumnForEachNode(CNodes \ ICNodes);7 coords ← SetCoordinatesForEachNode(CNodes);
8 end9 return coords
Alexey Mitsyuk, Yaroslav Kotylev (HSE) Layered Layouts for Visualization of NPNs Dolgoprudny March 4, 2017 18 / 26
Visualization of Nested Petri Nets Algorithms
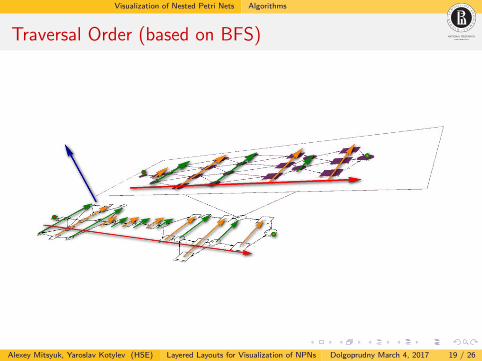
Traversal Order (based on BFS)
Alexey Mitsyuk, Yaroslav Kotylev (HSE) Layered Layouts for Visualization of NPNs Dolgoprudny March 4, 2017 19 / 26
Visualization of Nested Petri Nets Concluding Information
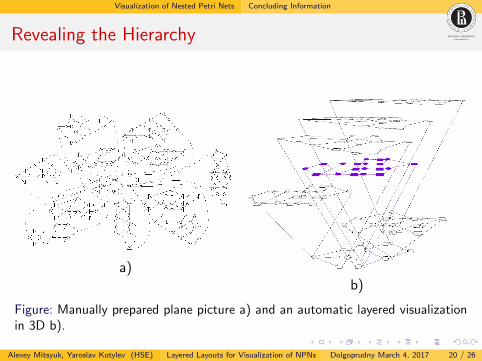
Revealing the Hierarchy
a)b)
Figure: Manually prepared plane picture a) and an automatic layered visualizationin 3D b).
Alexey Mitsyuk, Yaroslav Kotylev (HSE) Layered Layouts for Visualization of NPNs Dolgoprudny March 4, 2017 20 / 26
Visualization of Nested Petri Nets Concluding Information
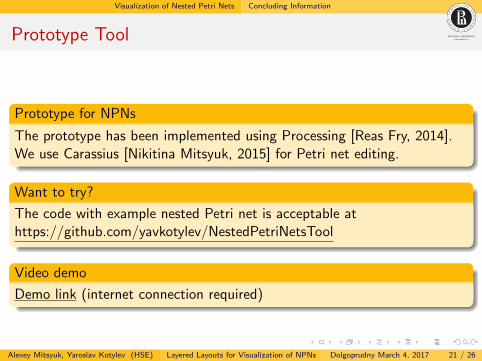
Prototype Tool
Prototype for NPNs
The prototype has been implemented using Processing [Reas Fry, 2014].We use Carassius [Nikitina Mitsyuk, 2015] for Petri net editing.
Want to try?
The code with example nested Petri net is acceptable athttps://github.com/yavkotylev/NestedPetriNetsTool
Video demo
Demo link (internet connection required)
Alexey Mitsyuk, Yaroslav Kotylev (HSE) Layered Layouts for Visualization of NPNs Dolgoprudny March 4, 2017 21 / 26
Visualization of Petri Nets with Data
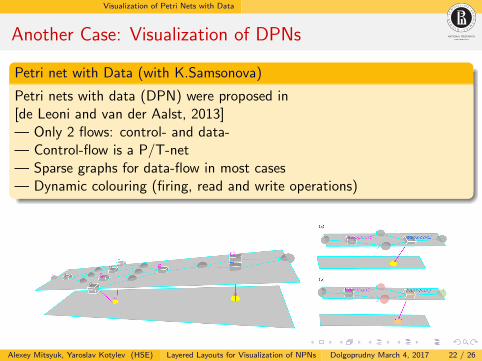
Another Case: Visualization of DPNs
Petri net with Data (with K.Samsonova)
Petri nets with data (DPN) were proposed in[de Leoni and van der Aalst, 2013]— Only 2 flows: control- and data-— Control-flow is a P/T-net— Sparse graphs for data-flow in most cases— Dynamic colouring (firing, read and write operations)
Alexey Mitsyuk, Yaroslav Kotylev (HSE) Layered Layouts for Visualization of NPNs Dolgoprudny March 4, 2017 22 / 26
Conclusion
Future Work (To Do:)
1. To propose the approaches for cases with complex links between layers
2. To introduce a variable shift between layers
3. To evaluate different orders for layer drawing
4. To evaluate the force-based algorithms for 2D layers in 2.5D setting
5. To apply layered layouts for different modelling notations (e.g. UMLSequence diagrams, BPMN 2.0)
6. To construct an algorithm for automated camera angle selection &rotation
7. To add dynamics (model runs)
Alexey Mitsyuk, Yaroslav Kotylev (HSE) Layered Layouts for Visualization of NPNs Dolgoprudny March 4, 2017 23 / 26
Conclusion
Conclusion
In this talk we
1 recalled the usefulness of informal visual analysis;
2 showed the idea for visualization of graph-based software models;
3 discussed related and similar approaches;
4 demonstrated how layered layouts can be applied to NPN models;
5 outlined directions for future work.
Alexey Mitsyuk, Yaroslav Kotylev (HSE) Layered Layouts for Visualization of NPNs Dolgoprudny March 4, 2017 24 / 26
Conclusion
References
The full list of references can be found in the paper.
M. de Leoni and W. M. P. van der Aalst (2013)
Data-Aware Process Mining: Discovering Decisions in Processes Using Alignments
SAC 2013 Proceedings, pages 1454 – 1461. ACM, 2013.
Irina A. Lomazova (2001)
Nested Petri nets: Multi-level and recursive systems
Fundam. Inform., 47(3-4), pages 283 – 293.
N. Nikitina and A. Mitsyuk (2015)
Carassius: A simple process model editor
Proceedings of ISP RAS, 27(3), pages 219 – 236.
Casey Reas and Ben Fry (2014)
Processing: A Programming Handbook for Visual Designers and Artists
The MIT Press, 2014.
Alexey Mitsyuk, Yaroslav Kotylev (HSE) Layered Layouts for Visualization of NPNs Dolgoprudny March 4, 2017 25 / 26

Conclusion
Thank you!https://github.com/yavkotylev/NestedPetriNetsTool
Alexey Mitsyuk, Yaroslav Kotylev (HSE) Layered Layouts for Visualization of NPNs Dolgoprudny March 4, 2017 26 / 26