Embed Size (px)
Citation preview
The U.S. Digital Video Benchmark2012 ReviewAdobe Digital Index
ADOBE DIGITAL INDEX
Digital video is on the riseAs you relax at home, walk through stores, and sit in airports, you see people watching video on more screens than ever before. But don’t rely on the eyeball test. The Adobe Digital Index team looked at 19.6 billion video starts on media websites to confirm the growth of broadcast video consumption across connected devices. But the useful insights don’t stop there. See the latest trends in device use, ad placement, and more.
Table of contents01 Year-over-year increase02 Video on mobile devices03 Days and devices04 The draw of TV content05 Social media and video06 Ad click rates and impressions 07 Complete ad views08 The rise of authenticated streams09 Glossary10 Methodology
The U.S. Digital Video Benchmark - Q1 2013
ADOBE DIGITAL INDEX
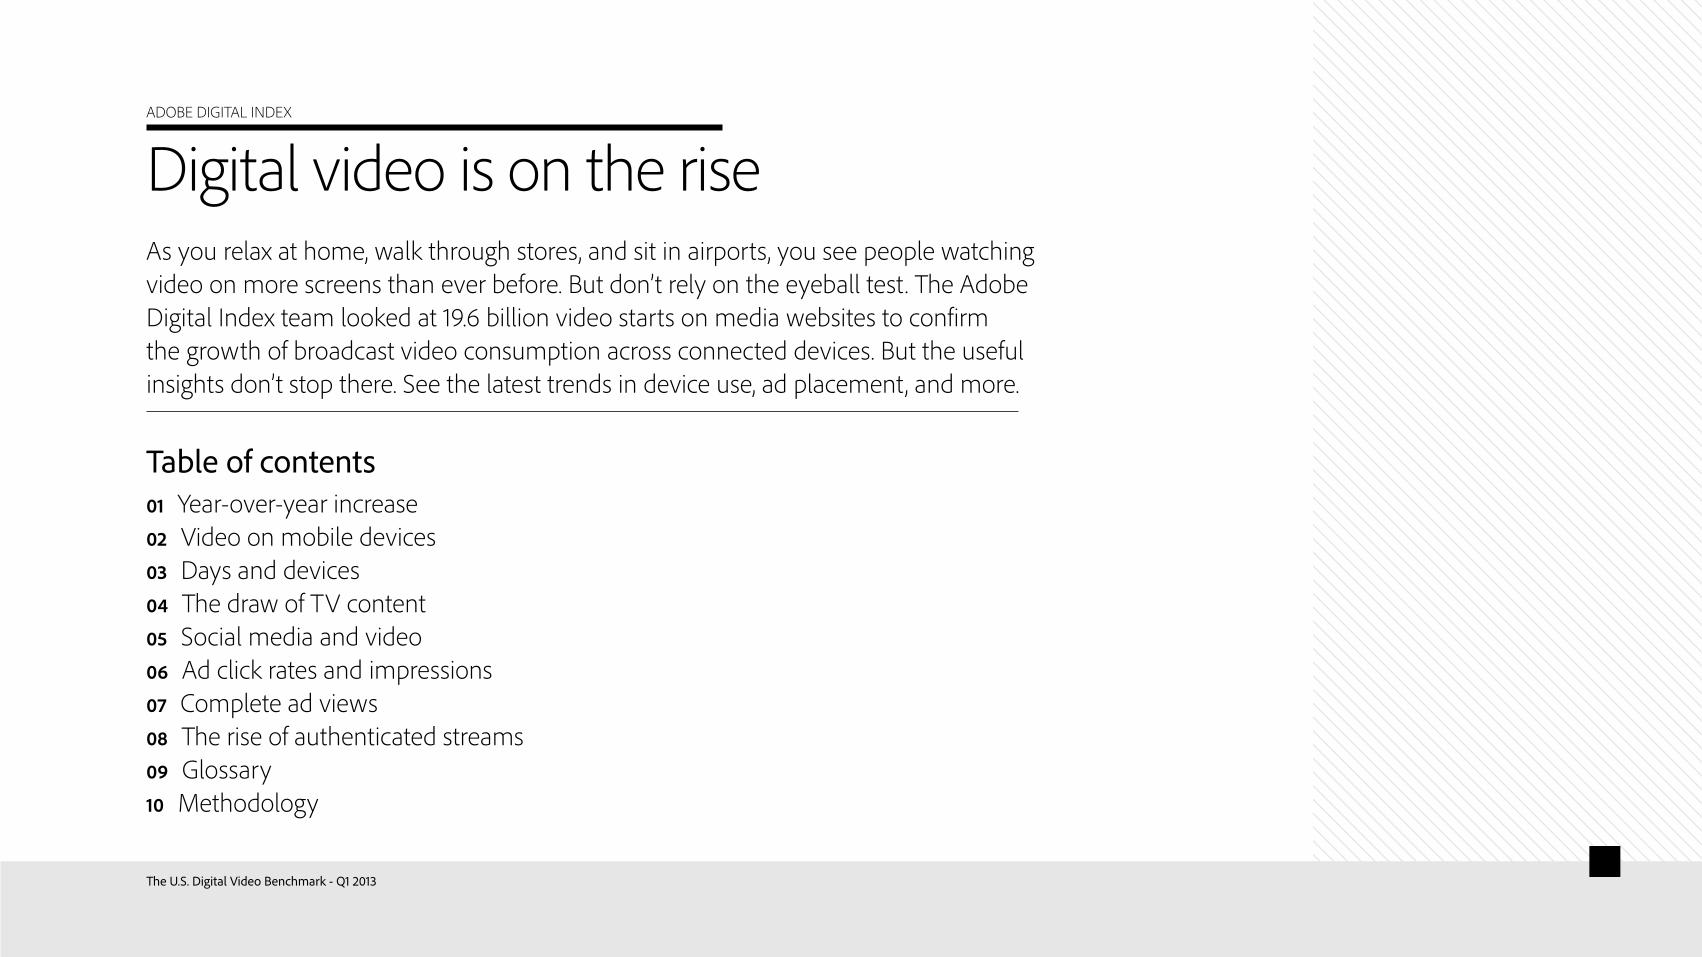
Year-over-year increaseBased on data recorded by the Adobe® Marketing Cloud customers, video consumption has grown dramatically over the past two years. To put that into context, the 15 billion video streams measured in Q4 of 2012 are 11 times more than all of the U.S. movie ticket sales in 2012.1
The findings:• Digital video consumption has grown 30% year over year in Q4 2012.• From Q3 to Q4 2012 alone, video consumption grew 13%.• There has been 50% growth in video streams since Q1 2011.• New TV and sports content drove the highest growth in video
streams in Q4 2012.
The opportunity:Find ways to create personalized digital video experiences for your viewers, visitors, and advertisers. While most videos are consumed on PCs, views on mobile devices have tripled from 2011 to 2012. Look for opportunities to weave more video content into your marketing channels, such as social media.
1 Source: http://www.the-numbers.com/market/2012/summary
The U.S. Digital Video Benchmark - Q1 20131
QUARTERLY VIDEO STREAMS (IN MILLIONS)
ADOBE DIGITAL INDEX
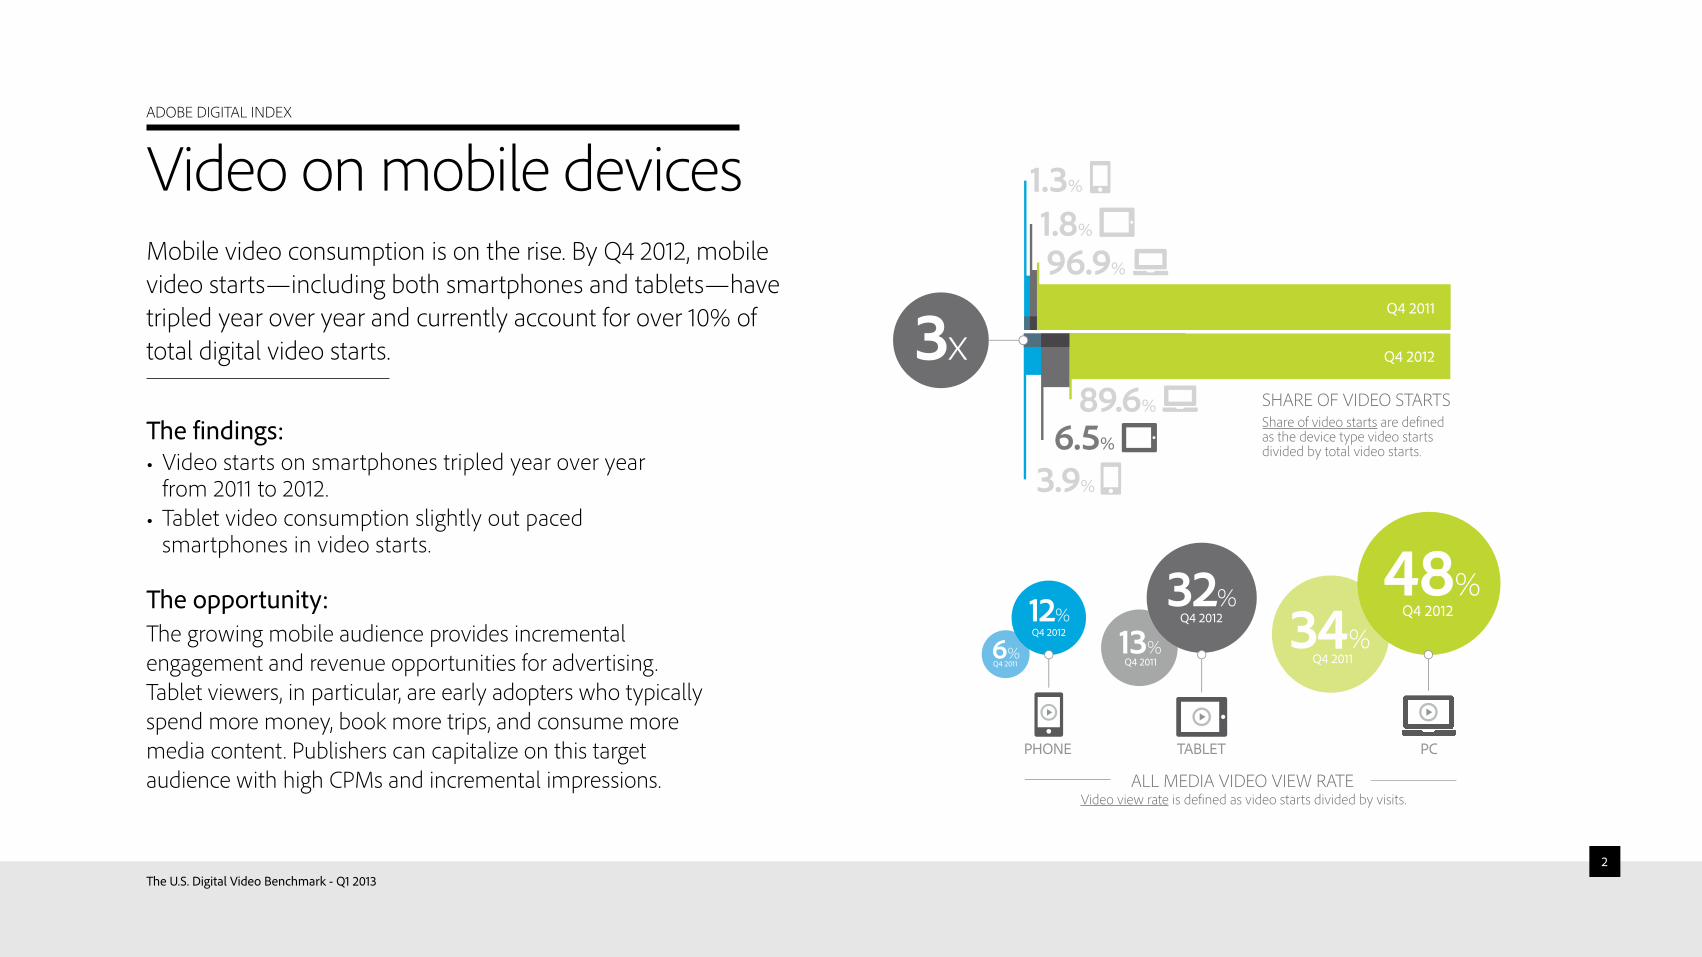
Video on mobile devicesMobile video consumption is on the rise. By Q4 2012, mobile video starts—including both smartphones and tablets—have tripled year over year and currently account for over 10% of total digital video starts.
The findings:• Video starts on smartphones tripled year over year
from 2011 to 2012.• Tablet video consumption slightly out paced
smartphones in video starts.
The opportunity:The growing mobile audience provides incremental engagement and revenue opportunities for advertising. Tablet viewers, in particular, are early adopters who typically spend more money, book more trips, and consume more media content. Publishers can capitalize on this target audience with high CPMs and incremental impressions.
The U.S. Digital Video Benchmark - Q1 20132
ALL MEDIA VIDEO VIEW RATE
ShARE OF VIDEO STARTSShare of video starts are defined as the device type video starts divided by total video starts.
Video view rate is defined as video starts divided by visits.
ADOBE DIGITAL INDEX
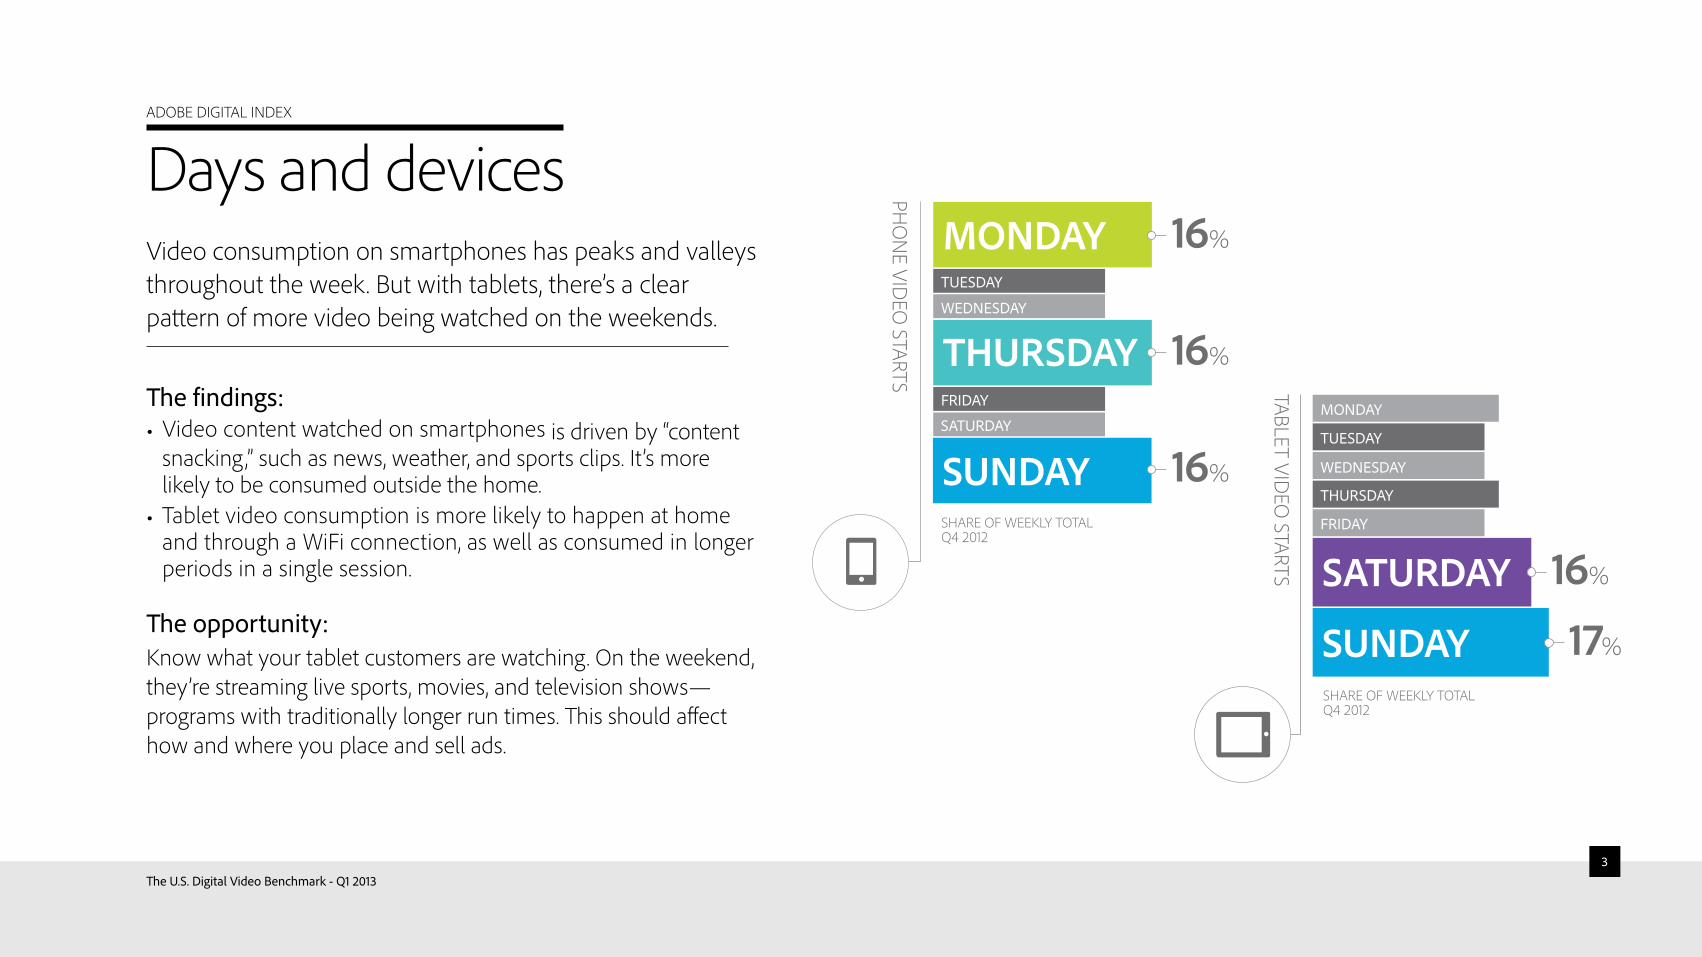
Days and devicesVideo consumption on smartphones has peaks and valleys throughout the week. But with tablets, there’s a clear pattern of more video being watched on the weekends.
The findings:• Video content watched on smartphones is driven by “content
snacking ,” such as news, weather, and sports clips. It’s more likely to be consumed outside the home.
• Tablet video consumption is more likely to happen at homeand through a WiFi connection, as well as consumed in longer periods in a single session.
The opportunity:Know what your tablet customers are watching. On the weekend, they’re streaming live sports, movies, and television shows—programs with traditionally longer run times. This should affecthow and where you place and sell ads.
The U.S. Digital Video Benchmark - Q1 20133
PhO
NE VID
EO STARTS TABLET VID
EO STARTS
ShARE OF WEEKLY TOTALQ4 2012
ShARE OF WEEKLY TOTALQ4 2012
ADOBE DIGITAL INDEX
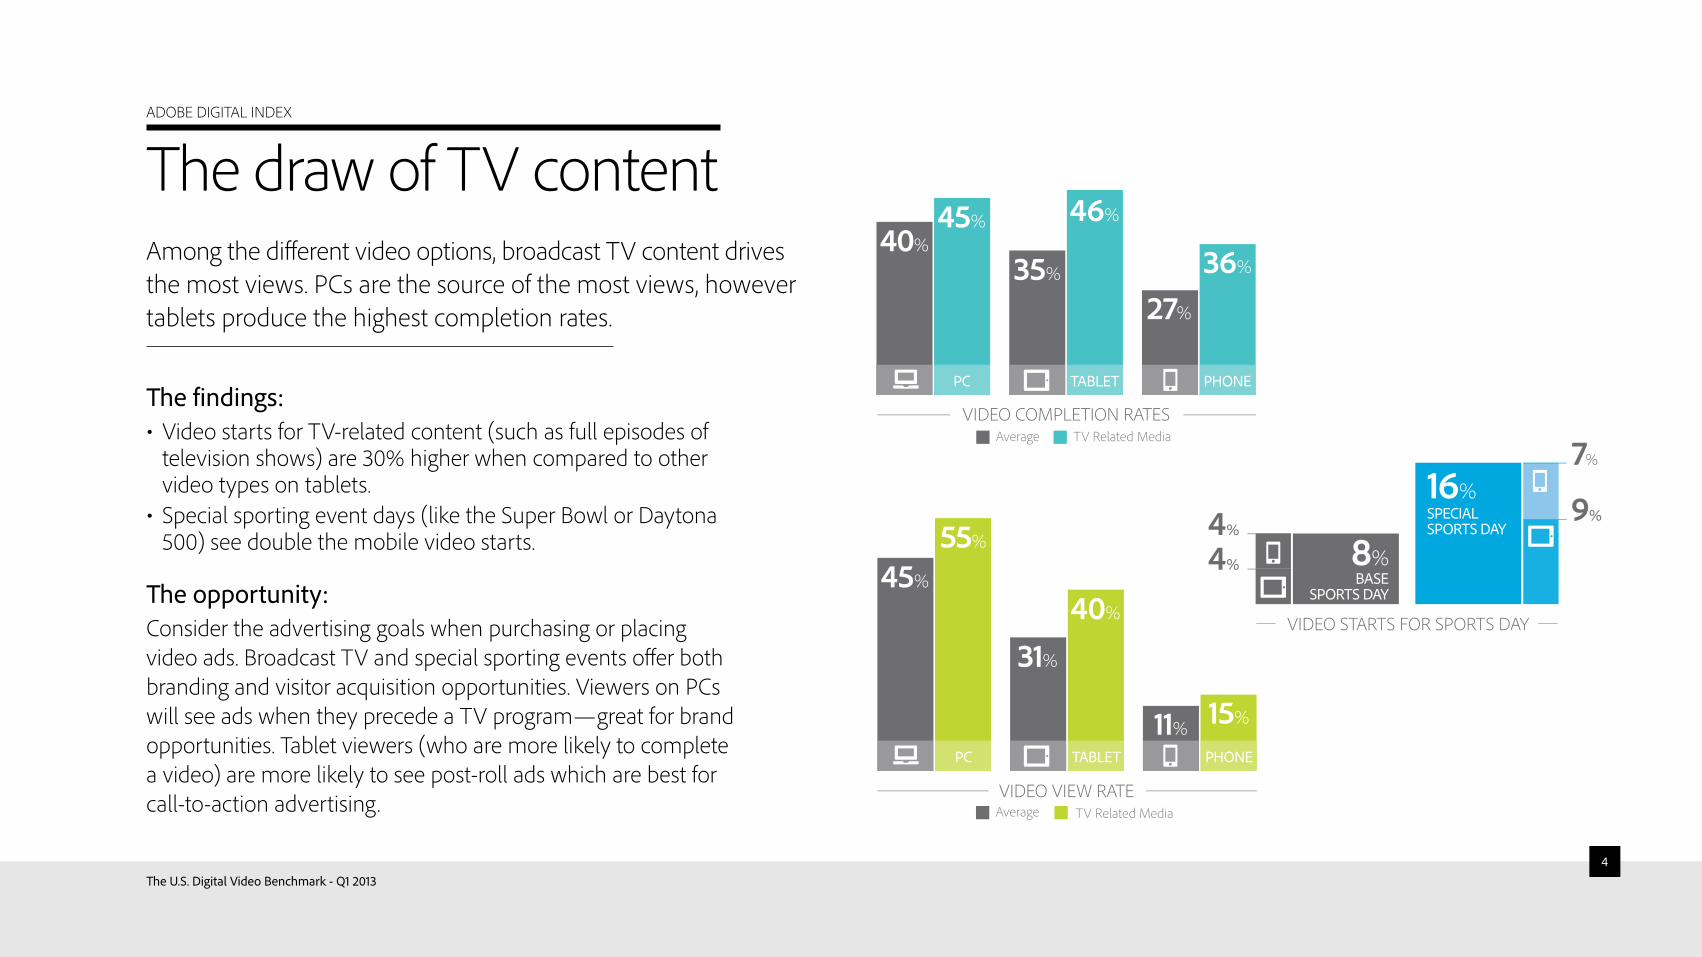
The draw of TV contentAmong the different video options, broadcast TV content drives the most views. PCs are the source of the most views, however tablets produce the highest completion rates.
The findings:• Video starts for TV-related content (such as full episodes of
television shows) are 30% higher when compared to other video types on tablets.
• Special sporting event days (like the Super Bowl or Daytona500) see double the mobile video starts.
The opportunity:Consider the advertising goals when purchasing or placing video ads. Broadcast TV and special sporting events offer both branding and visitor acquisition opportunities. Viewers on PCs will see ads when they precede a TV program—great for brand opportunities. Tablet viewers (who are more likely to complete a video) are more likely to see post-roll ads which are best for call-to-action advertising.
The U.S. Digital Video Benchmark - Q1 20134
VIDEO COMPLETION RATES
VIDEO VIEW RATE
VIDEO STARTS FOR SPORTS DAY
ADOBE DIGITAL INDEX
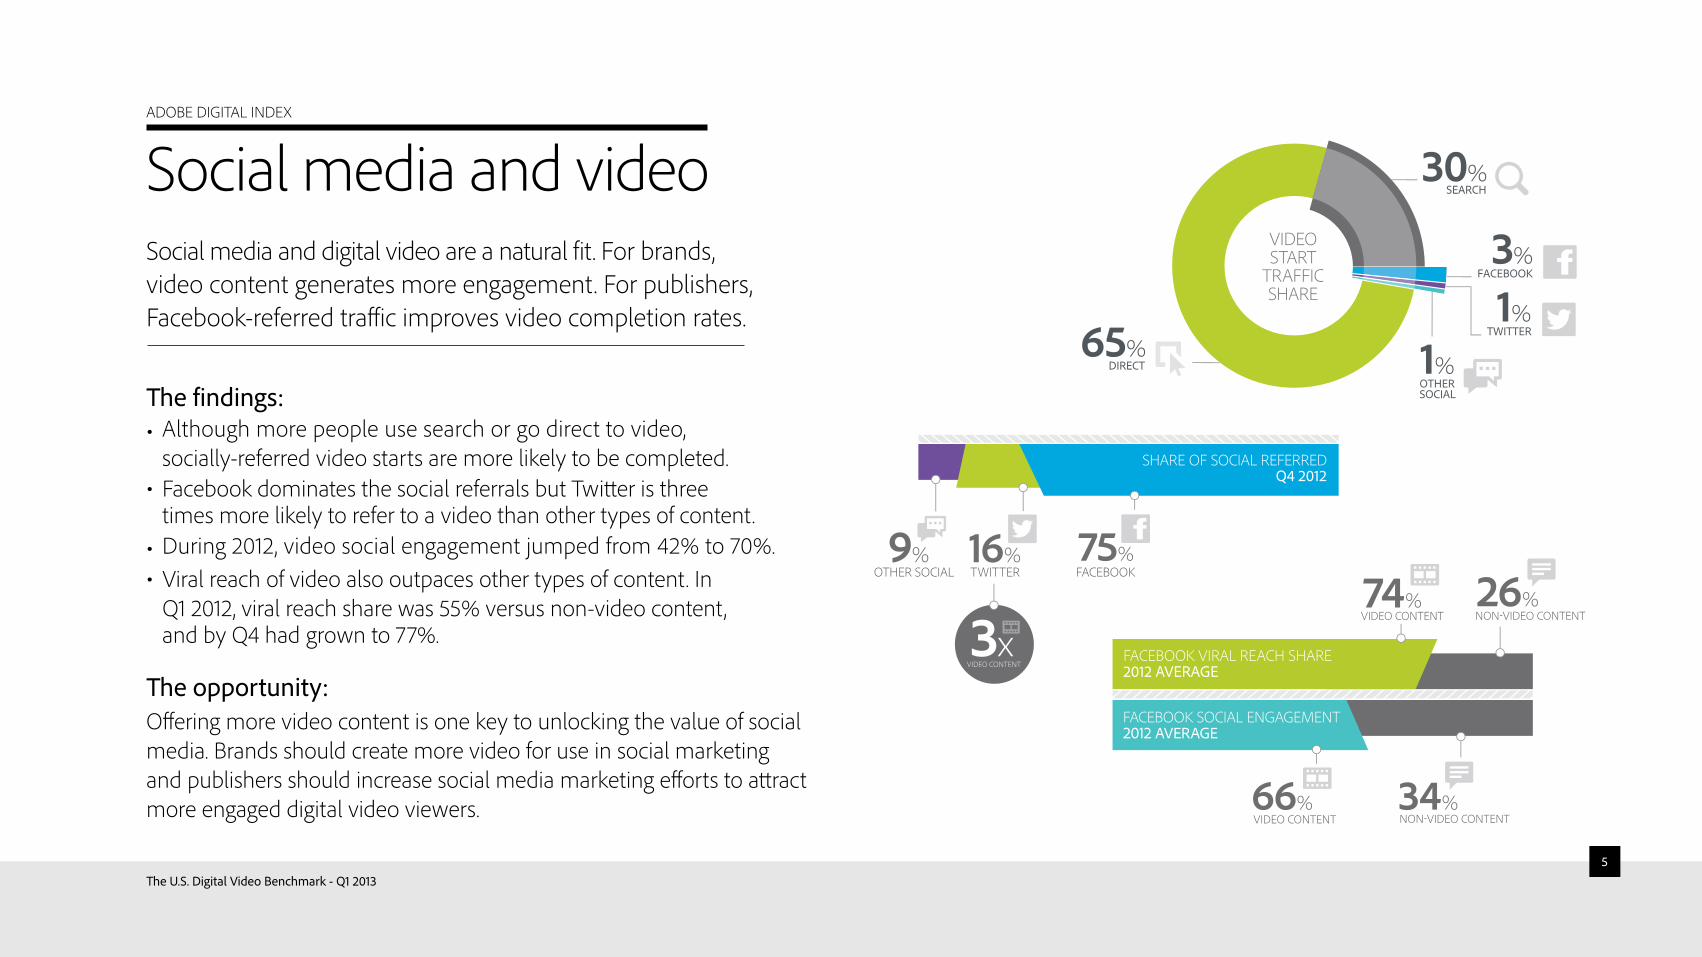
Social media and videoSocial media and digital video are a natural fit. For brands, video content generates more engagement. For publishers, Facebook-referred traffic improves video completion rates.
The findings:• Although more people use search or go direct to video,
socially-referred video starts are more likely to be completed.• Facebook dominates the social referrals but Twitter is three
times more likely to refer to a video than other types of content. • During 2012, video social engagement jumped from 42% to 70%. • Viral reach of video also outpaces other types of content. In
Q1 2012, viral reach share was 55% versus non-video content, and by Q4 had grown to 77%.
The opportunity:Offering more video content is one key to unlocking the value of social media. Brands should create more video for use in social marketing and publishers should increase social media marketing efforts to attract more engaged digital video viewers.
The U.S. Digital Video Benchmark - Q1 20135
ADOBE DIGITAL INDEX
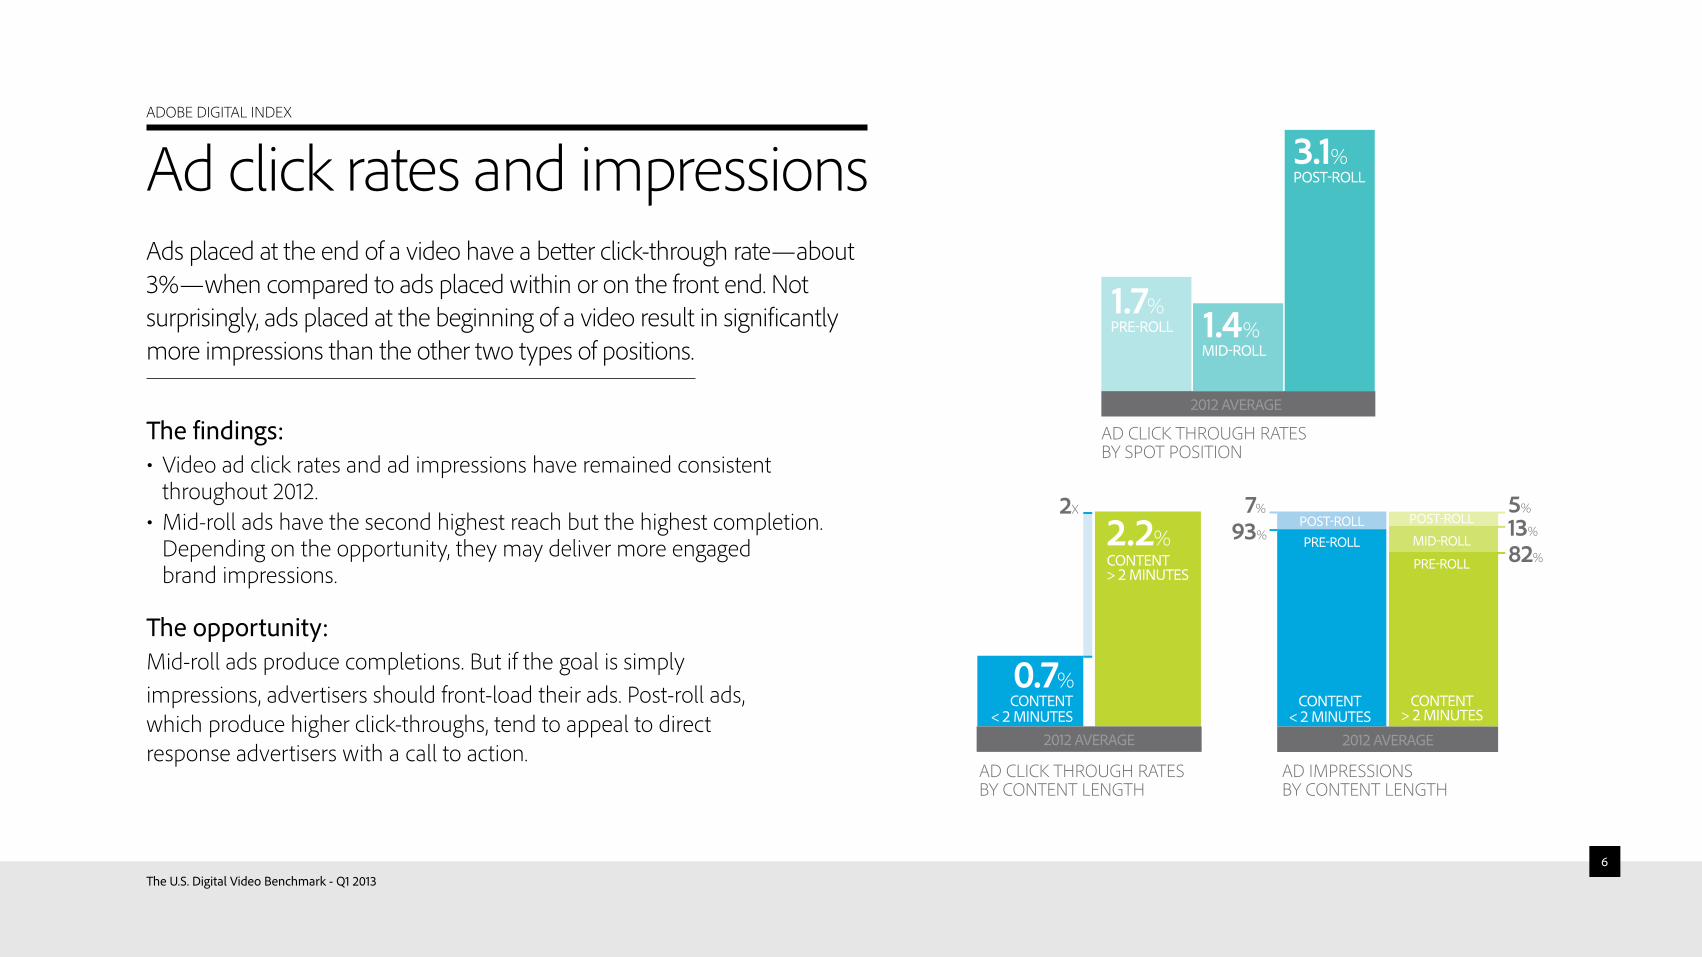
Ad click rates and impressionsAds placed at the end of a video have a better click-through rate—about 3%—when compared to ads placed within or on the front end. Not surprisingly, ads placed at the beginning of a video result in significantly more impressions than the other two types of positions.
The findings:• Video ad click rates and ad impressions have remained consistent
throughout 2012.• Mid-roll ads have the second highest reach but the highest completion.
Depending on the opportunity, they may deliver more engaged brand impressions.
The opportunity:Mid-roll ads produce completions. But if the goal is simply impressions, advertisers should front-load their ads. Post-roll ads, which produce higher click-throughs, tend to appeal to direct response advertisers with a call to action.
The U.S. Digital Video Benchmark - Q1 20136
AD CLICK ThROUGh RATESBY SPOT POSITION
AD CLICK ThROUGh RATESBY CONTENT LENGTh
AD IMPRESSIONSBY CONTENT LENGTh
ADOBE DIGITAL INDEX
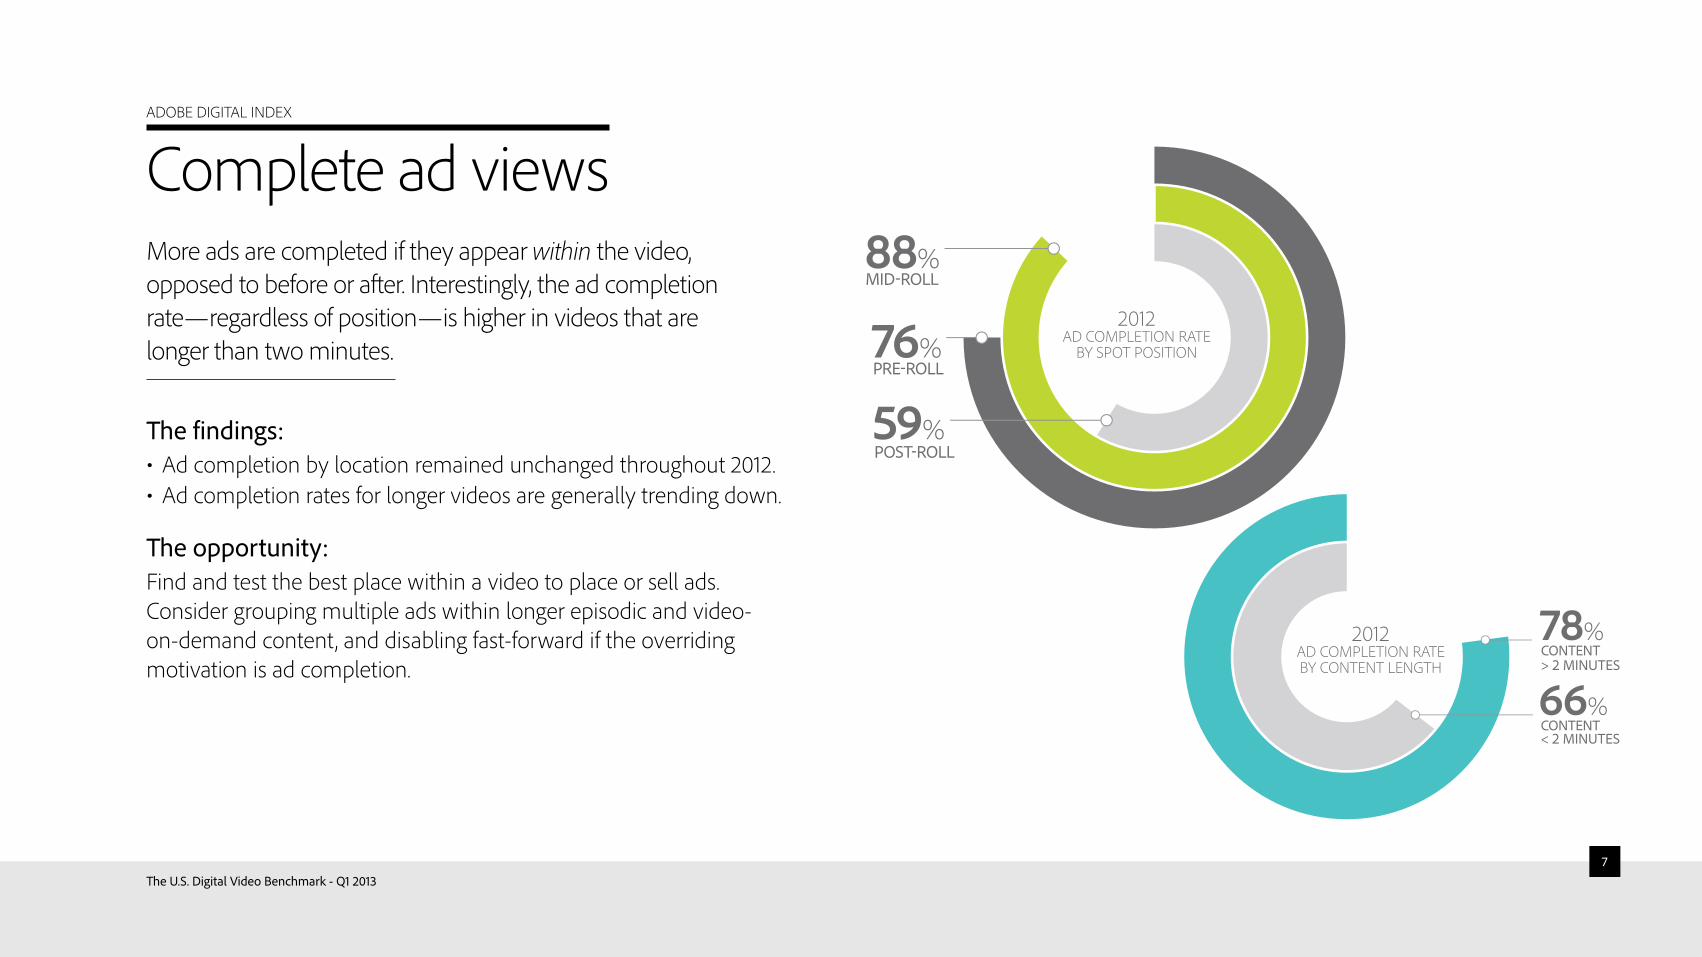
Complete ad viewsMore ads are completed if they appear within the video, opposed to before or after. Interestingly, the ad completion rate—regardless of position—is higher in videos that are longer than two minutes.
The findings:• Ad completion by location remained unchanged throughout 2012.• Ad completion rates for longer videos are generally trending down.
The opportunity:Find and test the best place within a video to place or sell ads. Consider grouping multiple ads within longer episodic and video-on-demand content, and disabling fast-forward if the overriding motivation is ad completion.
The U.S. Digital Video Benchmark - Q1 20137
2012AD COMPLETION RATEBY CONTENT LENGTh
2012AD COMPLETION RATE
BY SPOT POSITION
ADOBE DIGITAL INDEX
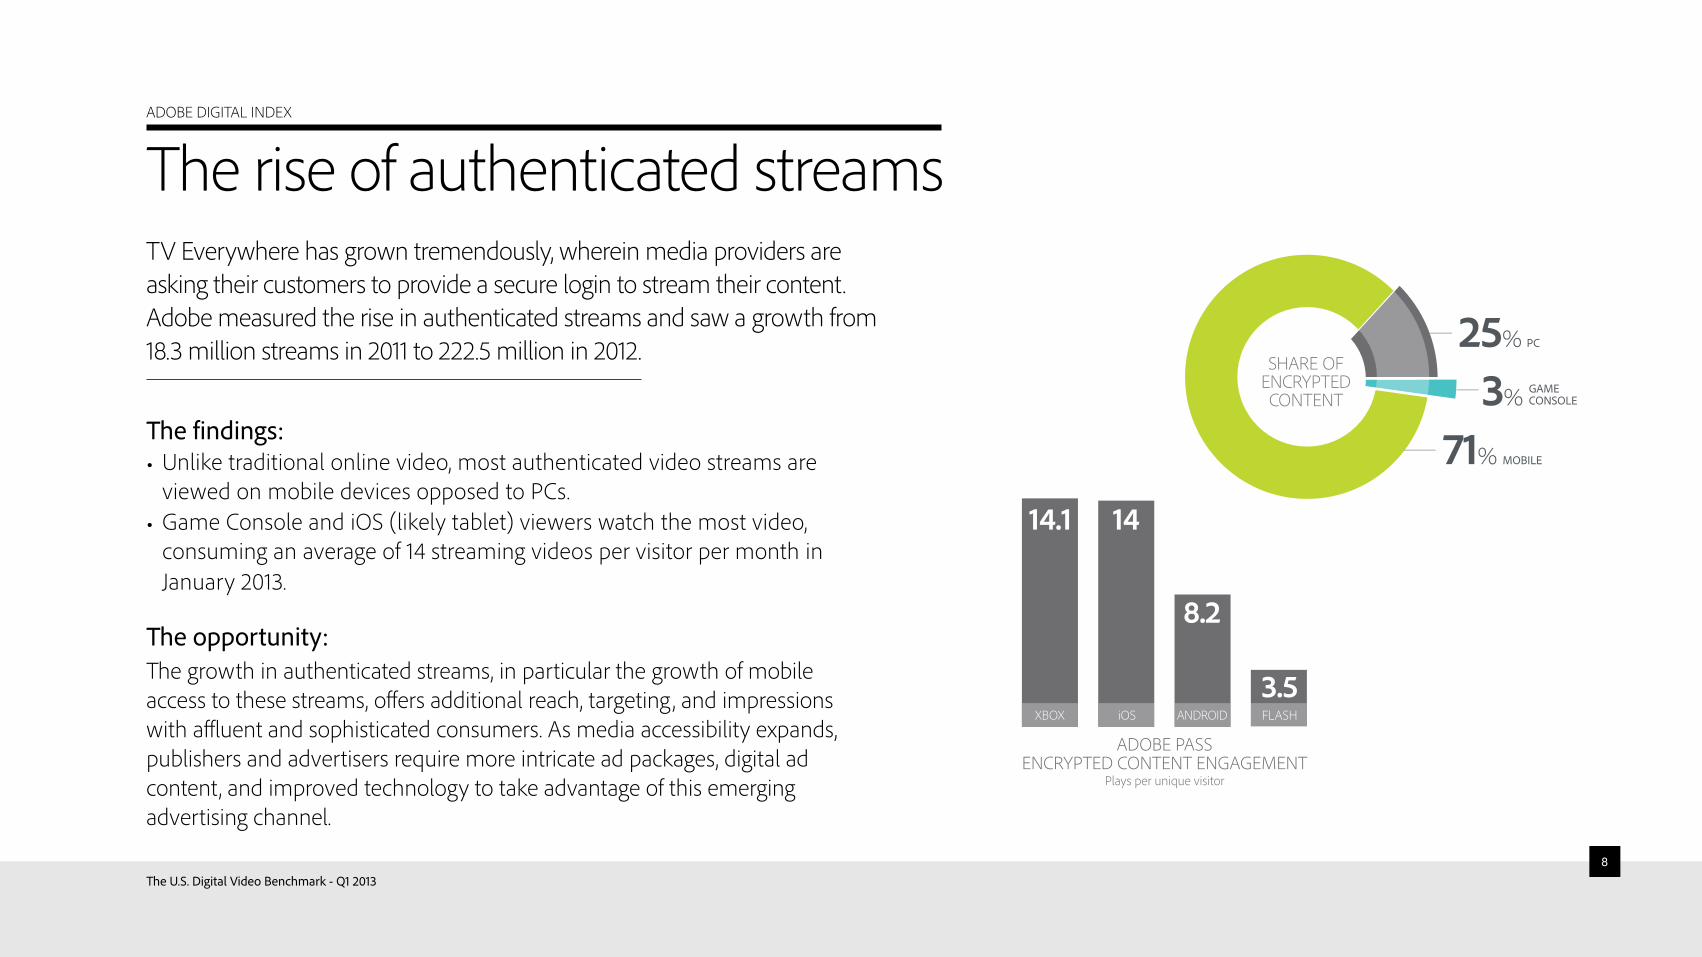
The rise of authenticated streamsTV Everywhere has grown tremendously, wherein media providers are asking their customers to provide a secure login to stream their content. Adobe measured the rise in authenticated streams and saw a growth from 18.3 million streams in 2011 to 222.5 million in 2012.
The findings:• Unlike traditional online video, most authenticated video streams are
viewed on mobile devices opposed to PCs.• Game Console and iOS (likely tablet) viewers watch the most video,
consuming an average of 14 streaming videos per visitor per month in January 2013.
The opportunity:The growth in authenticated streams, in particular the growth of mobile access to these streams, offers additional reach, targeting , and impressions with affluent and sophisticated consumers. As media accessibility expands, publishers and advertisers require more intricate ad packages, digital ad content, and improved technology to take advantage of this emerging advertising channel.
The U.S. Digital Video Benchmark - Q1 20138
ADOBE PASSENCRYPTED CONTENT ENGAGEMENT
Plays per unique visitor
ADOBE DIGITAL INDEX
Glossary• Ad click through rates: The ratio of ad clicks to ad impressions.• Ad completion rate: The ratio of ads completed after being started. • Ad position types: Where an ad in placed within video content.
- Pre-roll: Before the video starts.- Mid-roll: In the middle of the video content.- Post-roll: At the end of the content.
• Social engagement: Total number of Comments + Shares + Likes. (Facebook only)• Video completion rate: The amount of videos that are completed after being started. • Viral media reach: The number of unique people who saw a post from a story published
by a friend. These stories can include liking , commenting , or sharing your post; answering a question; or responding to an event.
• Video starts: When a visitor engages with video content it is captured as a video start. • Video view rate: The percentage of visits resulting in a video start.
The U.S. Digital Video Benchmark - Q1 2013
9
ADOBE DIGITAL INDEX
MethodologyThis data is based on 19.6 billion video starts in 2012 and is comprised of the aggregated and anonymous data from media and entertainment websites. Additional sample information includes:• 10.1 Billion ads served• 457 Million Facebook Posts• 365 Million Facebook Comments, Shares and Likes• This data does not contain any User Generated Video Content (UGC)
Visit our website: adobe.com/go/digital_index
Read our blog:blogs.adobe.com/digitalmarketing/?s=digital+index
Follow us:@AdobeMktgCloud
Ask a question or make a suggestion:[email protected]
The U.S. Digital Video Benchmark - Q1 201310
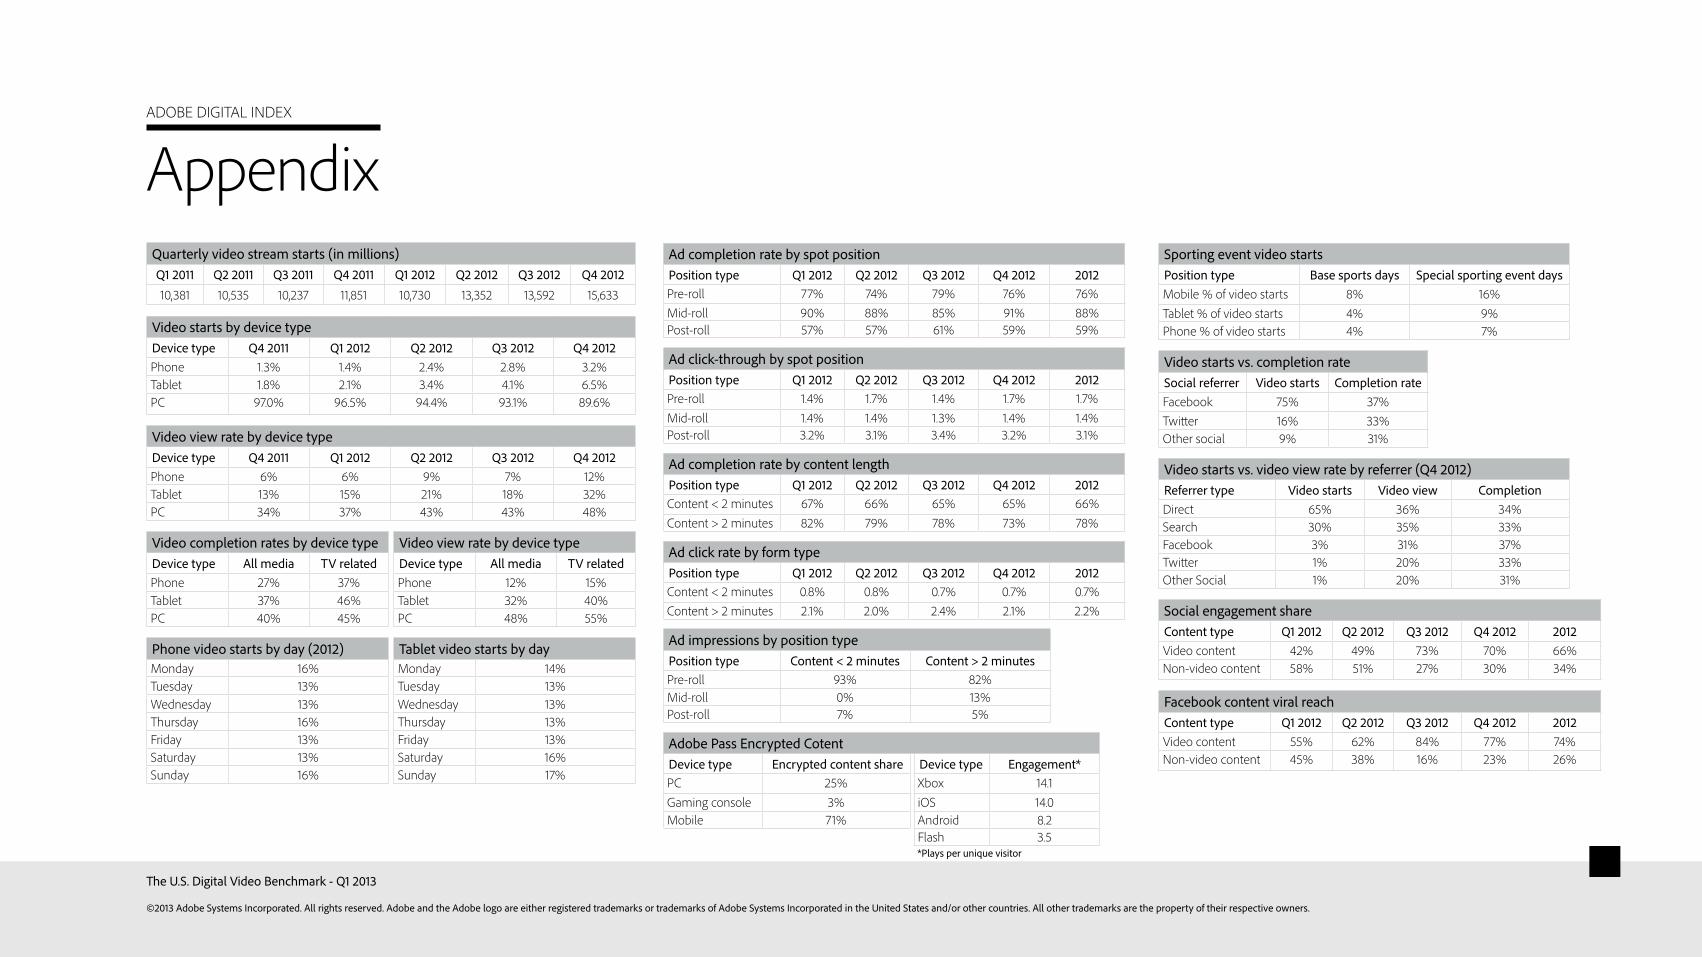
Sporting event video startsPosition type Base sports days Special sporting event daysMobile % of video starts 8% 16%Tablet % of video starts 4% 9%Phone % of video starts 4% 7%
Video starts vs. completion rateSocial referrer Video starts Completion rateFacebook 75% 37%Twitter 16% 33%Other social 9% 31%
Video starts vs. video view rate by referrer (Q4 2012)Referrer type Video starts Video view CompletionDirect 65% 36% 34%Search 30% 35% 33%Facebook 3% 31% 37%Twitter 1% 20% 33%Other Social 1% 20% 31%
Social engagement shareContent type Q1 2012 Q2 2012 Q3 2012 Q4 2012 2012Video content 42% 49% 73% 70% 66%Non-video content 58% 51% 27% 30% 34%
Facebook content viral reachContent type Q1 2012 Q2 2012 Q3 2012 Q4 2012 2012Video content 55% 62% 84% 77% 74%Non-video content 45% 38% 16% 23% 26%
ADOBE DIGITAL INDEX
AppendixQuarterly video stream starts (in millions)Q1 2011 Q2 2011 Q3 2011 Q4 2011 Q1 2012 Q2 2012 Q3 2012 Q4 2012
10,381 10,535 10,237 11,851 10,730 13,352 13,592 15,633
Video starts by device typeDevice type Q4 2011 Q1 2012 Q2 2012 Q3 2012 Q4 2012Phone 1.3% 1.4% 2.4% 2.8% 3.2%Tablet 1.8% 2.1% 3.4% 4.1% 6.5%PC 97.0% 96.5% 94.4% 93.1% 89.6%
Video view rate by device typeDevice type Q4 2011 Q1 2012 Q2 2012 Q3 2012 Q4 2012Phone 6% 6% 9% 7% 12%Tablet 13% 15% 21% 18% 32%PC 34% 37% 43% 43% 48%
Video completion rates by device type Video view rate by device typeDevice type All media TV related Device type All media TV relatedPhone 27% 37% Phone 12% 15%Tablet 37% 46% Tablet 32% 40%PC 40% 45% PC 48% 55%
Phone video starts by day (2012) Tablet video starts by dayMonday 16% Monday 14%Tuesday 13% Tuesday 13%Wednesday 13% Wednesday 13%Thursday 16% Thursday 13%Friday 13% Friday 13%Saturday 13% Saturday 16%Sunday 16% Sunday 17%
The U.S. Digital Video Benchmark - Q1 2013
Ad completion rate by spot positionPosition type Q1 2012 Q2 2012 Q3 2012 Q4 2012 2012Pre-roll 77% 74% 79% 76% 76%Mid-roll 90% 88% 85% 91% 88%Post-roll 57% 57% 61% 59% 59%
Ad click-through by spot positionPosition type Q1 2012 Q2 2012 Q3 2012 Q4 2012 2012Pre-roll 1.4% 1.7% 1.4% 1.7% 1.7%Mid-roll 1.4% 1.4% 1.3% 1.4% 1.4%Post-roll 3.2% 3.1% 3.4% 3.2% 3.1%
Ad completion rate by content lengthPosition type Q1 2012 Q2 2012 Q3 2012 Q4 2012 2012Content < 2 minutes 67% 66% 65% 65% 66%Content > 2 minutes 82% 79% 78% 73% 78%
Ad click rate by form typePosition type Q1 2012 Q2 2012 Q3 2012 Q4 2012 2012Content < 2 minutes 0.8% 0.8% 0.7% 0.7% 0.7%Content > 2 minutes 2.1% 2.0% 2.4% 2.1% 2.2%
Ad impressions by position typePosition type Content < 2 minutes Content > 2 minutesPre-roll 93% 82%Mid-roll 0% 13%Post-roll 7% 5%
Adobe Pass Encrypted CotentDevice type Encrypted content share Device type Engagement*PC 25% Xbox 14.1Gaming console 3% iOS 14.0Mobile 71% Android 8.2
Flash 3.5*Plays per unique visitor
©2013 Adobe Systems Incorporated. All rights reserved. Adobe and the Adobe logo are either registered trademarks or trademarks of Adobe Systems Incorporated in the United States and/or other countries. All other trademarks are the property of their respective owners.