Embed Size (px)
Citation preview

Journal of Natural Sciences Research www.iiste.org
ISSN 2224-3186 (Paper) ISSN 2225-0921 (Online)
Vol.3, No.7, 2013
96
The Multivariate Statistical Analysis of the Environmental
Pollutants at Lake Nyamagoma
Charles B. ATHUMAN
Department of Geography, Stella Maris Mtwara University College
(A Constituent College of St. Augustine University of Tanzania)
P.O. Box 674 Mtwara, Tanzania
E-mail for corresponding author: [email protected]
Abstract
Results from multivariate statistical analysis of the environmental pollutants conducted during the wet season at
8 accessible sampling sites in Lake Nyamagoma are discussed. Standard methods were used to determine the
levels of pollutants from the filtered water samples. Physical parameters including DO, EC, pH turbidity,
temperature and transparency were measured in situ using appropriate gears whilst NO3-, PO4
3-, SiO2, Fe
2+,
HCO3-, SO4
2-, Cl
- and major cations (Ca
2+, Mg
2+, Na
+ and K
+) were determined in the laboratory. Data show that
the variation of the environmental pollutants at the sampled sites is controlled by the factors including increased
primary productivity, redox conditions, dissolution, nitrification, denitrification, mixing and reduction processes
along with the anthropogenic activities. Future work is recommended to focus on the intensive seasonal studies
using statistical approaches on the hydro-bio-chemical parameters to address the climate change impacts for
sustainability of Lake Nyamagoma.
Keywords: Multivariate statistics, environmental pollutants, factors, anthropogenic activities, Lake Nyamagoma.
1. Introduction
Lake Nyamagoma has existed since 1930s and 1940s and it expands over time due to the rainfall regime in the
area. It is inflowed by the rivers Moyowosi, Igombe and Kigosi along with Malagarasi River which drains the
lake during the wet season. The lake falls within the Malagarasi-Moyovosi Wetland located in the northwestern
Tanzania (Nkotagu & Athuman, 2008). The wetland is recognized for its economic, social and environmental
importance. The wetland complex apart from lakes and rivers also includes permanent swamps, seasonally-
inundated floodplains and large areas of miombo woodland (Nkotagu & Athuman, 2004). In the past, wetlands
were significantly devalued by being considered wastelands (Goldstein, 2004). Huge areas of wetlands were
destroyed due to this illusive notion. However, the fact does not hold true to the Malagarasi-Muyovosi wetland
ecosystem. The wetland constitutes important sources of natural resources utilized by the local communities,
fulfill several critical hydrological functions and it is internationally recognized as the area of high biodiversity.
Varieties of flora and fauna such as fish of which 50 species are known with some being endemic, crocodiles,
hippopotamus and other micro-organisms are found at this precious ecosystem.
The major threats to the wetland include the continuing clearance of woodlands to create new agricultural land
(notably for tobacco cultivation) and to provide grazing areas for livestock, the unsustainable - and often illegal -
use of the wildlife, forest, grassland and fisheries resources, the settlement of long-term refugees bordering, and
within, protected areas, the widespread incidence of bush fires and the quasi-absence of any effective controls
and/or integrated natural resource management planning.
Recently, Lake Nyamagoma has undergone large chemical and physical changes consequent to growing human
interference (Athuman, 2012a; Athuman & Nkotagu, 2012; Nkotagu & Athuman, 2004). At the catchment scale
encroachment and deforestation are common especially for the purpose of increasing the size of settlements and
agricultural fields. Deforestation mostly results from fuel-wood gathering and livestock grazing in the miombos.
The use of fire to regenerate grasslands is practiced haphazardly and frequently resulting in a decreasing fertility
of grasslands for livestock grazing. Next to impacts from pollution, domestic and agricultural activities leading
to deterioration of water quality, shallowing of the lake is increasing at a fast rate. The lake is being plagued by
an excessive growth of aquatic macrophytes. In any lake such invasions presage early eutrophication and
alteration of both quality and water body amenities (Hecky & Bugenyi, 1992).
Various authors (e.g. Athuman, 2012; Athuman & Nkotagu, 2012, Nkotagu, 2008; Joseph, 2005; Enger & Smith,
2004; Wetzel, 2001; Jackson & Jackson 2000; Hecky & Bugenyi, 1992) have pointed that, human activities,
mainly agriculture has significantly accelerated the deforestation in the tropical ecosystems. These ecosystems
play a central role in the lives of all organisms. Human beings, in their struggle to meet basic needs and to better
their lives, through agriculture, lumbering wood for fuel, and in finding space for settlement, have depleted more
of the environment than they replenish (Athuman, 2012b; Easton, 2011; Joseph, 2005). Rapid changes in global
patterns of land-use threaten even the biological diversity (Joseph, 2005; Mader, 2003). Easton (2011) adds that
the threats from land-use practices today, stand as driving forces to the deterioration of the water sources as a

Journal of Natural Sciences Research www.iiste.org
ISSN 2224-3186 (Paper) ISSN 2225-0921 (Online)
Vol.3, No.7, 2013
97
result of increased environmental pollutants into the ecosystems. According to Nebel and Wright (1998)
ecosystems are the functional units of sustainable life on Earth due to the fact that no organism can live apart
from its environment. The present study therefore truckled down the multivariate statistical analysis of the
environmental pollutants in Lake Nyamagoma for sustainable functioning of the Malagarasi-Muyovosi Wetland
Ecosystem.
2. Materials and Methods
2.1 Study Area
The study was conducted at Lake Nyamagoma within the Malagarasi - Moyovosi Wetland in Western Tanzania
during the wet season. A total number of 40 water samples were collected from 8 accessible sampling sites (Fig.
1). The lake is shallow (maximum depth ca. 2.5 m) and chocked by macrophytes and swampy areas at the
inflows and outflows (Athuman, 2012).
2.2 Geology and Soils of the Study Area
The study area is located predominantly in the mesoproterozoic sandstones of about 1,200 million years old with
the lithology covering shales, quartzites, dolomitic limestones, migmatite, utramafic rock and the sediments of
the Kavirondian Supergroup (Athuman & Nkotagu, 2012; Nkotagu & Athuman, 2008; Pina et al., 2004). These
rocks are exposed differently at various places within the catchment thus influencing the geomorphology of the
lake accordingly (Fig. 2). A large part of the study area is covered by high pseudopodsolic soils and ferrisols on
sand stones. These infertile soils are easily eroded, and their agricultural potential without fertilizers is generally
low.
2.3 Field work
Sampling was conducted during wet season at 8 accessible sites (See Fig. 1) following Crosby and Patel (1995).
In situ physical parameters including Electrical Conductivity (EC), Dissolved Oxygen (DO), pH and temperature
were measured at each sampling site using a Multi Probe meter 340i model. Turbidity was measured using a
HACH turbidimeter 2100P model. A total of 40 water samples were collected depth wise using a 2-Litre water
sampler, filtered using 0.45µm size filter membrane, kept into half-litre plastic bottles and then transported
immediately to the laboratory for chemical determination.
2.4 Laboratory work
Water samples were stored at 4°C before analysis. Unfiltered water samples were tested for alkalinity using a
titrimetric method with 0.1 N HCl and results expressed as HCO3- (mg l
-1) as explained by APHA et al. (1998).
Nutrients including SiO2, NO3-, PO4
3- and Fe
2+ were determined from the filtered water samples using a HACH
Spectrophotometer DR/2010 model according to HACH (2002). The major cations (Ca2+
, Mg2+
, Na+ and K
+)
were measured from filtered water samples using the Inductively-Coupled Plasma (ICP) machine following Lin
(2007), APHA et al. (1998) and WHO (1993).
2.5 Data analysis and interpretation
The data were analyzed using the Statistical Package for Social Scientists version 11.0 (SPSS 11.0). The
interpretation was performed by both the univariate and the multivariate statistical analyses to yield the
descriptive statistics, correlation, factor and cluster analyses following Lind et al. (2011), Doane and Seward
(2010), Francis (2008), Bluman (2007), Gupta (2006), Kothari (2004), Davis (1986), Drever (1982), Kaiser
(1958), Tryon (1939) and Thurstone (1931).
3. Results and Discussion
3.1 Descriptive Statistics
Descriptive statistics is used as a first stage of statistical processing (Kothari, 2004; Davis, 1986). The main aim
is initial analysis of the distribution of particular chemical parameters by statistics such as mean and standard
deviation. In the present study, the mean results for the descriptive statistics of the pollutants show a significant
variation (Tab. 1). The values for turbidity, NO3-, PO4
3-, Ca
2+, Mg
2+, Na
+ and K
+ are higher. The observed
elevated values of the pollutants are attributed to fertilizer flush down from the farm fields especially at Chagu
and the upstream areas along Moyowosi River. However, the mean pH value (7.87) and its small standard
deviation (0.79) indicate that the water is well buffered as supported by the high mean alkalinity values.
3.2 Correlation Analysis
Correlation analysis is defined as a measure of association between two parameters (Kothari, 2004; Davis, 1986;
Drever, 1982). The two-tailed Pearson correlation method was used to measure such associations, by measuring
the linear relationship denoted as “r” between two parameters. According to Kothari (2004), Davis (1986) and
Drever (1982), the value of “r” varies between +1 and -1 with -1 or +1 indicating perfect linear inverse or
positive relationships respectively, and r = 0 indicating no relationship in the parameters.
The data in the present study significantly show positive and negative correlation between the pollutants as
shown in table 2. This phenomenon may be consequent to hydrochemical and biological differences. Most of the
Journal of Natural Sciences Research www.iiste.org
ISSN 2224-3186 (Paper) ISSN 2225-0921 (Online)
Vol.3, No.7, 2013
98
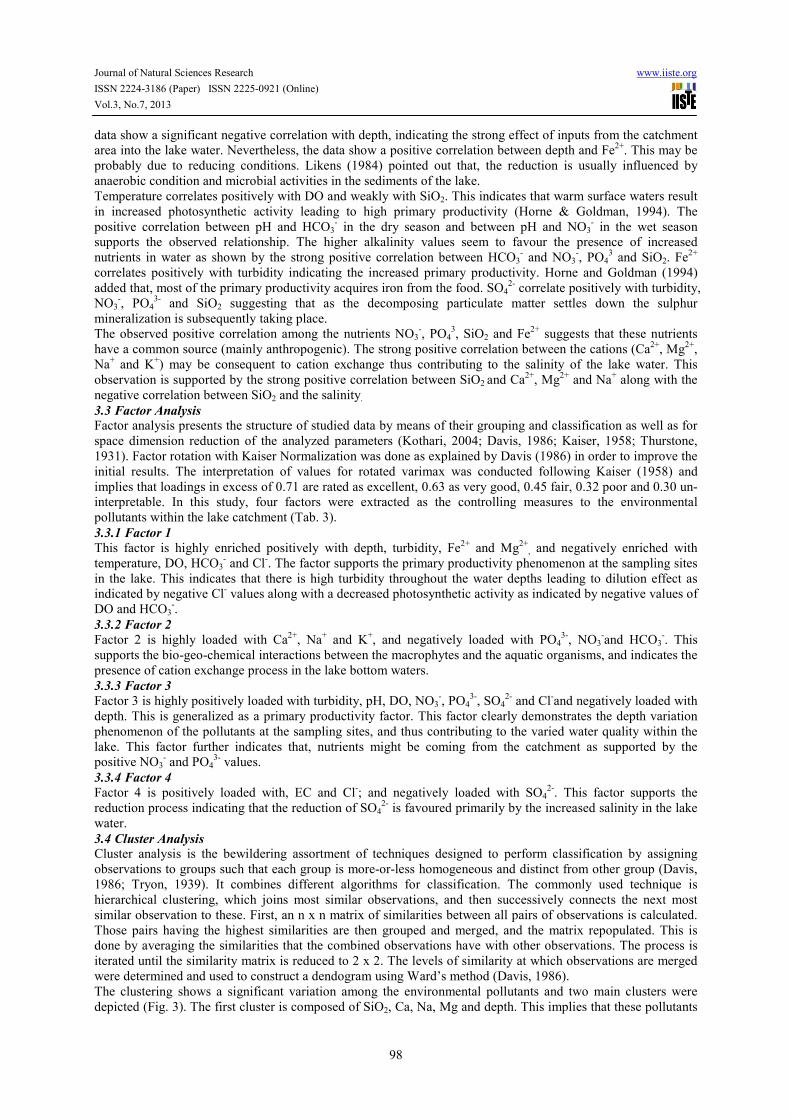
data show a significant negative correlation with depth, indicating the strong effect of inputs from the catchment
area into the lake water. Nevertheless, the data show a positive correlation between depth and Fe2+
. This may be
probably due to reducing conditions. Likens (1984) pointed out that, the reduction is usually influenced by
anaerobic condition and microbial activities in the sediments of the lake.
Temperature correlates positively with DO and weakly with SiO2. This indicates that warm surface waters result
in increased photosynthetic activity leading to high primary productivity (Horne & Goldman, 1994). The
positive correlation between pH and HCO3- in the dry season and between pH and NO3
- in the wet season
supports the observed relationship. The higher alkalinity values seem to favour the presence of increased
nutrients in water as shown by the strong positive correlation between HCO3- and NO3
-, PO4
3 and SiO2. Fe
2+
correlates positively with turbidity indicating the increased primary productivity. Horne and Goldman (1994)
added that, most of the primary productivity acquires iron from the food. SO42-
correlate positively with turbidity,
NO3-, PO4
3- and SiO2 suggesting that as the decomposing particulate matter settles down the sulphur
mineralization is subsequently taking place.
The observed positive correlation among the nutrients NO3-, PO4
3, SiO2 and Fe
2+ suggests that these nutrients
have a common source (mainly anthropogenic). The strong positive correlation between the cations (Ca2+
, Mg2+
,
Na+ and K
+) may be consequent to cation exchange thus contributing to the salinity of the lake water. This
observation is supported by the strong positive correlation between SiO2 and Ca2+
, Mg2+
and Na+ along with the
negative correlation between SiO2 and the salinity.
3.3 Factor Analysis
Factor analysis presents the structure of studied data by means of their grouping and classification as well as for
space dimension reduction of the analyzed parameters (Kothari, 2004; Davis, 1986; Kaiser, 1958; Thurstone,
1931). Factor rotation with Kaiser Normalization was done as explained by Davis (1986) in order to improve the
initial results. The interpretation of values for rotated varimax was conducted following Kaiser (1958) and
implies that loadings in excess of 0.71 are rated as excellent, 0.63 as very good, 0.45 fair, 0.32 poor and 0.30 un-
interpretable. In this study, four factors were extracted as the controlling measures to the environmental
pollutants within the lake catchment (Tab. 3).
3.3.1 Factor 1
This factor is highly enriched positively with depth, turbidity, Fe2+
and Mg2+
, and negatively enriched with
temperature, DO, HCO3- and Cl
-. The factor supports the primary productivity phenomenon at the sampling sites
in the lake. This indicates that there is high turbidity throughout the water depths leading to dilution effect as
indicated by negative Cl- values along with a decreased photosynthetic activity as indicated by negative values of
DO and HCO3-.
3.3.2 Factor 2
Factor 2 is highly loaded with Ca2+
, Na+ and K
+, and negatively loaded with PO4
3-, NO3
-and HCO3
-. This
supports the bio-geo-chemical interactions between the macrophytes and the aquatic organisms, and indicates the
presence of cation exchange process in the lake bottom waters.
3.3.3 Factor 3
Factor 3 is highly positively loaded with turbidity, pH, DO, NO3-, PO4
3-, SO4
2- and Cl
-and negatively loaded with
depth. This is generalized as a primary productivity factor. This factor clearly demonstrates the depth variation
phenomenon of the pollutants at the sampling sites, and thus contributing to the varied water quality within the
lake. This factor further indicates that, nutrients might be coming from the catchment as supported by the
positive NO3- and PO4
3- values.
3.3.4 Factor 4
Factor 4 is positively loaded with, EC and Cl-; and negatively loaded with SO4
2-. This factor supports the
reduction process indicating that the reduction of SO42-
is favoured primarily by the increased salinity in the lake
water.
3.4 Cluster Analysis
Cluster analysis is the bewildering assortment of techniques designed to perform classification by assigning
observations to groups such that each group is more-or-less homogeneous and distinct from other group (Davis,
1986; Tryon, 1939). It combines different algorithms for classification. The commonly used technique is
hierarchical clustering, which joins most similar observations, and then successively connects the next most
similar observation to these. First, an n x n matrix of similarities between all pairs of observations is calculated.
Those pairs having the highest similarities are then grouped and merged, and the matrix repopulated. This is
done by averaging the similarities that the combined observations have with other observations. The process is
iterated until the similarity matrix is reduced to 2 x 2. The levels of similarity at which observations are merged
were determined and used to construct a dendogram using Ward’s method (Davis, 1986).
The clustering shows a significant variation among the environmental pollutants and two main clusters were
depicted (Fig. 3). The first cluster is composed of SiO2, Ca, Na, Mg and depth. This implies that these pollutants

Journal of Natural Sciences Research www.iiste.org
ISSN 2224-3186 (Paper) ISSN 2225-0921 (Online)
Vol.3, No.7, 2013
99
originate from the same source and vary depth-wise as favoured by the geology of the study area. This
observation agrees with the results by Athuman (2012), Athuman and Nkotagu (2012), Nkotagu and Athuman
(2008), Nkotagu (2008) and Nkotagu and Athuman (2007). The second cluster favours salinity to be primarily
due to water temperature, DO, NO3-, PO4
3-, SO4
2-, pH, HCO3
- and Cl
-. This association indicates that the
dissolution of anthropogenic salts under favourable temperatures and pH may be responsible for the salinity of
the water at the sampling sites as depicted at Chagu sampling site.
4. Conclusions and a way forward
Generally, the data from the present study conclude that the variation of the environmental pollutants at Lake
Nyamagoma is controlled by the bio-geo-chemical factors including increased primary productivity, redox
conditions, dissolution, nitrification, denitrification, mixing and reduction processes along with the
anthropogenic activities. For the way forward, it is recommended that future work focuses on the intensive
seasonal studies using statistical approaches on the hydro-bio-chemical parameters so as to address the climate
change impacts for sustainable monitoring of the Lake Nyamagoma productivity.
5. Acknowledgements
This work was funded by the Belgian Technical Cooperation (BTC), The Royal Geographical Society (UK) and
the US National Geographical Society (NGS). The author is grateful to the Kigoma region administration and
Tanzania Fisheries Research Institute (TAFIRI) for their logistical assistance. The administration and staffs at
Stella Maris Mtwara University College (STEMMUCO) are acknowledged for their encouragement and support.
The analysis work was conducted at the Tanzania Fisheries Research Institute (TAFIRI) in Kigoma and Southern
and Eastern Mineral Centre (SEAMIC) in Dar Es Salaam laboratories.
References
APHA, AWWA & WEF (1998), “Standard Methods for Examination of Water and Wastewater”, 20th
ed.,
American Public Health Association Press, Washington DC.
Athuman, C. B. (2012a), “The Surficial Distribution of Water Quality Parameters at Lake Nyamagoma, Western
Tanzania”, International Journal of Applied Science & Technology, 2(2): 18-25.
Athuman, C. B. (2012b), “Environment: The Godly and Worldly Perspectives”, Journal of Africa Tomorrow,
14(1): 109-116.
Athuman, C. B. & Nkotagu, H. H. (2012), “Water Quality Assessment and the Application of the
Hydrochemistry Ion Ratios at Lake Nyamagoma”, Journal of Natural Sciences Research, 2(9):97-106.
Bluman, A. G. (2007), “Elementary Statistics: A Step by Step Approach”, 6th
ed., McGraw-Hill, New York.
Crosby, N. T. & Patel, I. (1995), “General Principles of Good Sampling Practice”, Royal Society of Chemistry
Press, Cambridge.
Davis, J. C. (1986), “Statistics and Data Analysis in Geology”, 2nd
ed., John Willey and Sons Publishers,New
York.
Doane, D. P. & Seward, L. E. (2010), “Essentials Statistics in Business & Economics”, 2nd
ed., McGraw-Hill,
New York.
Drever, J. I. (1982), “The Geochemistry of Natural Waters”, Prentice-Hall Inc. Press, Engelwood Cliff, New
Jersey.
Easton, T. A. (2011), “Taking Sides: Clashing Views on Environmental Issues”, 14th
ed., McGraw-Hill, New
York.
Enger, E. D. & Smith, B. F. (2004), “Environmental Science: A Study of Interrelationships”, 9th
ed., McGraw-
Hill, New York.
Francis, A. (2008), “Business Mathematics & Statistics”, 6th
ed., Cengage Learning EMEA, UK.
Goldstein, J. R. (2004), “Ecology and Environmental Ethics: Green Wood in the Bundle of Sticks”, Ashgate
Publishing Ltd, USA.
Gupta, S. P. (2006), “Statistical Methods”, 34th
edn., Sultan Chand and Sons, New Delhi.
HACH Company (2002), “Water Analysis Handbook”, 4th
ed., Loveland Press, Colorado, USA.
Hecky, R. E. & Bugenyi, F. W. B. (1992), “Hydrology and Chemistry of the African Great Lakes and Water
Quality Issues: Problems and Solutions”, Journal of Mitigation for International Verein & Limnology,
23(2): 201-238.
Horne, A. J. & Goldman, C. R. (1994), “Limnology”, 2nd
ed., McGraw-Hill, USA.
Jackson, A. R. W. & Jackson, J. M. (2000), “Environmental Science: The Natural Science and Human Impact”,
2nd
ed., Prentice Hall, England.
Joseph, B. (2005), “Environmental Studies”, 1st ed., Tata McGraw-Hill, New Delhi, India.
Kaiser, H. F. (1958), “The Varimax Criterion for Analytic Rotation in Factor Analysis”, Journal of Psychometry,

Journal of Natural Sciences Research www.iiste.org
ISSN 2224-3186 (Paper) ISSN 2225-0921 (Online)
Vol.3, No.7, 2013
100
23(2): 234-248.
Kothari, C. R. (2004), “Research Methodology: Methods and Techniques”, New Age International (P) Ltd, India.
Likens, G. E. (1984), “Beyond the Shoreline: A Watershed Ecosystem Approach”, 3rd
ed., Springer-Verlag Press,
New York.
Lind, D. A., Marchal, W.G. & Wathen, S.A. (2011), “Basic Statistics for Business & Economics”, 7th
ed.,
McGraw-Hill, New York.
Lin, S. D. (2007), “Water & Wastewater Calculations Manual”, 2nd
ed., McGraw-Hill, New York.
Mader, S. S. (2003), “Inquiry into Life”, 10th
ed., McGraw-Hill, New York.
Molles, M. C., Jr. (2008), “Ecology: Concepts and Applications”, 4th
ed., McGraw-Hill, New York.
Nebel, B. J. & Wright, R. T. (1998), “Environmental Science”, 6th
ed., Prentice-Hall, USA.
Nkotagu, H. H. & Athuman, C. B. (2008), “The Limnogeology of the Lakes Sagara and Nyamagoma”, Tanzania
Journal Engineering and Technology, 2(1): 12-21.
Nkotagu, H. H. (2008), “The Multivariate Statistical Analysis of Abiotic Parameters of the Lake Tanganyika Sub
Catchment”, Tanzania Journal of Engineering & Technology, 2(2):14-20.
Nkotagu, H. H. & Athuman, C. B. (2007), “The Limnology of the lake Tanganyika Sub catchment”, Tanzania
Journal of Science, 33: 19-26.
Nkotagu, H. H. & Athuman, C. B. (2004), “The Limnogeology of the Malagarasi Wetlands” chapter, In Nkotagu,
H. H. & Ndaro, S. G. M. (eds), The Malagarasi Wetland Ecosystem: An Integrated Study, Dar Es
Salaam University Press, Dar Es Salaam.
Nkotagu, H. H. & Ndaro, S. G. M. (eds), (2004), “The Malagarasi Wetland Ecosystem: An Integrated Study”,
Dar Es Salaam University Press, Dar Es Salaam.
Thurstone, L. (1931), “Multiple Factor Analysis”, Journal of Psychologia Review, 38(1): 21-33.
Tryon, R. (1939), “Cluster Analysis”, Ann Arbor, Ml: Edwards Brothers Press, New York.
Wetzel, R. G. (2001), “Limnology: Lake and River Ecosystems”, 3rd
ed., Academic Press, USA.
WHO (1993), “Guidelines for Drinking Water Quality”, 2nd
ed., Recommended levels: World Health
Organization, Geneva.
Figure 1. Location map of the study area (After Athuman & Nkotagu, 2012)

Journal of Natural Sciences Research www.iiste.org
ISSN 2224-3186 (Paper) ISSN 2225-0921 (Online)
Vol.3, No.7, 2013
101
Figure 2. Geological map of the study area (After Nkotagu & Athuman, 2008)
Table 1. Descriptive statistics of the environmental pollutants
Parameter N Minimum Maximum Mean Standard Deviation
Depth (m) 40 0.00 2.00 1.00 0.73
Temp (oC) 40 23.90 28.80 25.69 1.25
pH 40 6.01 8.46 7.47 0.87
Turb (NTU) 40 4.56 15.26 8.83 3.35
EC (µScm-1
) 40 238.00 663.00 412.75 120.89
DO (mgl-1
) 40 0.09 8.31 4.98 2.68
HCO3- (mgl
-1) 40 101.90 198.90 151.96 27.66
SO42-
(mgl-1
) 40 0.45 1.31 1.01 0.25
Cl- (mgl
-1) 40 12.03 34.98 23.55 6.13
NO3- (mgl
-1) 40 1.08 2.73 1.61 0.42
PO43-
(mgl-1
) 40 8.02 17.03 12.59 2.54
SiO2 (mgl-1
) 40 11.21 29.02 20.18 4.99
Fe2+
(mgl-1
) 40 0.01 0.14 7.60E-02 3.42E-02
Ca2+
(mgl-1
) 40 11.63 34.97 21.16 8.45
Mg2+
(mgl-1
) 40 13.16 18.79 15.28 1.76
Na+
(mgl-1
) 40 19.76 40.39 30.16 6.16
K+ (mgl
-1) 40 1.65 9.66 4.33 2.83

Journal of Natural Sciences Research www.iiste.org
ISSN 2224-3186 (Paper) ISSN 2225-0921 (Online)
Vol.3, No.7, 2013
102
Table 2. Correlation matrix of the environmental pollutants
Depth Temp pH Turb EC DO HCO3- SO4
2- Cl
- NO3
- PO4
3- SiO2 Fe
2+ Ca
2+ Mg
2+ Na
+ K
+
Depth 1
Temp -.63 1
pH -.55 -.04 1
Turb .12 -.66 .46 1
EC .42 -.25 -.26 -.15 1
DO -.81 .66 .48 -.18 -.38 1
HCO3- -.80 .64 .27 -.27 .10 .68 1
SO42-
-.45 -.15 .59 .72 -.67 .28 .05 1
Cl- -.64 .60 .49 -.27 .16 .70 .77 -.11 1
NO3- -.56 -.16 .73 .67 -.12 .39 .47 .73 .33 1
PO43-
-.66 .07 .60 .45 -.13 .48 .61 .66 .36 .87 1
SiO2 .49 -.38 -.04 .13 -.22 -.31 -.69 -.09 -.29 -.31 -.61 1
Fe2+
.64 -.85 -.02 .77 .25 -.60 -.54 .22 -.58 .23 .07 .21 1
Ca2+
.29 .06 -.15 -.34 -.28 -.14 -.48 -.32 -.12 -.58 -.75 .84 -.25 1
Mg2+
.66 -.74 -.03 .72 -.11 -.58 -.76 .29 -.62 .04 -.25 .62 .80 .22 1
Na+ .32 -.02 -.01 -.28 -.04 -.16 -.43 -.44 .08 -.50 -.70 .82 -.18 .92 .20 1
K+ .20 .20 .03 -.36 .52 .04 .09 -.67 .57 -.30 -.40 .25 -.21 .38 -.14 .65 1
Table 3. Rotated component matrix of the environmental pollutants
Parameter
Component
Factor 1 Factor 2 Factor 3 Factor 4
Depth (m) 0.754 0.253 -0.510 0.267
Temp (oC) -0.928 -1.127E-02 -0.107 -4.798E-02
pH -0.111 7.294E-02 0.922 -3.451E-02
Turb (NTU) 0.702 -0.154 0.629 -0.230
EC (µScm-1
) 0.219 -0.291 -0.208 0.889
DO (mgl-1
) -0.755 -5.663E-02 0.476 -0.138
HCO3- (mgl
-1) -0.726 -0.486 0.330 0.209
SO42-
(mgl-1
) 0.152 -0.203 0.648 -0.706
Cl- (mgl
-1) -0.702 8.742E-03 0.498 0.480
NO3- (mgl
-1) 6.089E-02 -0.418 0.869 -0.107
PO43-
(mgl-1
) -0.143 -0.649 0.686 -0.158
SiO2 (mgl-1
) 0.380 0.885 -9.437E-03 -7.441E-02
Fe2+
(mgl-1
) 0.945 -0.170 0.132 4.656E-02
Ca2+
(mgl-1
) -6.039E-02 0.949 -0.243 -6.153E-02
Mg2+
(mgl-1
) 0.878 0.313 0.110 -0.189
Na+ (mgl
-1) -1.374E-02 0.952 -8.945E-02 0.251
K+ (mgl
-1) -0.202 0.470 2.373E-02 0.832
Figure 3. The dendogram results of the environmental pollutants
This academic article was published by The International Institute for Science,
Technology and Education (IISTE). The IISTE is a pioneer in the Open Access
Publishing service based in the U.S. and Europe. The aim of the institute is
Accelerating Global Knowledge Sharing.
More information about the publisher can be found in the IISTE’s homepage:
http://www.iiste.org
CALL FOR PAPERS
The IISTE is currently hosting more than 30 peer-reviewed academic journals and
collaborating with academic institutions around the world. There’s no deadline for
submission. Prospective authors of IISTE journals can find the submission
instruction on the following page: http://www.iiste.org/Journals/
The IISTE editorial team promises to the review and publish all the qualified
submissions in a fast manner. All the journals articles are available online to the
readers all over the world without financial, legal, or technical barriers other than
those inseparable from gaining access to the internet itself. Printed version of the
journals is also available upon request of readers and authors.
IISTE Knowledge Sharing Partners
EBSCO, Index Copernicus, Ulrich's Periodicals Directory, JournalTOCS, PKP Open
Archives Harvester, Bielefeld Academic Search Engine, Elektronische
Zeitschriftenbibliothek EZB, Open J-Gate, OCLC WorldCat, Universe Digtial
Library , NewJour, Google Scholar