Embed Size (px)
Citation preview

“The Economics of
Telecoms” 2015 Report
Full version
November 2015 Arthur D. Little
7, place d’Iéna
75116 Paris
France
T: + 33 1 55 74 29 00
www.adlittle.com

2
Key messages
Proposals from the Fédération Française des Télécoms to strengthen
telecom operators and digital in France and Europe 5
European and French digital demand is highly developed enabled by high
quality networks 2
Telecom operators are the basis of the current and future digital supply 3
5 key levers to develop a strong digital offer in France and in Europe 4
Unlike other regions, Europe suffers from a significant digital imbalance 1
3
Key messages
Proposals from the Fédération Française des Télécoms to strengthen telecom
operators and digital in France and Europe 5
European and French digital demand is highly developed enabled by high quality
networks 2
Telecom operators are the basis of the current and future digital supply 3
5 key levers to develop a strong digital offer in France and in Europe 4
Unlike other regions, Europe suffers from a significant digital imbalance 1

4
The spreading of the digital to the entire economy will deeply transform the
impacted sectors
Source: Arthur D. Little analysis
Education
Digital as a
complement to
on-site lessons
Insurance
Management
and forecast of
risks by
software
Travel
/ transport
Digital
distribution
and sharing
economy
Retail
Online
shopping
transforming
retail
Manu-
facturing
Optimization of
the supply chain
Healthcare
Digitalization of
the
administration,
beginning of
robotic
surgery
Utilities
Management of
client portfolio
and of
information
flow
Digital wave
Today
Next ?
Substitution of
on-site lessons
by MOOCs
Use of the
Internet of
Things to better
prevent risks
and to foster
loyalty
Digitalization
of the customer
experience
and dis-
intermediation
Digital in
physical stores
through
connected
stores
« Industrial
revolution »
started by 3D
printing
Big Data to
predict, robotic
to cure;
telemedicine to
follow
Decentraliza-
tion of
production –
consumers able
to produce,
monitor and store
Examples
5
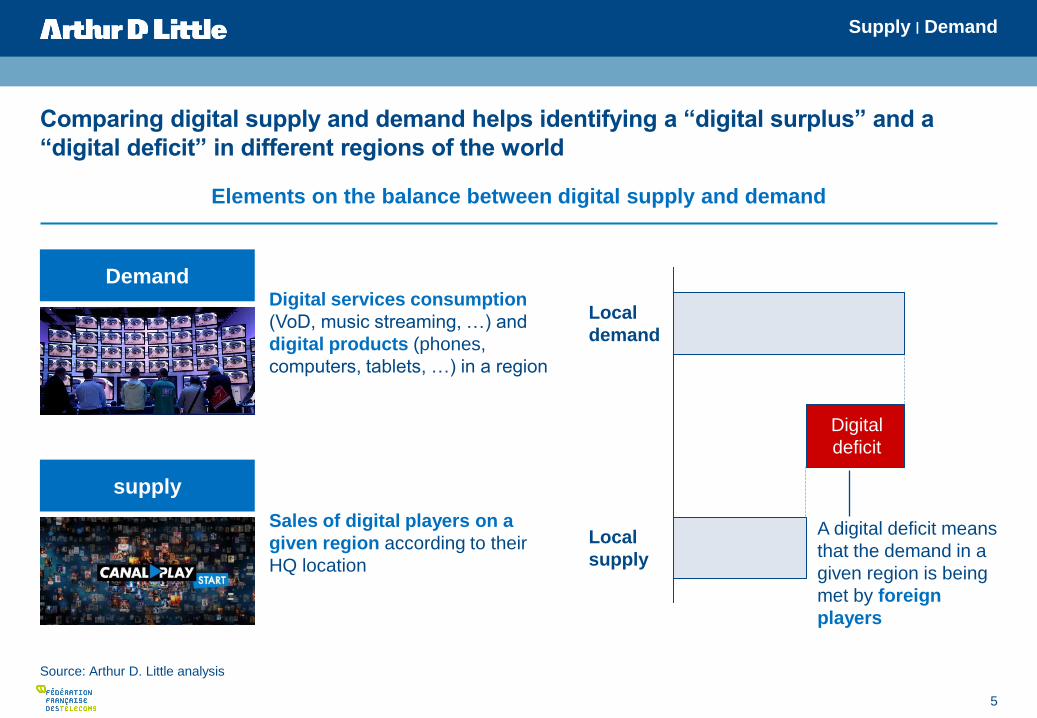
Comparing digital supply and demand helps identifying a “digital surplus” and a
“digital deficit” in different regions of the world
Source: Arthur D. Little analysis
Digital services consumption
(VoD, music streaming, …) and
digital products (phones,
computers, tablets, …) in a region
Sales of digital players on a
given region according to their
HQ location
Local
demand
Local
supply
Digital
deficit
Elements on the balance between digital supply and demand
A digital deficit means
that the demand in a
given region is being
met by foreign
players
Demand
supply
Supply | Demand
6
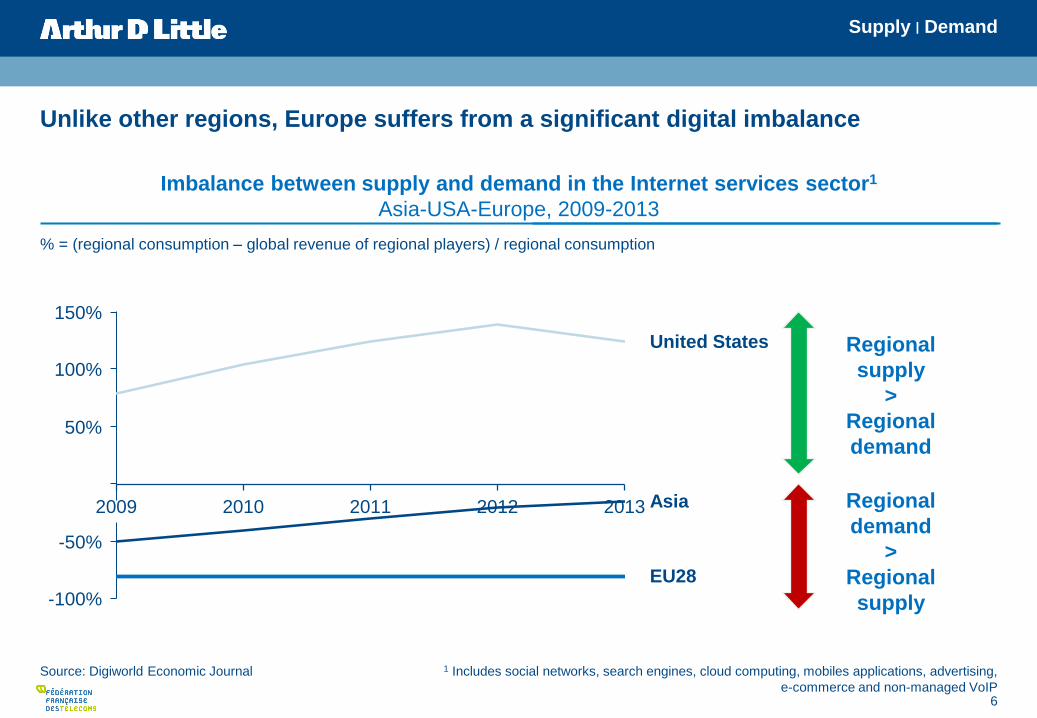
Unlike other regions, Europe suffers from a significant digital imbalance
Source: Digiworld Economic Journal 1 Includes social networks, search engines, cloud computing, mobiles applications, advertising,
e-commerce and non-managed VoIP
% = (regional consumption – global revenue of regional players) / regional consumption
2009 2010 2011 2012 2013
50%
-50%
-100%
100%
150%
EU28
United States
Asia
Imbalance between supply and demand in the Internet services sector1
Asia-USA-Europe, 2009-2013
Regional
supply
>
Regional
demand
Regional
demand
>
Regional
supply
Supply | Demand

7
Key messages
Proposals from the Fédération Française des Télécoms to strengthen telecom
operators and digital in France and Europe 5
European and French digital demand is highly developed enabled by high
quality networks 2
Telecom operators are the basis of the current and future digital supply 3
5 key levers to develop a strong digital offer in France and in Europe 4
Unlike other regions, Europe suffers from a significant digital imbalance 1

8
Appetite for telecom and digital services is especially strong in France – the French
are « early adopters »
Source: IHS, European Commission, desk research, Arthur D. Little analysis
Internet wave Digital wave
country worldwide for
IPTV penetration
European country for
VoD penetration
Market worldwide for Airbnb
and 2nd in Europe for Uber
1st 1st 2nd
Origin of
champion players ?
Appetite for
innovative services
in France
+
Supply | Demand
9
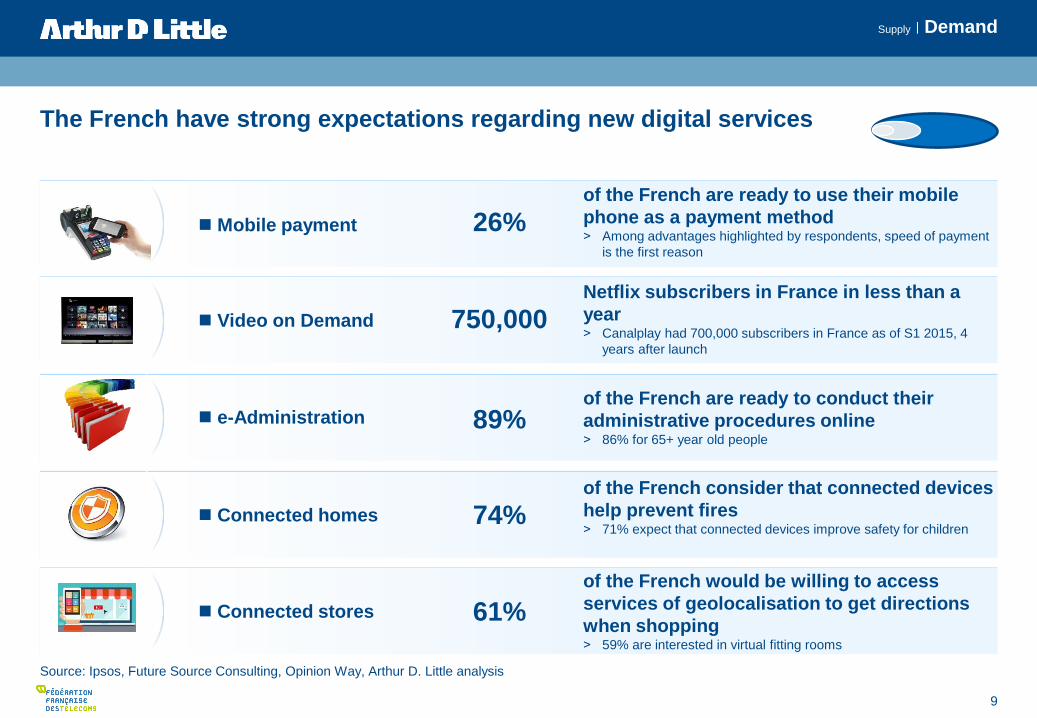
The French have strong expectations regarding new digital services
Source: Ipsos, Future Source Consulting, Opinion Way, Arthur D. Little analysis
e-Administration
Mobile payment
of the French are ready to use their mobile
phone as a payment method ˃ Among advantages highlighted by respondents, speed of payment
is the first reason
of the French consider that connected devices
help prevent fires ˃ 71% expect that connected devices improve safety for children
89%
26%
74%
Connected homes
Connected stores
61%
of the French would be willing to access
services of geolocalisation to get directions
when shopping ˃ 59% are interested in virtual fitting rooms
Video on Demand 750,000 Netflix subscribers in France in less than a
year ˃ Canalplay had 700,000 subscribers in France as of S1 2015, 4
years after launch
of the French are ready to conduct their
administrative procedures online ˃ 86% for 65+ year old people
Supply | Demand

10
Very High Speed fixed broadband subscriptions grew strongly in France in
2014 – with a high level of quality
Source: ARCEP, OECD, companies, Arthur D. Little analysis
Connectivity and equipment in France – Fixed broadband
1 Bundle subscriptions with TV and Internet access
2 Speed >= 30 Mbps 3 Fixed broadband and other subscriptions
+63%
Q2 2015
3.8
Q2 2014
2.4
Very High Speed2 broadband
subscriptions
(Millions of subscriptions)
Multiplay1 subscriptions
(% fixed broadband subscriptions)
+4%
Q2 2013
65% 69%
Q2 2014
68%
Q2 2015 Q2 2012
62%
Average speed3
(Mbps)
27 Mbps
+6 Mbps
21 Mbps
USA France
Required
speed
4K video
1-5 Mbps 2-5 Mbps
(SD or HD) 25 Mbps
Supply | Demand

11
The French mobile market is very dynamic with a rapid development
of data usage and equipment
Source: WCIS, ARCEP, operators, Arthur D. Little analysis
Average monthly data
consumption Smartphone penetration
(Millions of smartphones)
Connectivity and equipment in France – Mobile
4G active cards
(Millions of active cards)
39
33
22
+35%
2014 2013 2012
+186%
Q2 2015
15.6
Q2 2014
5.5
X%
34% 51% 60% 8% 24%
% of the population
1.5 Go
400%
4G 3G
300 Mo
Supply | Demand

12
€47€45
€30€26€20€20
French telecom operators continue to offer the cheapest services vs. other large
countries
Source: operators, Arthur D. Little analysis
60 offerings compared
US SP UK IT AL
In € / month incl. taxes
€20 €43 €30 €69 2014 › €39 €43 €20 €24 €29 €54 €45 €28
Fixed (Triple Play)1 Mobile2
Offer benchmark – Main operators
October 2015
€74
€47€42
€30€25
€202015 ›
1 Triple play offers only; unlimited calls to fixed lines at least; unlimited high-speed Internet via xDSL or fibre; TV included, except for additional
packages; operators with > 10% market share; 2 Unlimited calls when available (otherwise >500 minutes), unlimited SMS/MMS,
2 Go Internet at least; offers excluding device, free of engagement when available; operators with > 10% market share
Supply | Demand

13
Key messages
Proposals from the Fédération Française des Télécoms to strengthen telecom
operators and digital in France and Europe 5
European and French digital demand is highly developed enabled by high quality
networks 2
Telecom operators are the basis of the current and future digital supply 3
5 key levers to develop a strong digital offer in France and in Europe 4
Unlike other regions, Europe suffers from a significant digital imbalance 1
14
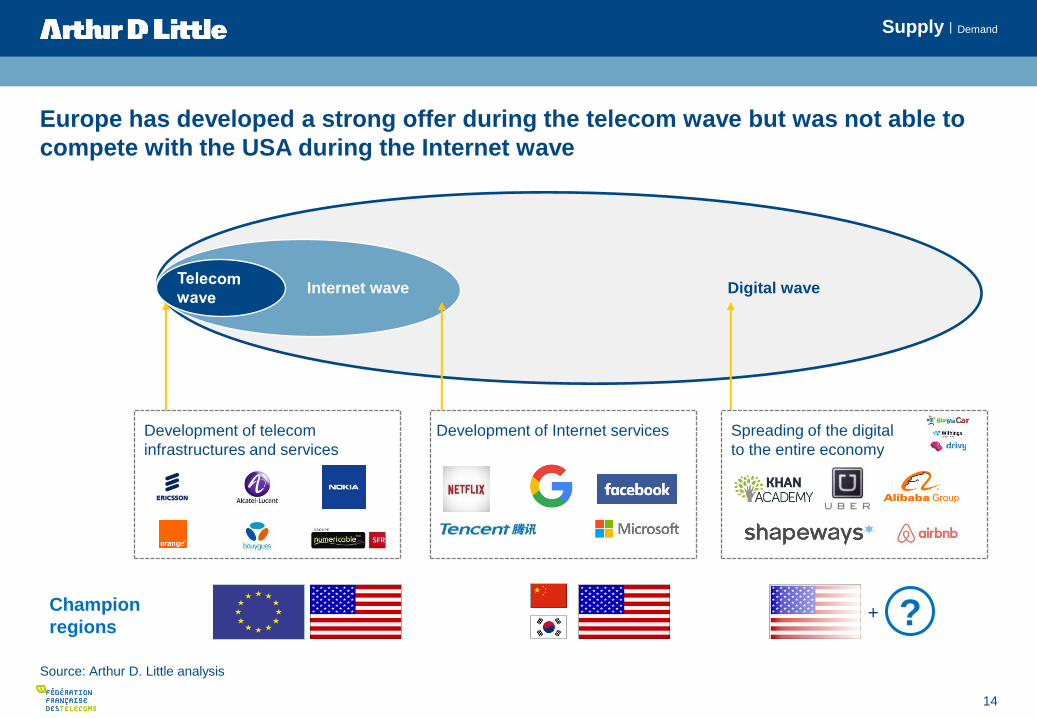
Development of Internet services
Europe has developed a strong offer during the telecom wave but was not able to
compete with the USA during the Internet wave
Source: Arthur D. Little analysis
Internet wave Digital wave
Spreading of the digital
to the entire economy
Development of telecom
infrastructures and services
Champion
regions
Supply | Demand
? +
15
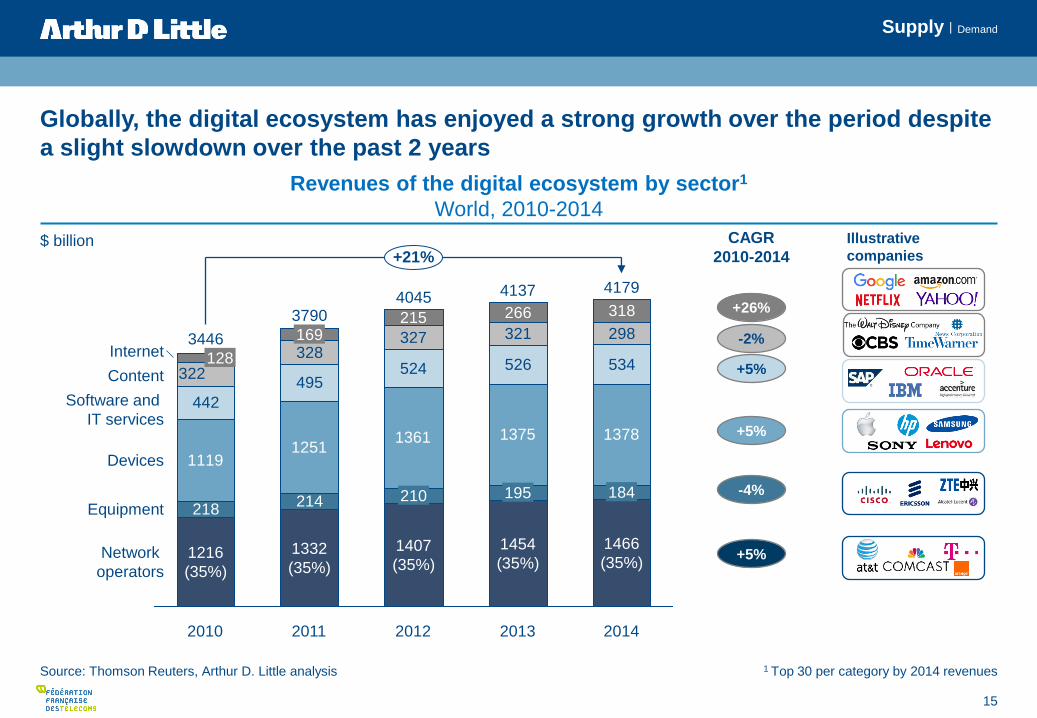
Globally, the digital ecosystem has enjoyed a strong growth over the period despite
a slight slowdown over the past 2 years
Source: Thomson Reuters, Arthur D. Little analysis
1 Top 30 per category by 2014 revenues
Illustrative
companies
Revenues of the digital ecosystem by sector1
World, 2010-2014
11191251
1361 1375 1378
442
495524 526 534
328327 321 298215 266 318
214218
322
Equipment
+21%
Network
operators
Devices
Software and
IT services
Content
Internet
2014
4179
1466
(35%)
184
2013
4137
1454
(35%)
195
2012
4045
1407
(35%)
210
2011
3790
1332
(35%)
169
2010
3446
1216
(35%)
128
CAGR
2010-2014
-2%
-4%
+5%
+5%
+26%
+5%
$ billion
Supply | Demand

16
Europe is the only region which does not benefit from the growth of the digital
ecosystem
Source: Thomson Reuters, Arthur D. Little analysis
South
America
Europe
Oceania
Asia
North
America
681 694 700 668
1 316 1 494 1 614 1 721 1 825
1 3711 521
1 638 1 656 1 674
590
2014
+5%
4 179
66
24
2013
4 137
68
24
2012
4 045
67
26
2011
3 790
54
27
2010
3 446
56
21
Revenues of the digital ecosystem (telecoms + other players1) per region2,3
World, 2010-2014
$ billion CAGR
2010-2014
+4%
-4%
+5%
+9%
+3%
1 Includes Internet, content, software, devices and telco equipment
2 Top 30 per category by 2014 revenues 3 Nationality according to HQ location
Supply | Demand

17
Telecom operators are the basis of the current and future digital supply but their
revenues decreased in Europe, as opposed to those in other regions
Source: Thomson Reuters, Arthur D. Little analysis
382 343
299247
2014
590
2010
681
Europe
Network
operators
Other Internet
players1
410 541
961
2014
1 674
1 133
2010
1 371
Asia
354500
962
2010
1 316
1 825
2014
1 325
North
America
CAGR 2010-2014
Network operators -3% +7% +9%
Revenues of the digital ecosystem (telecoms + other players1) per sector2,3
World, 2010-2014
$ billion
1 Includes Internet, content, software, devices and telco equipment
2 Top 30 per category by 2014 revenues 3 Nationality according to HQ location
Supply | Demand

18
1% 9%
1% 2%
87%
1 Revenues declared in France or released in the press 2 Adjusted data to account for estimated revenues of international players in France
3 Investments of Nokia’s mobile business unit are reported with Microsoft following the acquisition of this unit by the latter in 2014 4 Income tax and taxes. 2013 figures because data for 2014 are not available
12%
13%
15%
3%
58%
Telecom operators are central to the French digital ecosystem accounting for ~60% of
revenues, 75% of employment and ~90% of investments and taxes
Source: Diane, annual reports, Arthur D. Little analysis
5 content
players
5 Internet OTT
players
Relative size of sub-sectors in the digital ecosystem
France, 2014
5 telecom
operators
5 equipment
vendors
5 device
manufacturers
4%
14%
1%
6%
75%
4%
3%
4%
1%
88%
Revenues1,2
€69 B
vs 59% in
2013
Direct jobs
156 000
vs 77% in
2013
Investments3
€7 B
vs 91% in
2013
Taxes4
€4 B
vs 81% in
2012
Supply | Demand
19
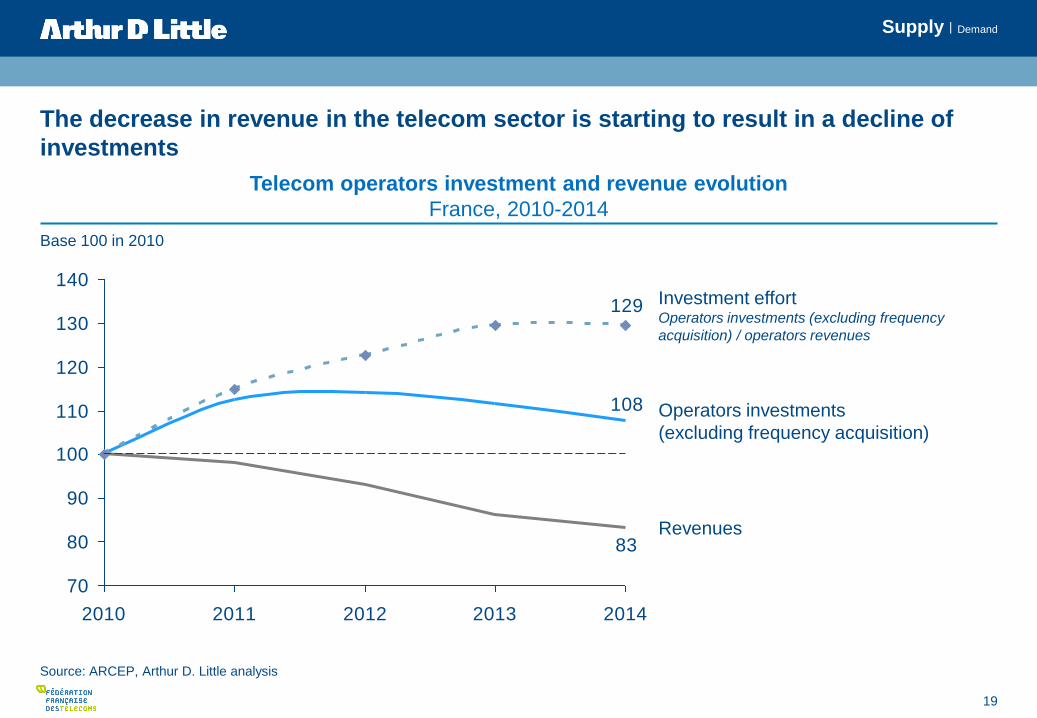
The decrease in revenue in the telecom sector is starting to result in a decline of
investments
Source: ARCEP, Arthur D. Little analysis
108
83
129
70
80
90
100
110
120
130
140
2010 2011 2012 2013 2014
Revenues
Operators investments
(excluding frequency acquisition)
Telecom operators investment and revenue evolution
France, 2010-2014
Base 100 in 2010
Investment effort Operators investments (excluding frequency
acquisition) / operators revenues
Supply | Demand
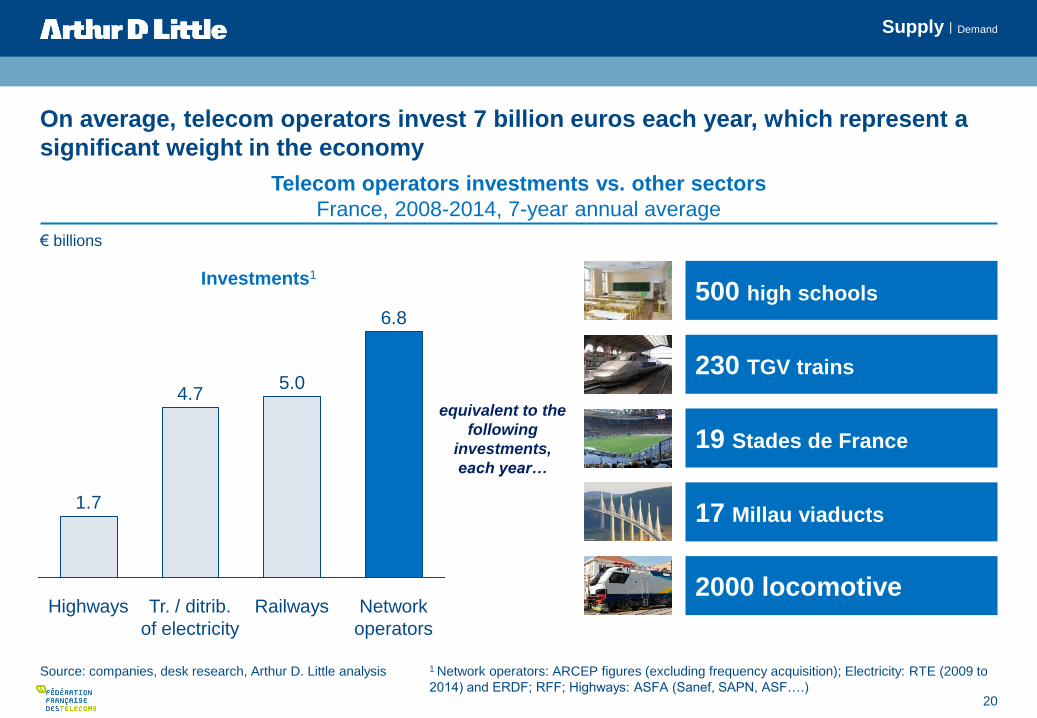
20
Network
operators
6.8
Railways
5.0
Tr. / ditrib.
of electricity
4.7
Highways
1.7
On average, telecom operators invest 7 billion euros each year, which represent a
significant weight in the economy
Source: companies, desk research, Arthur D. Little analysis
Telecom operators investments vs. other sectors
France, 2008-2014, 7-year annual average
Investments1
230 TGV trains
2000 locomotive
17 Millau viaducts
19 Stades de France
500 high schools
1 Network operators: ARCEP figures (excluding frequency acquisition); Electricity: RTE (2009 to
2014) and ERDF; RFF; Highways: ASFA (Sanef, SAPN, ASF….)
equivalent to the
following
investments,
each year…
€ billions
Supply | Demand

21
Connected warehouse Advanced Collaboration at work
Remote caring Secure
Home Delivery
Ambient presence for telemedicine
Immersive Gaming
Future advanced services will emerge and will require high performing telecom
networks
Source: Corning, Microsoft, Sprint, DHL, Arthur D. Little analysis
Examples of future advanced services
Supply | Demand
22
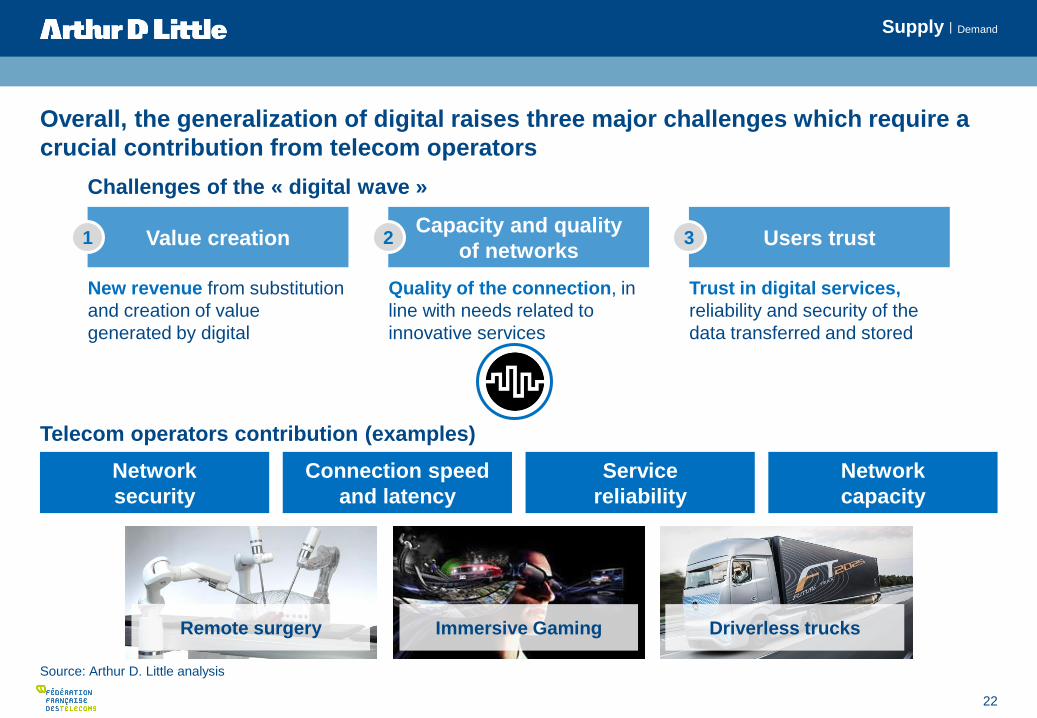
Overall, the generalization of digital raises three major challenges which require a
crucial contribution from telecom operators
Source: Arthur D. Little analysis
Network
security
Connection speed
and latency
Service
reliability
Network
capacity
Driverless trucks Immersive Gaming Remote surgery
Telecom operators contribution (examples)
Challenges of the « digital wave »
Value creation Capacity and quality
of networks Users trust
New revenue from substitution
and creation of value
generated by digital
Trust in digital services,
reliability and security of the
data transferred and stored
Quality of the connection, in
line with needs related to
innovative services
1 2 3
Supply | Demand

23
Source: TechCrunch, GP Bullhound, Arthur D. Little analysis 1 « Unicorn » refers to tech companies founded after 2000 (2003 for American
companies) with a valuation above 1 billion dollars
23446
17
40
84
Number of « unicorns1 »
USA-Europe, 2015
With the 3rd digital wave, new “pure players” are emerging and contribute to the
generalization of digital to the entire economy 1
Supply | Demand

25
The development of some innovative digital services requires highly performing
networks regarding security, speed, reliability and capacity
Source: Cisco, Arthur D. Little analysis
2
Network
security
Connection
speed
Service
reliability
Network
capacity
Strong increase in security
needs
– Increase of risks due to
the development of
connected devices (11
billions devices by 2019
vs. 3 in 2014)
– Network security has
been harder to achieve
for the past 2 years
according to ~80% of
cybersecurity
professionals
Need for an uninterrupted
connection to handle new
services
– Deployment of remote
surgery or driverless
car impossible without
the assurance of an
uninterrupted connection
Strong increase in data
consumption
– Data traffic per user x3
between 2014 and 2019
(from 6 GB to 18 GB)
– 80% of internet traffic
will come from videos in
2019 especially HD
videos
Strong demand for Very
High Speed
– Medicine or immersive
gaming requires
massive instant data
exchange
– Average speed 2x
faster in 2019 (43 Mbps
in 2019 vs 20 Mbps in
2014)
Driverless trucks Immersive Gaming Remote surgery
Supply | Demand

26
With the multiplication of digital services, the challenge of “data sovereignty”
became key
Source: IDC, Arthur D. Little analysis 1 1 Zettabytes = 1 000 billion Gigabytes
44
4
2013
x10
2020
Volume of data produced
(Zettabytes1)
Cancellation of the « Safe
Harbor » policy
– Decision from the Court of
Justice of the European Union
in October 2015
– Data collected by American
companies under the “Safe
Harbor” agreement will now
have to stay in Europe
Since October 2015
« Safe Harbor » agreement
Allows American companies
– Transfer the data from their
European consumers to the
USA
– Data protection warranties
based on the trust in American
companies that they will use
the data accordingly with
European laws
Between 2000 and 2015
3
Supply | Demand

27
In essence, telecom operators have a central role to play in the promotion and the
generalization of digital to the entire economy
Source: CrunchBase, Cisco, AT&T, Ipsos / Fédération Française des Télécoms, Arthur D. Little analysis
1 Roadside assistance application
Financing Distribution Service Protection Infrastructure
Investments in
innovative
companies through
Corporate Venture
Acceleration of the
generalization of
innovative digital
services through
partnerships
Development of
infrastructures
capable to meet the
requirements of
innovative services
Development and
launch of new digital
services
Management of
personal data of
Internet users
7m€ Amount raised by
Urgent.ly1 in part
from Verizon
Increase in the
number of subscribers
after partnership
with telecom
operators
Expected increase in
the volume of data
between 2014 and
2019
+40% of cars connected
by AT&T in the USA
3m x3,2 Less than 5% of the French do not
trust telecom operators
for data protection vs.
67% for « Internet
giants »
Supply | Demand

28
Key messages
Proposals from the Fédération Française des Télécoms to strengthen telecom
operators and digital in France and Europe 5
European and French digital demand is highly developed enabled by high quality
networks 2
Telecom operators are the basis of the current and future digital supply 3
5 key levers to develop a strong digital offer in France and in Europe 4
Unlike other regions, Europe suffers from a significant digital imbalance 1
29
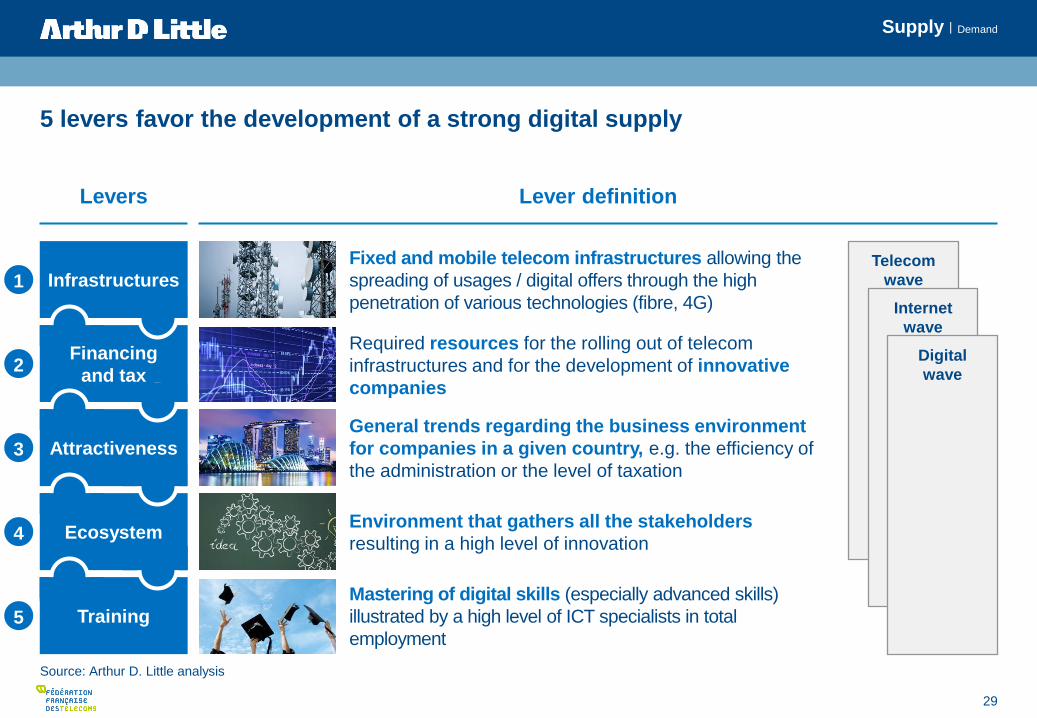
5 levers favor the development of a strong digital supply
Source: Arthur D. Little analysis
Levers Lever definition
Fixed and mobile telecom infrastructures allowing the
spreading of usages / digital offers through the high
penetration of various technologies (fibre, 4G)
Required resources for the rolling out of telecom
infrastructures and for the development of innovative
companies
General trends regarding the business environment
for companies in a given country, e.g. the efficiency of
the administration or the level of taxation
Environment that gathers all the stakeholders
resulting in a high level of innovation
Mastering of digital skills (especially advanced skills)
illustrated by a high level of ICT specialists in total
employment
Telecom
wave
Internet
wave
Digital
wave
Attractiveness
Infrastructures
Financing
and tax
Ecosystem
Training
1
2
3
4
5
Supply | Demand

30
United Kingdom
government’s position on
telecom regulation
Cybersecurity training in the
United Kingdom
Access to Venture Capital
in the USA
Ease of administrative
procedures in South Korea
(4 days to create a company)
Development of fibre in
South Korea
The development of a performing supply on the 3 waves can be based on best
practices from leading countries
Source: Arthur D. Little analysis
Telecom wave
Possibility to be financed by
capital markets (e.g. in the
USA)
Telecom Council of the
Silicon Valley
Levers Internet wave Digital wave
Development of dedicated
infrastructures, especially
for the cloud
Silicon Valley in the USA
Leading universities in
computer sciences in the
USA
Dedicated networks and
services for the Internet of
Things
Venture Capital and
Corporate Venture in the
USA
Open innovation
Status of the “Jeunes
Entreprises Innovantes” in
France
Education on an industry
coupled with digital
Attractiveness
Infrastructures
Financing
and tax
Ecosystem
Training
1
2
3
4
5
Supply | Demand
31
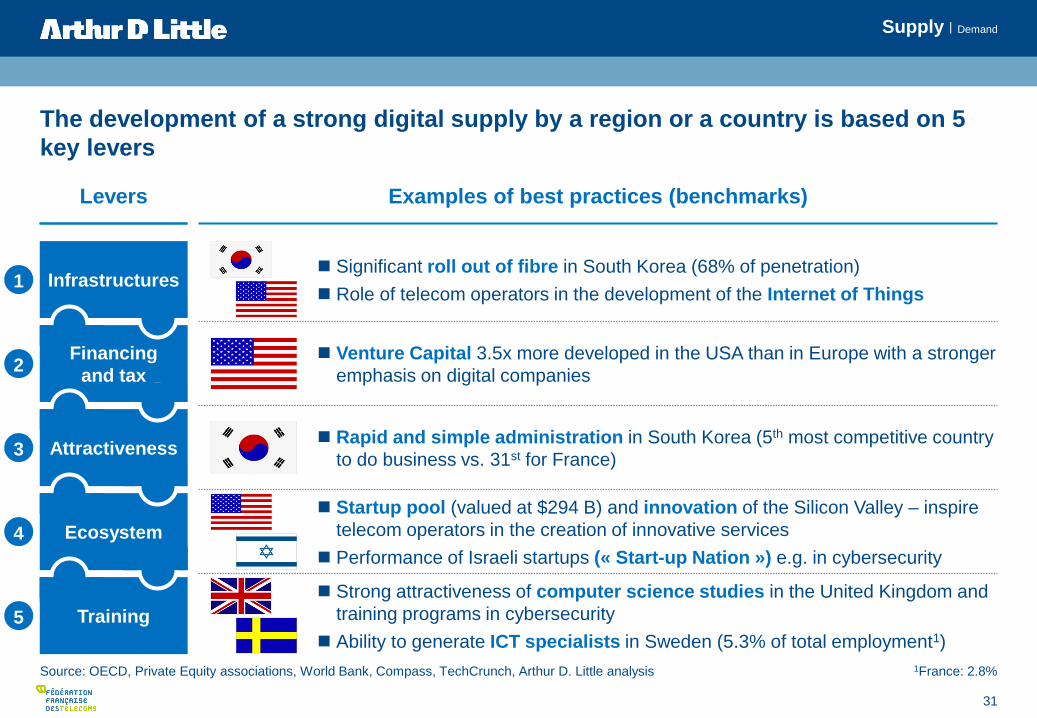
The development of a strong digital supply by a region or a country is based on 5
key levers
Source: OECD, Private Equity associations, World Bank, Compass, TechCrunch, Arthur D. Little analysis
Significant roll out of fibre in South Korea (68% of penetration)
Role of telecom operators in the development of the Internet of Things
Examples of best practices (benchmarks)
Venture Capital 3.5x more developed in the USA than in Europe with a stronger
emphasis on digital companies
Startup pool (valued at $294 B) and innovation of the Silicon Valley – inspire
telecom operators in the creation of innovative services
Performance of Israeli startups (« Start-up Nation ») e.g. in cybersecurity
Rapid and simple administration in South Korea (5th most competitive country
to do business vs. 31st for France)
Levers
Strong attractiveness of computer science studies in the United Kingdom and
training programs in cybersecurity
Ability to generate ICT specialists in Sweden (5.3% of total employment1)
Attractiveness
Infrastructures
Financing
and tax
Ecosystem
Training
1
2
3
4
5
1France: 2.8%
Supply | Demand

32
To date, policies do not stimulate players of the three waves enough whereas a
simultaneous action could help balancing the digital supply
Source: Arthur D. Little analysis
Missed opportunity Past lack of focused industrial policies
leading to an underdeveloped digital
supply in France and in Europe
Multiplication of taxes Accumulation of specific telecom taxes
and continued increase of those taxes
(e.g.: « telecom tax »)
Internet
players
Telecom
players
Digital
players Willingness to act Multiplication of fiscal initiatives and
programs favoring the emergence of
innovative startups
Actions that strengthen / weaken
the digital supply
Develop software and
internet offers!
Support the networks
of the future!
Seize the digital
opportunity!
Current policies
(asymmetric stimulation)
Public policies
(symmetric stimulation)
Supply | Demand

33
France can strengthen its share of ICT in the economy by learning from best
practices of leading countries
Source: OECD, Arthur D. Little analysis
Share of the ICT sector in total value added
OECD, 2013
4%4%5%
6%6%7%7%
11%
OECD
average: 5.5%
+7pts
South
Korea Japan Sweden USA
United
Kingdom Germany France Spain
% of the ICT value added in total value added
Supply | Demand

34
5,5%
4,3%
1,3%
France OCDE
If France slightly exceeds the OECD average, it could create 25 billion euros in
value
Potential value creation generated by an optimization of digital ecosystem levers
Potential
value creation +25 billion euros in additional
value added
Current
situation +11 billion1 euros in additional
tax revenue
% of value added of the ICT sector in total value added
1 based on the average tax rate in France Source: OECD, UN, 2013 tax bill, Arthur D. Little analysis
Supply | Demand

35
The spreading of the 3rd digital wave to the entire French economy raises both a risk
and an opportunity to reduce the digital deficit Reminder
2025
+150 to
+200 +350 to
+450 -200 to
-250
2015
1 055
Source: Insee, Arthur D. Little analysis Note: estimated impact by applying the trends observed on the taxi market adapted according to the industry 1 Value added at constant scope excluding organic growth
Impact of the generalization of digital to the entire French economy
Value added1 of
main sectors
impacted by the
spreading of
the digital
Insurance Banking
Retail Tra./Hos.
Catering Manuf.
Education
Administration
Healthcare
Cannibalization
of historical
activities
Development of
digital-related
activities
Net value
added creation
Challenge: develop a French /
European digital supply
€ billions
Supply | Demand

36
Reducing the imbalance on each wave will lead to a creation of value for the entire
economy
Source: Arthur D. Little analysis 1 10 year horizon 2 excluding a risk of value capture by non European players
FRANCE SCOPE
Value creation potential:
+€25 B
Stimulate the telecom sector /
Internet, and rebalance supply
and demand Value creation potential:
+€150 to 200 B1,2
Seize the opportunity of
the 3rd digital wave
Digital wave Internet wave
Supply | Demand

37
Key messages
Proposals from the Fédération Française des Télécoms to strengthen
telecom operators and digital in France and Europe 5
European and French digital demand is highly developed enabled by high quality
networks 2
Telecom operators are the basis of the current and future digital supply 3
5 key levers to develop a strong digital offer in France and in Europe 4
Unlike other regions, Europe suffers from a significant digital imbalance 1
38
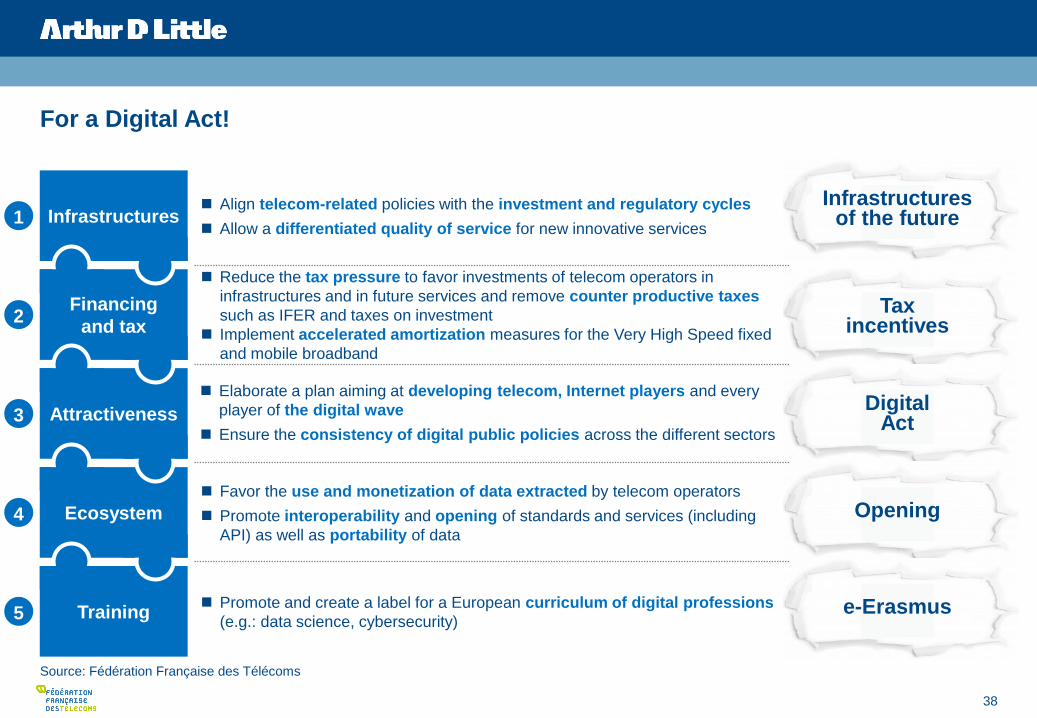
For a Digital Act!
Align telecom-related policies with the investment and regulatory cycles
Allow a differentiated quality of service for new innovative services
Reduce the tax pressure to favor investments of telecom operators in
infrastructures and in future services and remove counter productive taxes
such as IFER and taxes on investment
Implement accelerated amortization measures for the Very High Speed fixed
and mobile broadband
Favor the use and monetization of data extracted by telecom operators
Promote interoperability and opening of standards and services (including
API) as well as portability of data
Elaborate a plan aiming at developing telecom, Internet players and every
player of the digital wave
Ensure the consistency of digital public policies across the different sectors
Promote and create a label for a European curriculum of digital professions
(e.g.: data science, cybersecurity)
Infrastructures
Financing
and tax
Attractiveness
Ecosystem
Training
1
2
3
4
5
Source: Fédération Française des Télécoms
Infrastructures of the future
Tax incentives
Digital Act
Opening
e-Erasmus

39
Reminder - In essence, telecom operators have a central role to play in the
promotion and the generalization of digital to the entire economy
Source: CrunchBase, Cisco, AT&T, Ipsos / Fédération Française des Télécoms, Arthur D. Little analysis
1 Roadside assistance application
Financing Distribution Service Protection Infrastructure
Investments in
innovative
companies through
Corporate Venture
Acceleration of the
generalization of
innovative digital
services through
partnerships
Development of
infrastructures
capable to meet the
requirements of
innovative services
Development and
launch of new digital
services
Management of
personal data of
Internet users
7m€ Amount raised by
Urgent.ly1 in part
from Verizon
Increase in the
number of subscribers
after partnership
with telecom
operators
Expected increase in
the volume of data
between 2014 and
2019
+40% of cars connected
by AT&T in the USA
3m x3,2 Less than 5% of the French do not
trust telecom operators
for data protection vs.
67% for « Internet
giants »

40
As the world’s first consultancy, Arthur D. Little
has been at the forefront of innovation for more
than 125 years. We are acknowledged as a
thought leader in linking strategy, innovation
and transformation. Our consultants
consistently develop enduring next generation
solutions to master our clients' business
complexity and to deliver sustainable results
suited to the economic reality of each of our
clients.
Arthur D. Little has offices in the most important
business cities around the world. We are proud
to serve many of the Fortune 500 companies
globally, in addition to other leading firms and
public sector organizations.
For further information please visit
www.adlittle.com
Copyright © Arthur D. Little 2015.
All rights reserved.