Embed Size (px)
Citation preview
The ACTION Project: Applications Coordinate with Transport, IP and
Optical Networks
WTON 2015
1
Andrea Fumagalli, the University of Texas at Dallas, USA Malathi Veeraraghavan, the University of Virginia, USA
Eiji Oki , the University of Electro-Communications, JapanSatoru Okamoto, the University of Electro-Communications, Japan
Naoaki Yamanaka, Keio University, Japan
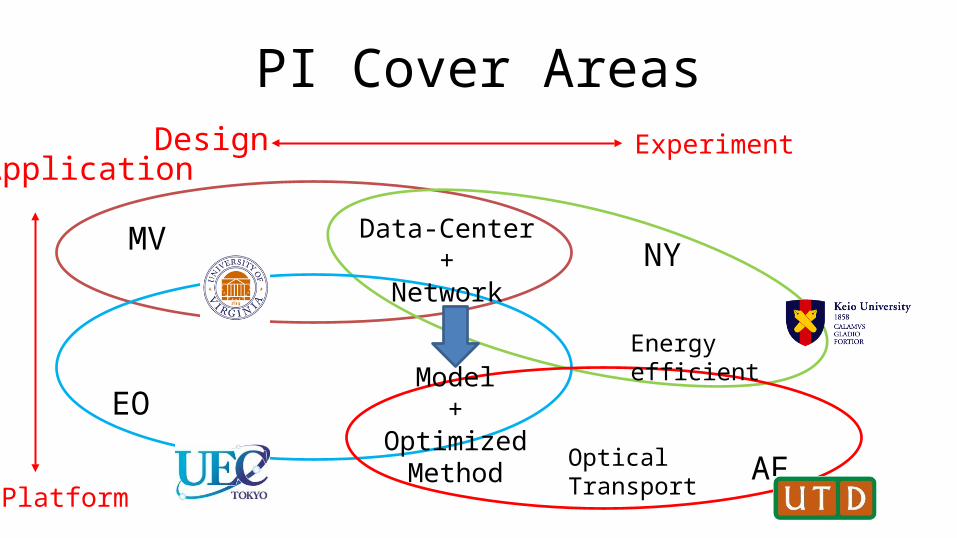
PI Cover Areas
MV
EO
NY
AF
Data-Center+
Network
Model+
Optimized MethodOptical Transport
Energy efficient
ExperimentDesignApplication
Platform

3
Outline• Part I:– Background– Objectives and work program organization
• Part II:– Analytical modeling effort at UT Dallas

4
Background• Four enabling technologies
1. Elastic Optical Networks (Flex Grid) [a]• WSS, Bandwidth Variable Transceivers (BVT), Energy Efficient Ethernet (EEE)
2. Sub-wavelength circuits (OTN, DSON)3. Dynamic circuit/virtual circuit (VC) technologies
• MPLS, VLAN, Ctrl. plane solutions (RSVP-TE, PCEP)
4. Software Defined Network (SDN)/OpenFlow• Measurements show that
– Internet links are underutilized [b]– Networks are not operated in an energy-efficient manner [c][a] Gerstel, O.; Jinno, M.; Lord, A.; Yoo, S.J.B., "Elastic optical networking: a new dawn for the optical layer?," IEEE
Comm. Mag., February 2012[b] Sushant Jain, et al., B4: experience with a globally-deployed software defined WAN, SIGCOMM '13. [c] Dennis Abts, et al. Energy proportional datacenter networks. SIGARCH Comput. Archit. News June 2010
5
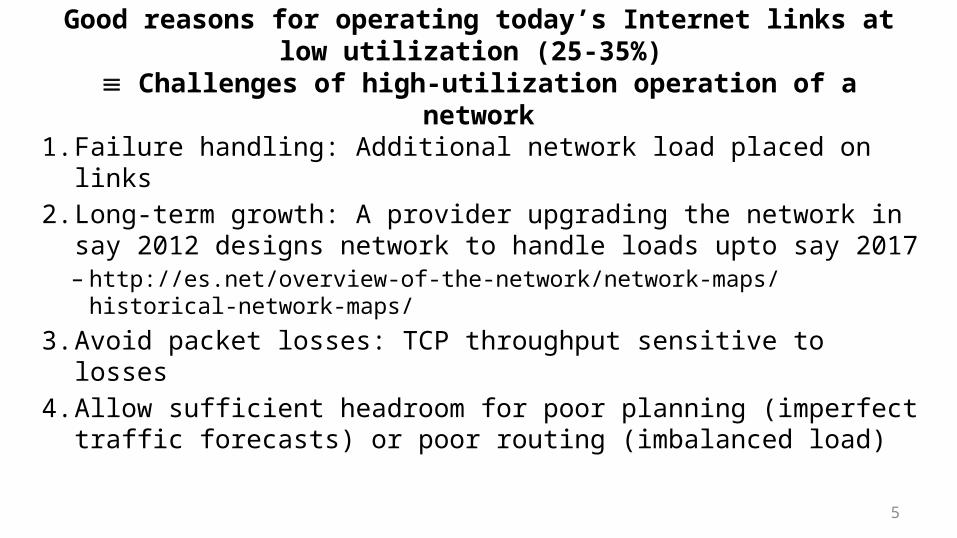
Good reasons for operating today’s Internet links at low utilization (25-35%)
Challenges of high-utilization operation of a network
1. Failure handling: Additional network load placed on links2. Long-term growth: A provider upgrading the network in
say 2012 designs network to handle loads upto say 2017– http://es.net/overview-of-the-network/network-maps/
historical-network-maps/
3. Avoid packet losses: TCP throughput sensitive to losses4. Allow sufficient headroom for poor planning (imperfect
traffic forecasts) or poor routing (imbalanced load)
6
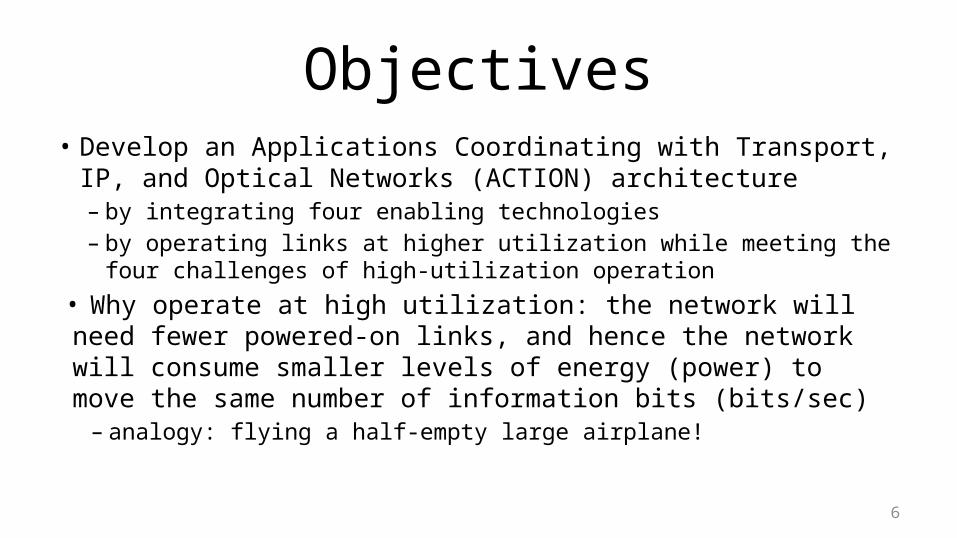
Objectives• Develop an Applications Coordinating with Transport, IP, and
Optical Networks (ACTION) architecture – by integrating four enabling technologies – by operating links at higher utilization while meeting the four challenges
of high-utilization operation• Why operate at high utilization: the network will need fewer powered-on links, and hence the network will consume smaller levels of energy (power) to move the same number of information bits (bits/sec) – analogy: flying a half-empty large airplane!
7
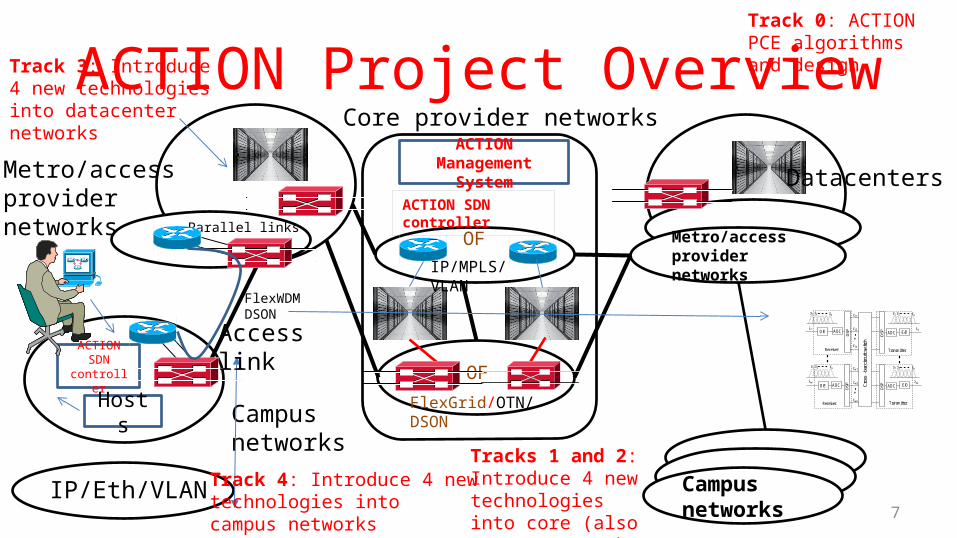
ACTION Project OverviewCore provider networks
Metro/accessprovidernetworks
Campus networks
Campus networks
Metro/access provider networks
ACTIONManagement System
Track 3: Introduce 4 new technologiesinto datacenter networks
Tracks 1 and 2:Introduce 4 newtechnologies into core (also metro) networks
ACTION SDN controller
Parallel links
FlexWDMDSON
FlexGrid/OTN/DSON
IP/MPLS/VLAN
OF
OF
ACTION SDN controller
Datacenters
Track 4: Introduce 4 newtechnologies into campus networks
Hosts
IP/Eth/VLAN
Accesslink
c11
c12
c1u
cw1
cw2
cwu
Cros
s-b
ar c
ircui
t sw
itch
ADC
Receiver
DSP
1
DSP
ADC
Transmitter
w ADC
Receiver
DSP
w
DSP
ADC
Transmitter
s1 s2 su
O/E 1
O/E
E/O
E/O
s1 s2 su
s1 s2 su
s1 s2 su
Track 0: ACTION PCE algorithms and design
8
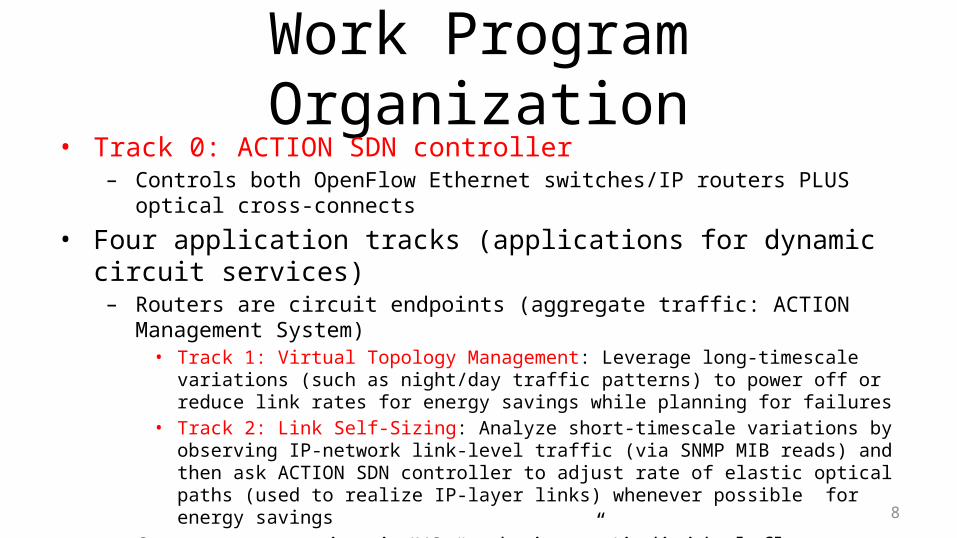
Work Program Organization• Track 0: ACTION SDN controller
– Controls both OpenFlow Ethernet switches/IP routers PLUS optical cross-connects
• Four application tracks (applications for dynamic circuit services)– Routers are circuit endpoints (aggregate traffic: ACTION Management System)
• Track 1: Virtual Topology Management: Leverage long-timescale variations (such as night/day traffic patterns) to power off or reduce link rates for energy savings while planning for failures
• Track 2: Link Self-Sizing: Analyze short-timescale variations by observing IP-network link-level traffic (via SNMP MIB reads) and then ask ACTION SDN controller to adjust rate of elastic optical paths (used to realize IP-layer links) whenever possible for energy savings
– Computers are circuit/VC “endpoints” (individual flows: application triggers from endpoints)• Track 3: Hybrid Data-Center Networks: EON + applications (Hadoop scheduling) • Track 4: Campus Networks: Router access links adjustment
9
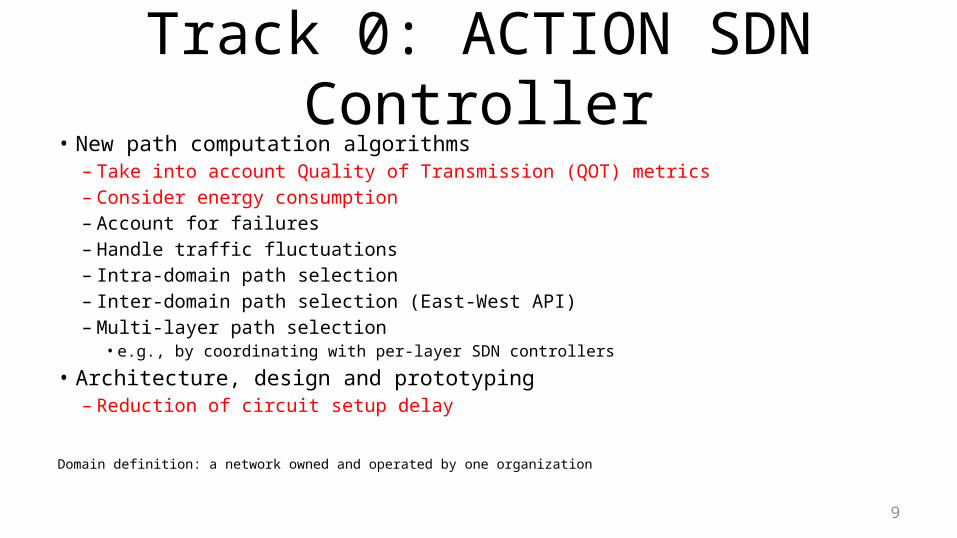
Track 0: ACTION SDN Controller• New path computation algorithms
– Take into account Quality of Transmission (QOT) metrics– Consider energy consumption– Account for failures– Handle traffic fluctuations– Intra-domain path selection– Inter-domain path selection (East-West API)– Multi-layer path selection
• e.g., by coordinating with per-layer SDN controllers
• Architecture, design and prototyping– Reduction of circuit setup delay
Domain definition: a network owned and operated by one organization

ACTION SDN Controller
10
Core, metro, campus, datacenter networks ACTION SDN
controller
Parallel links
FlexWDMDSON
1GE increments
Power consumption factors• Router I/O BVT• FFT for DSC multiplexing• Optical amplifiers
OA
Circuit setup delay factors• Control plane• Optical devices (OA, WSS)• Tx/Rx re-synchronization
Quality of Transmission (QoT)• OSNR and BER• Traffic Independent PLIs• Traffic Dependent PLIs
WSS
OXC
Router or switch
11
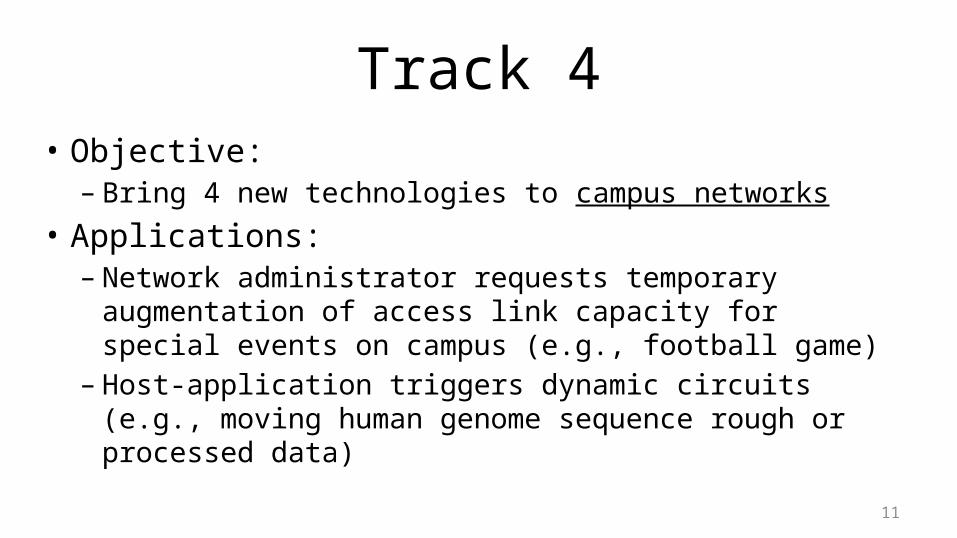
Track 4• Objective:– Bring 4 new technologies to campus networks
• Applications:– Network administrator requests temporary augmentation
of access link capacity for special events on campus (e.g., football game)
– Host-application triggers dynamic circuits (e.g., moving human genome sequence rough or processed data)
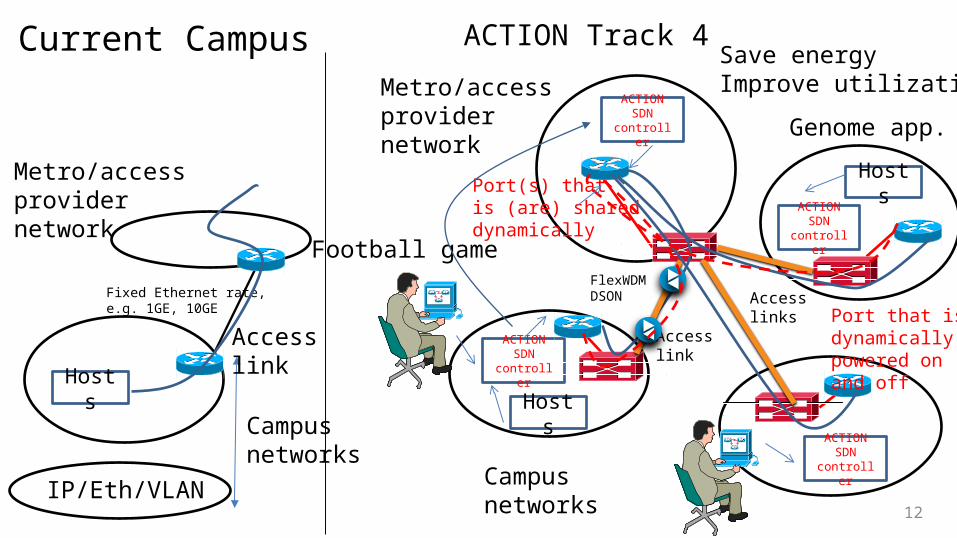
Current Campus
12
Metro/accessprovidernetwork
Campus networks
Fixed Ethernet rate,e.g. 1GE, 10GE
Hosts
IP/Eth/VLAN
Accesslink
ACTION Track 4Metro/access provider network
ACTION SDN controller
Port(s) thatis (are) shared dynamically
FlexWDMDSON
Hosts
Accesslink
ACTION SDN controller
Hosts
ACTION SDN controller
ACTION SDN controller
Port that isdynamicallypowered onand off
Genome app.
Campus networks
Football game
Save energyImprove utilization
Accesslinks
13
Work Plan (Track 4)• Prototype campus applications and test with VLAN switches on test-beds
(e.g., Keio test-bed)– Test assumptions– Collect measurements
• Define and implement simulation modules based on experimental data (e.g., CPqD test-bed)– PLI models for EON and DSON– Circuit setup delay models for optical components, physical control plane and
signaling– Energy consumption models
• Obtain real traffic traces from campuses• Run simulations and/or create analytical models of campus network to
estimate energy savings

14
Analytical Modeling Effort
“Spectrum Contiguity Fragmentation Analysis in a Two-Service Elastic Optical Link”
Shuyi Yan and Joobum Kim
15
Contents• Introduction• Proposed spectrum fragmentation analytical models
– Simple approximation model– Accurate model
• Numerical results– Single fiber study– Network-wide study (from simulation)
• Conclusion
Introduction
• Elastic Optical Network (EON)– Provide elastic optical bandwidth to support various data rates by
allocating spectrum resources proportionally to the amount of traffic carried by demands
– Higher spectrum utilization (compared to the traditional WDM)– Contiguity fragmentation of spectrum slices is a potential roadblock
• Definition of contiguity fragmentation:– The occurrence of small and non-contiguous spectrum slices that
cannot be used to accommodate large connection requests
Objective of Study
• Investigate the nature of contiguity fragmentation theoretically in EON
• Propose two analytical models for an optical fiber link hosting two types of service– Simple approximation model– Accurate model
System Assumptions
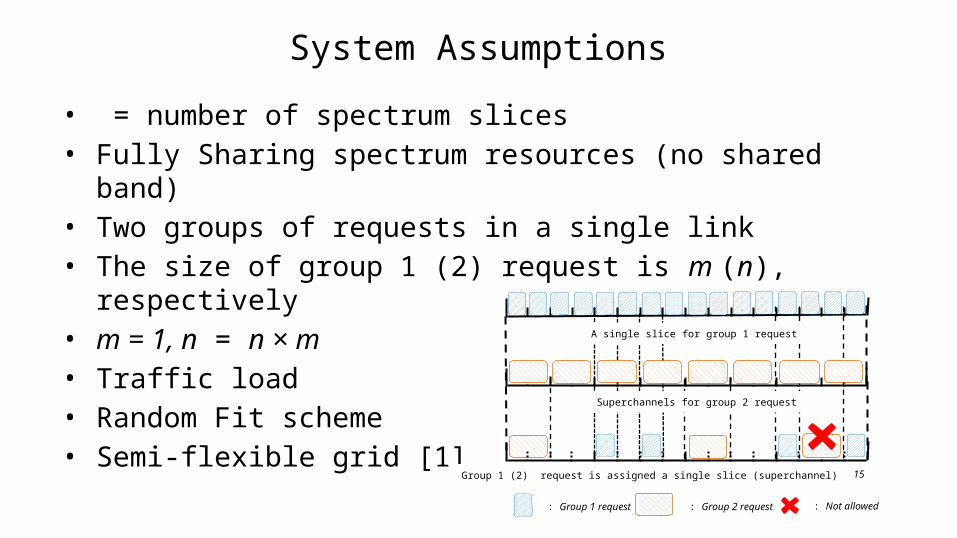
• = number of spectrum slices• Fully Sharing spectrum resources (no shared band)• Two groups of requests in a single link • The size of group 1 (2) request is m (n), respectively• m = 1, n = n × m• Traffic load • Random Fit scheme• Semi-flexible grid [1]
150
: Group 1 request : Group 2 request : Not allowed
Group 1 (2) request is assigned a single slice (superchannel)
A single slice for group 1 request
Superchannels for group 2 request
19
Simple Approximation Model

Approximation MC Model
• 2-dimensional MC state transition diagram
Markov Chain (MC) is represented by a super-state (i, j), where i is the number of group 1 requests and j is the number of group 2 requests currently reserved in the link
Blocking probability due to fragmentation (P(i,j)) experienced by group 2 requests
21
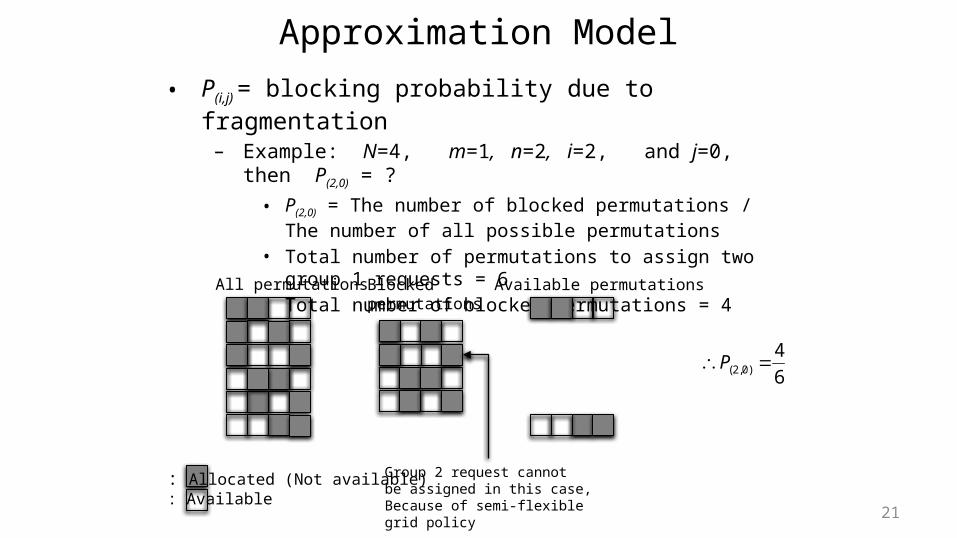
Approximation Model• P(i,j) = blocking probability due to fragmentation
– Example: N=4, m=1, n=2, i=2, and j=0, then P(2,0) = ?• P(2,0) = The number of blocked permutations / The number of all
possible permutations• Total number of permutations to assign two group 1 requests = 6• Total number of blocked permutations = 4
: Allocated (Not available): Available
All permutations Blocked permutations Available permutations
6
4)0,2( P
Group 2 request cannot be assigned in this case,Because of semi-flexiblegrid policy
22
Approximation Model
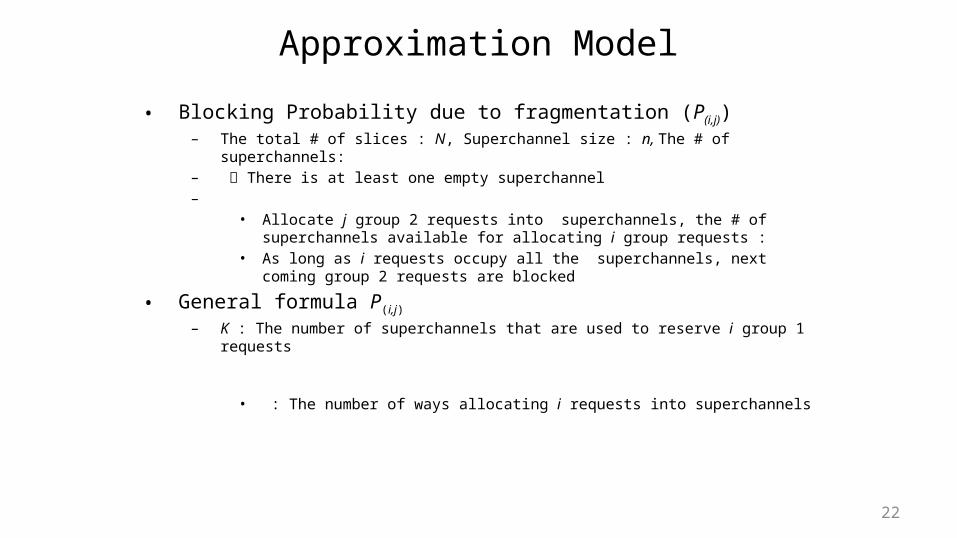
• Blocking Probability due to fragmentation (P(i,j))– The total # of slices : N, Superchannel size : n, The # of superchannels: – There is at least one empty superchannel–
• Allocate j group 2 requests into superchannels, the # of superchannels available for allocating i group requests :
• As long as i requests occupy all the superchannels, next coming group 2 requests are blocked
• General formula P(i,j)
– K : The number of superchannels that are used to reserve i group 1 requests
• : The number of ways allocating i requests into superchannels
23
Approximation Model
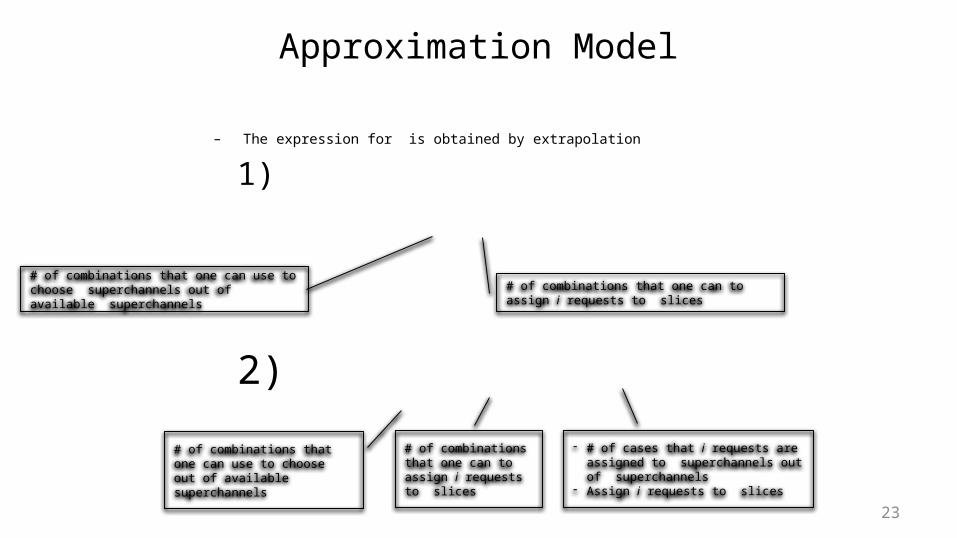
– The expression for is obtained by extrapolation
1)
2) # of combinations that one can use to choose superchannels out of available superchannels
# of combinations that one can to assign i requests to slices
# of combinations that one can use to choose out of available superchannels
# of combinations that one can to assign i requests to slices
- # of cases that i requests are assigned to superchannels out of superchannels
- Assign i requests to slices

24
Approximation Model
3)
# of combinations that one can use to choose superchannels out of available superchannels # of combinations that
one can to assign i requests to slices
- # of cases that i requests are assigned to +1 superchannels out of superchannels
- Assign i requests to slices
- # of cases that i requests are assigned to superchannels out of superchannels
- Assign i requests to slices
25
Approximation Model
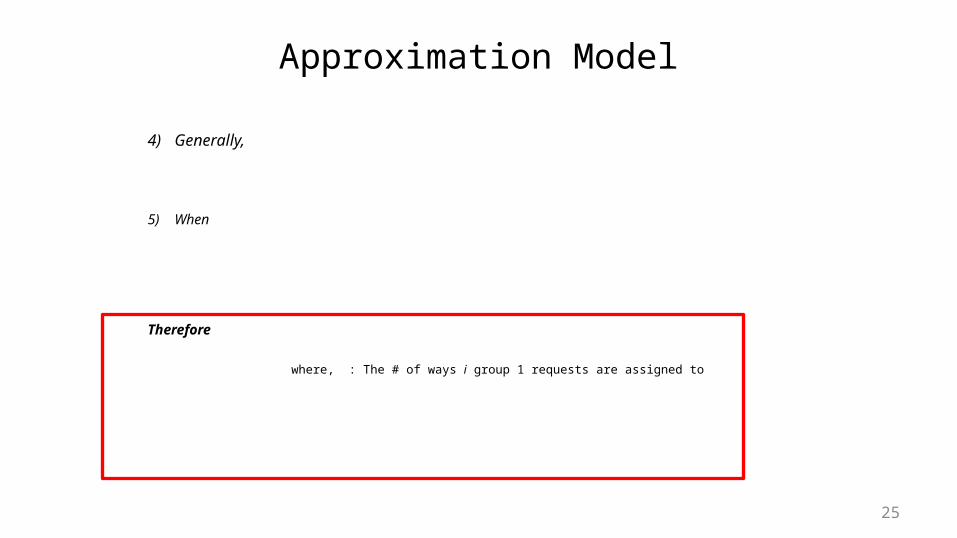
4) Generally,
5) When
Therefore
where, : The # of ways i group 1 requests are assigned to
Approximation Model
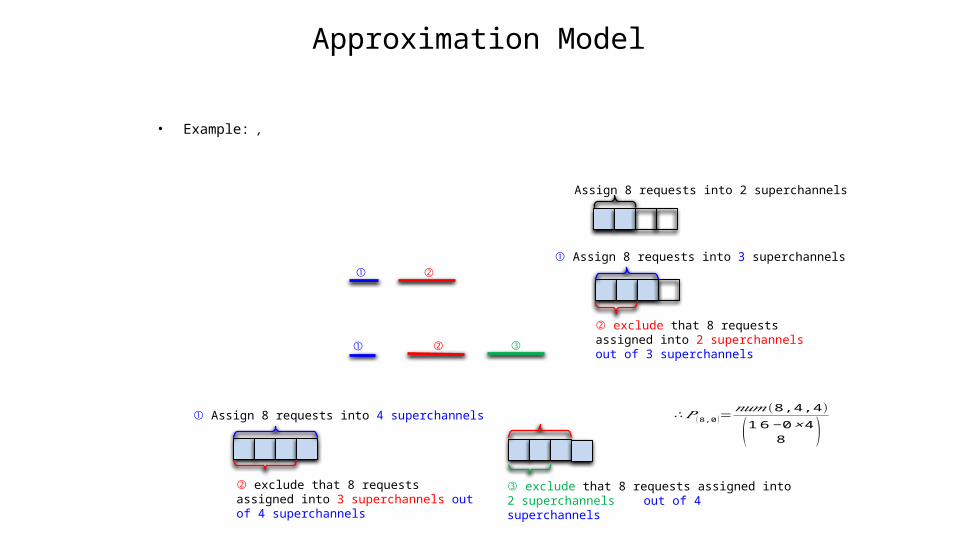
• Example: , Assign 8 requests into 2 superchannels
① ②① Assign 8 requests into 3 superchannels
② exclude that 8 requests assigned into 2 superchannels out of 3 superchannels
① Assign 8 requests into 4 superchannels
② exclude that 8 requests assigned into 3 superchannels out of 4 superchannels
③ exclude that 8 requests assigned into 2 superchannels out of 4 superchannels
① ② ③
∴𝑃 ( 8,0 )=𝑛𝑢𝑚(8,4,4)
(1 6 − 0 × 48 )
Numerical Results
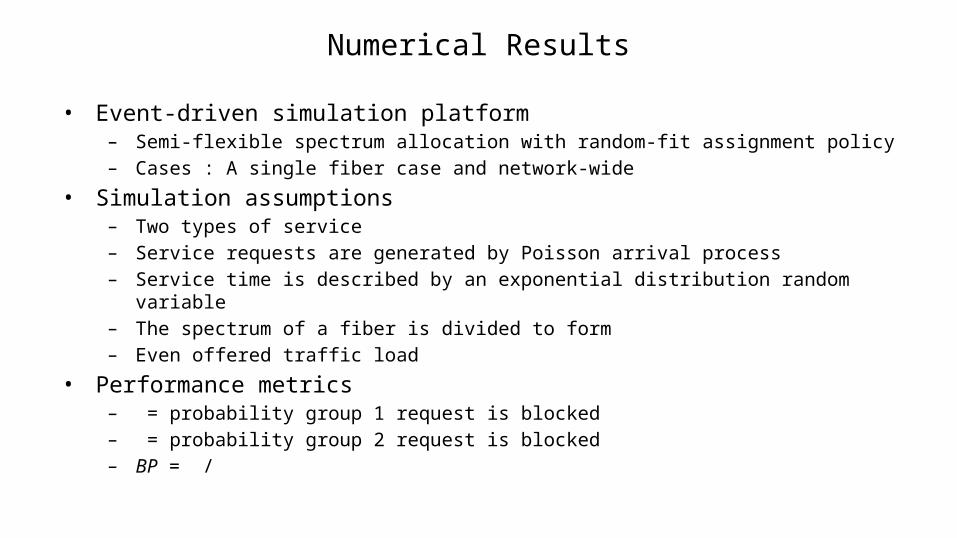
• Event-driven simulation platform– Semi-flexible spectrum allocation with random-fit assignment policy– Cases : A single fiber case and network-wide
• Simulation assumptions– Two types of service– Service requests are generated by Poisson arrival process– Service time is described by an exponential distribution random variable– The spectrum of a fiber is divided to form – Even offered traffic load
• Performance metrics– = probability group 1 request is blocked– = probability group 2 request is blocked– BP = /
28
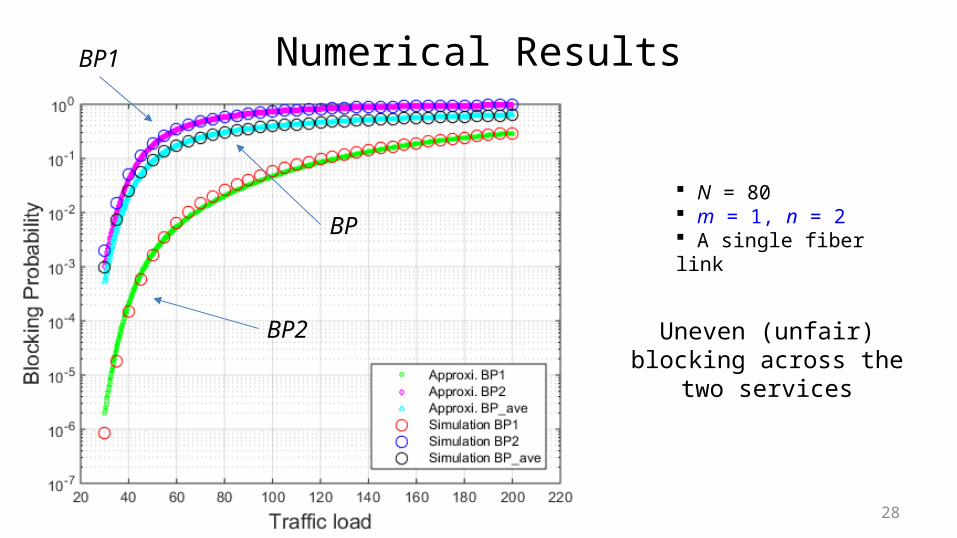
Numerical Results
N = 80 m = 1, n = 2 A single fiber link
Uneven (unfair) blocking across the two services
BP1
BP2
BP

29
Numerical Results
N = 80 m = 1, n = 4 A single fiber link
Blocking unfairness is exacerbated across the two
services
30
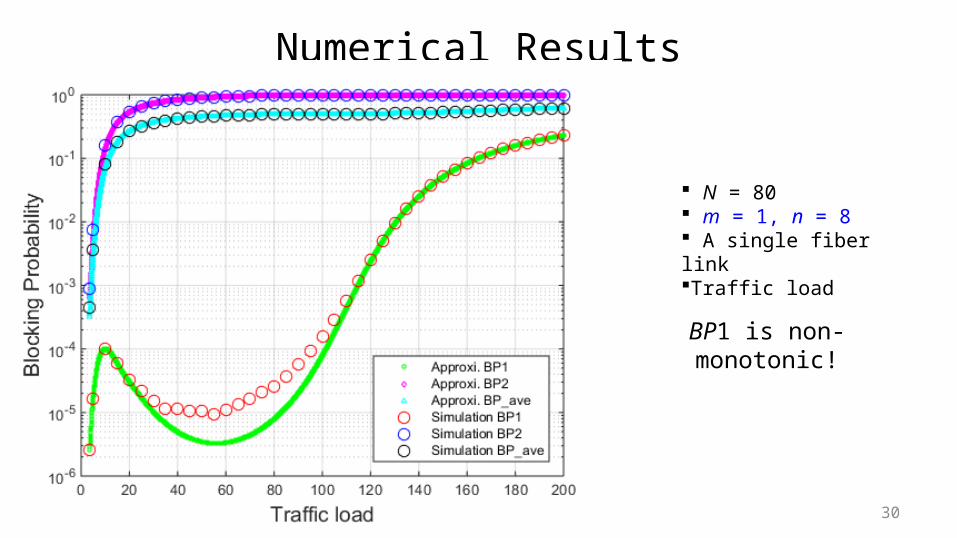
Numerical Results
N = 80 m = 1, n = 8 A single fiber linkTraffic load
BP1 is non-monotonic!

31
Accurate Model

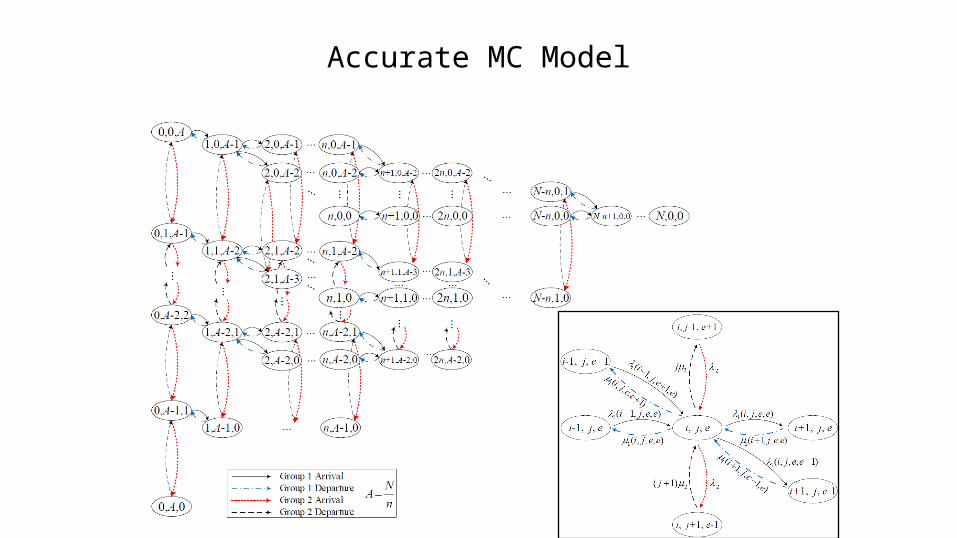
Accurate MC Model
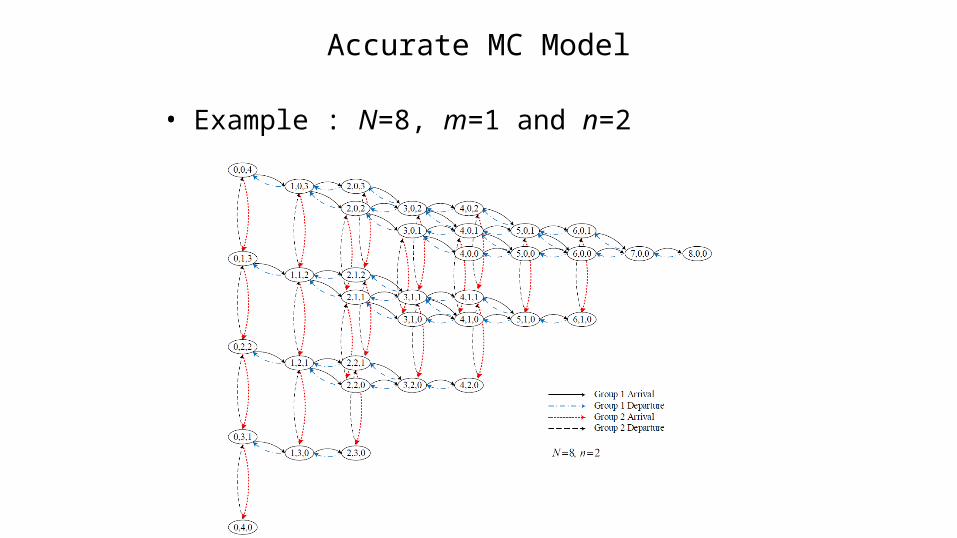
• A continuous time MC in a single fiber link– A state is represented by a super-state (i, j, e)
• i : The number of group 1 requests • j : The number of group 2 requests • e : The number of available superchannels
– The MC states are subject to
– Example : N=8, m=1 and n=2
1,1,2: Group 1 request: Group 2 request
# of group 1 requests (i) = 1# of available superchannels (e) = 2
# of group 2 requests (j) = 1
Accurate MC Model

Accurate MC Model
• Example : N=8, m=1 and n=20,0,4
1,0,3 2,0,3
2,0,2
0,1,3
1,1,2
2,1,1
2,1,2
0,0,4
1,0,3
2,0,3 2,0,2
1,1,2
: Group 1 request: Group 2 request
𝜆1
17𝜆1 6
7𝜆1
𝜆2𝜇2
2𝜇1 2𝜇1
𝜇1
Accurate MC Model
• Example : N=8, m=1 and n=2
Accurate MC Model
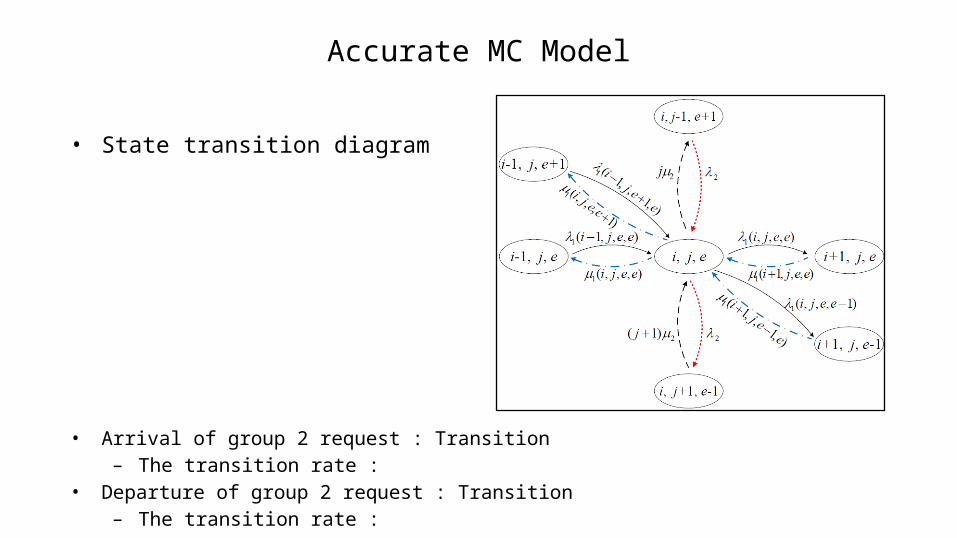
• State transition diagram
• Arrival of group 2 request : Transition – The transition rate :
• Departure of group 2 request : Transition – The transition rate :
Accurate MC Model
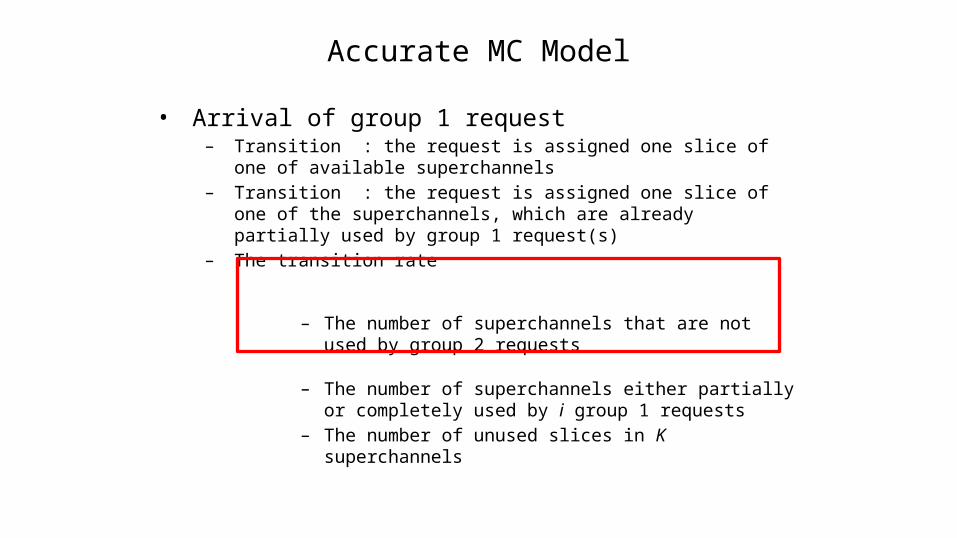
• Arrival of group 1 request– Transition : the request is assigned one slice of one of available
superchannels– Transition : the request is assigned one slice of one of the superchannels,
which are already partially used by group 1 request(s)– The transition rate
– The number of superchannels that are not used by group 2 requests
– The number of superchannels either partially or completely used by i group 1 requests
– The number of unused slices in K superchannels

Accurate MC Model
• Departure of group 1 request– If , transition : a departure will always free one superchannel
• The transition rate : – If , transition : a departure will never free a superchannel
• The transition rate : – If , transition : a departure may or may not free a superchannel
• The transition rate

Numerical Results
• Event-driven simulation platform– Semi-flexible spectrum allocation with random-fit assignment policy– Cases : A single fiber case and network-wide
• Simulation assumptions– Two types of service– Service requests are generated by Poisson arrival process– Service time is described by an exponential distribution random variable– The spectrum of a fiber is divided to form – Even offered traffic load
• Performance metrics– = probability group 1 request is blocked– = probability group 2 request is blocked– BP = /
40
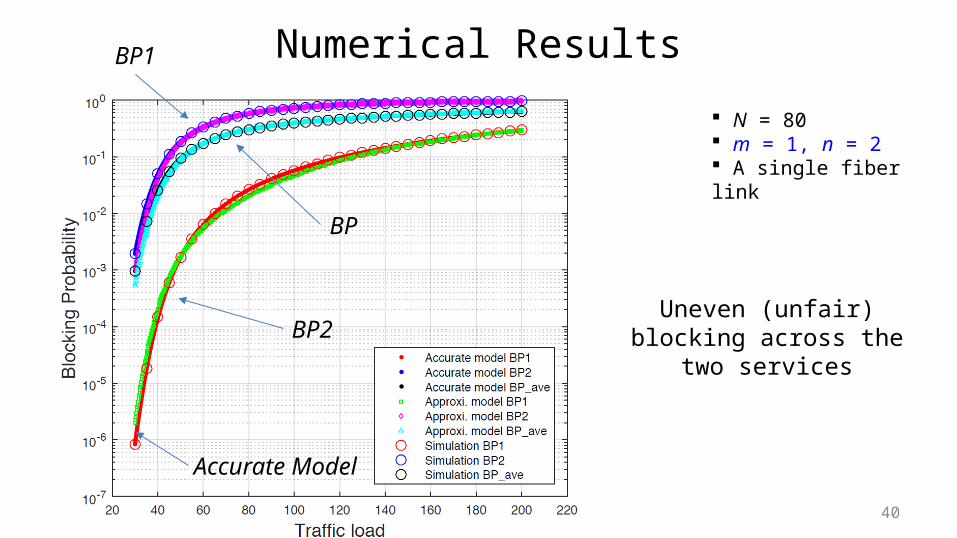
Numerical Results
N = 80 m = 1, n = 2 A single fiber link
Uneven (unfair) blocking across the two services
BP1
BP2
BP
Accurate Model
41
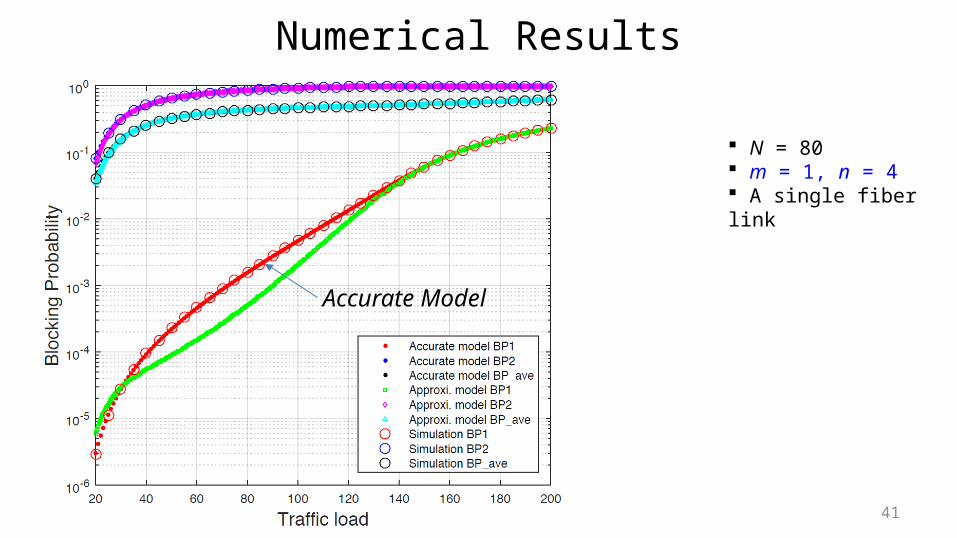
Numerical Results
N = 80 m = 1, n = 4 A single fiber link
Accurate Model
42
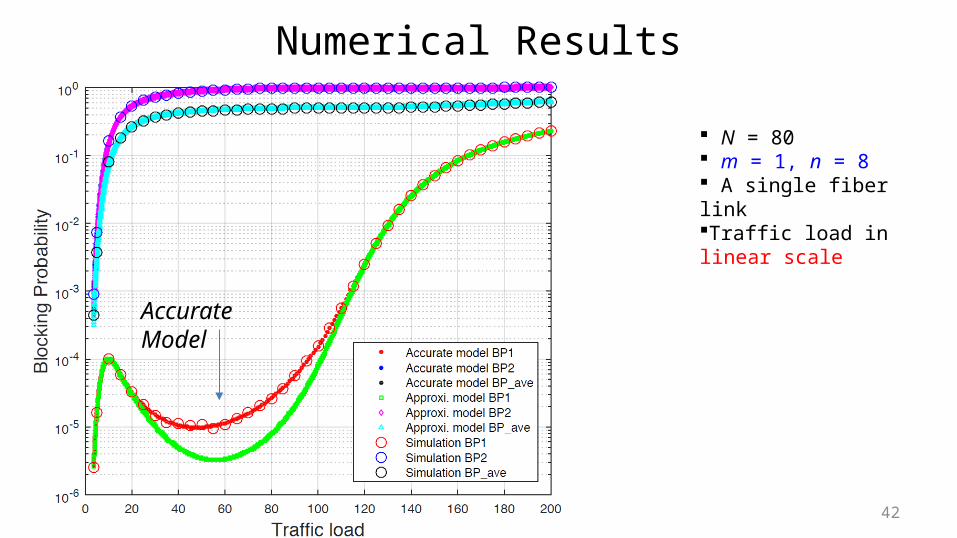
Numerical Results
N = 80 m = 1, n = 8 A single fiber linkTraffic load in linear scale
Accurate Model
43
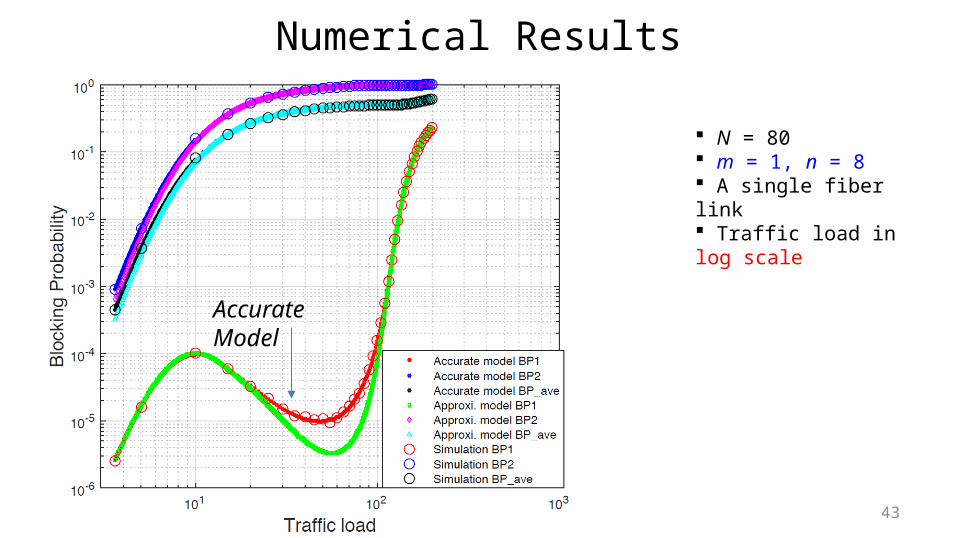
Numerical Results
N = 80 m = 1, n = 8 A single fiber link Traffic load in log scale
Accurate Model
44
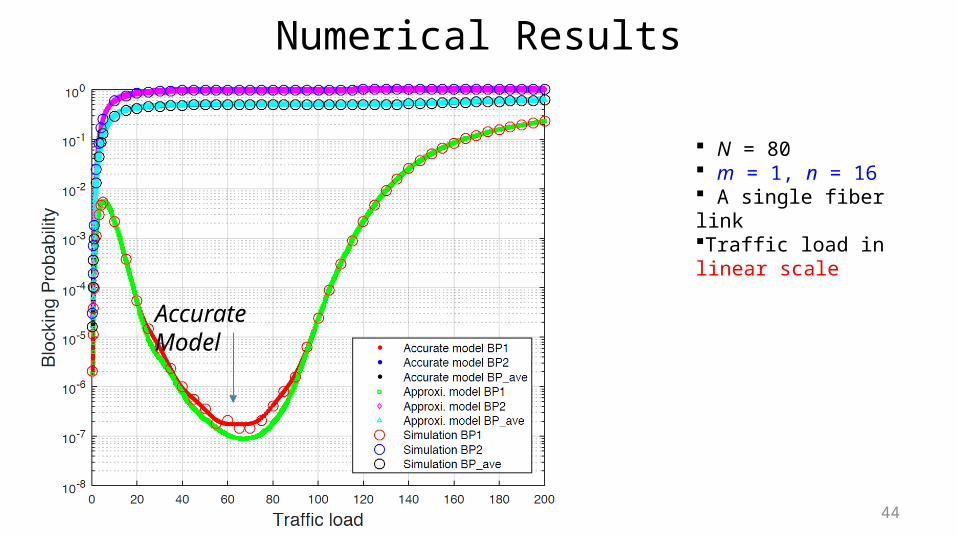
Numerical Results
N = 80 m = 1, n = 16 A single fiber linkTraffic load in linear scale
Accurate Model
45
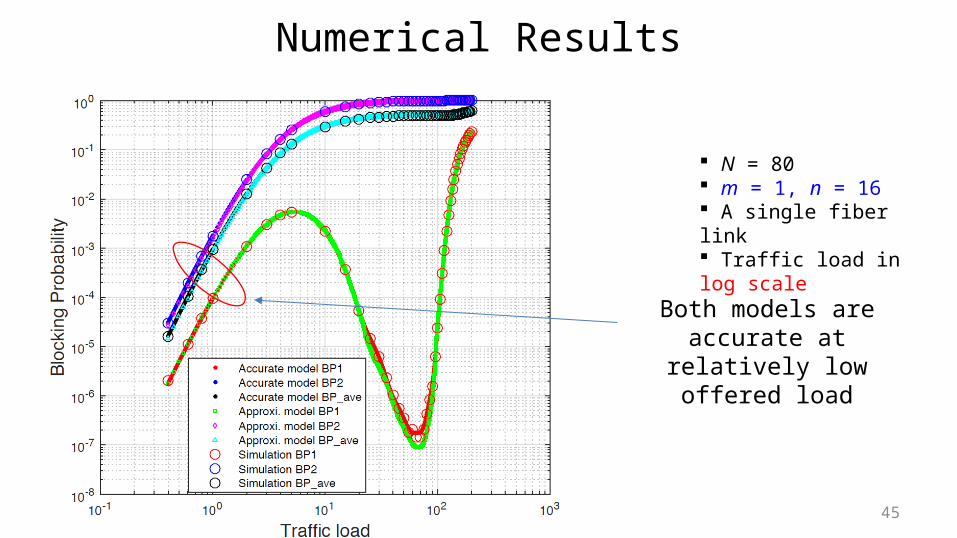
Numerical Results
N = 80 m = 1, n = 16 A single fiber link Traffic load in log scale
Both models are accurate at relatively low offered load
46
Model Complexity

Approximation model
Accurate model
𝑆 (𝑁 ,𝑛 )=∑𝑡=1
𝑁𝑛
+1
𝑡2(2+(𝑡−1)(𝑛−1))
𝑆 (𝑁 ,𝑛 )=12(𝑁+2)(
𝑁𝑛
+1)
→𝑂 (𝑁3
𝑛2 )
→𝑂 (𝑁2
𝑛)
• N = 80, m = 1
Complexity = Number of States in MC
Numerical Results (Network-Wide)
• Simulation assumptions (network-wide study)– NSF topology with 14 nodes and 21 links– Each link has two unidirectional fibers (one per direction)– 5 shortest paths are computed using hop-count as metric– Used RSA algorithms
• Semi-flexible algorithm (Semiflex) [1]• K Shortest Path with First-Fit policy (KSP_FF) [2]
[1] Zhi-shu Shen, Hiroshi Hasegawa, Ken-ichi Sato, Takafumi Tanaka, and Akira Hirano, “A Novel Semi-flexible Grid Optical Path Network That Utilizes Aligned Frequency Slot Arrangement”, ECOC 2013[2] S. Shirazipourazad, Z. Derakhshandeh, and A. Sen, “Analysis of on-line routing and spectrum allocation in spectrum-sliced optical networks,” in Communications (ICC), 2013 IEEE International Conference on, June 2013, pp. 3899-3903

49
Numerical Results
Semiflex KSP_FF
• Network case– NSF topology, N=80, m=1, n=8
50
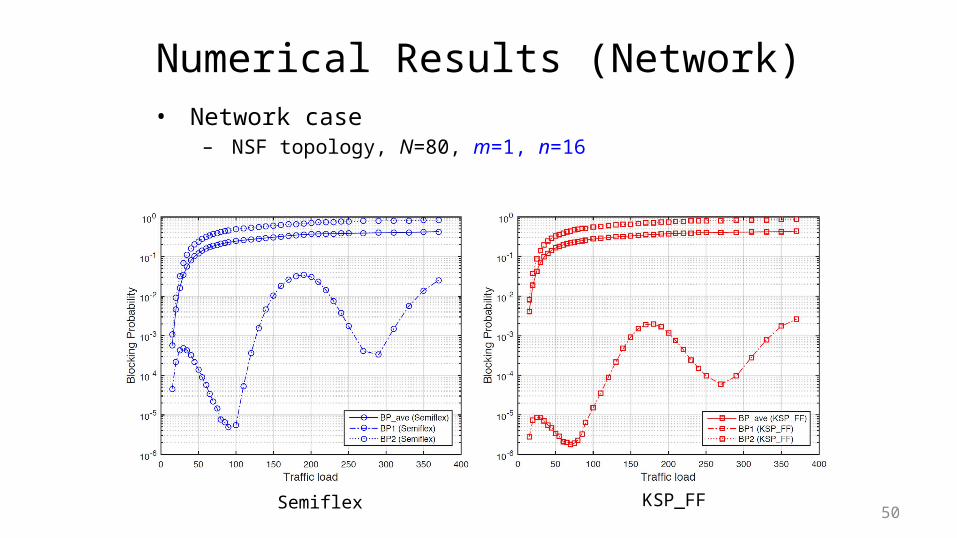
Numerical Results (Network)
Semiflex KSP_FF
• Network case– NSF topology, N=80, m=1, n=16
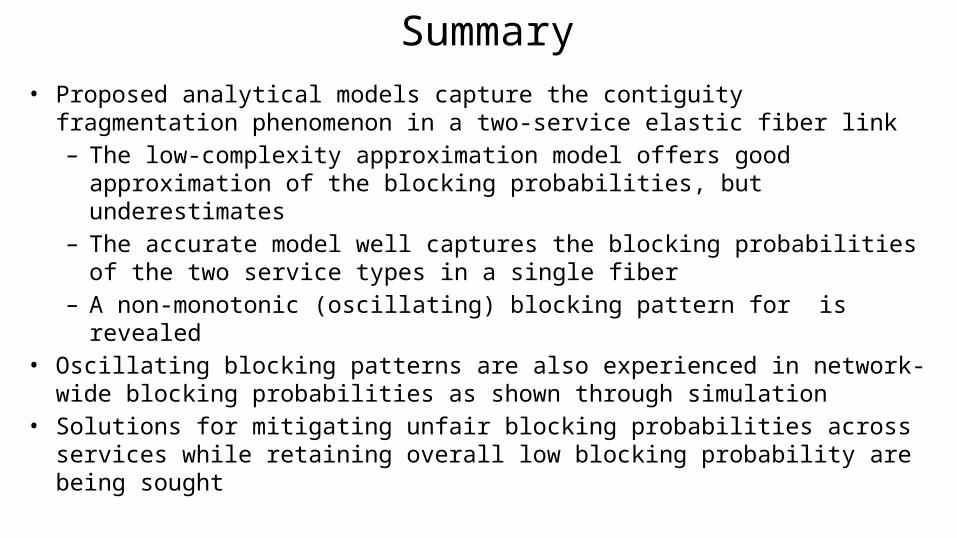
Summary• Proposed analytical models capture the contiguity fragmentation
phenomenon in a two-service elastic fiber link– The low-complexity approximation model offers good approximation
of the blocking probabilities, but underestimates – The accurate model well captures the blocking probabilities of the
two service types in a single fiber– A non-monotonic (oscillating) blocking pattern for is revealed
• Oscillating blocking patterns are also experienced in network-wide blocking probabilities as shown through simulation
• Solutions for mitigating unfair blocking probabilities across services while retaining overall low blocking probability are being sought
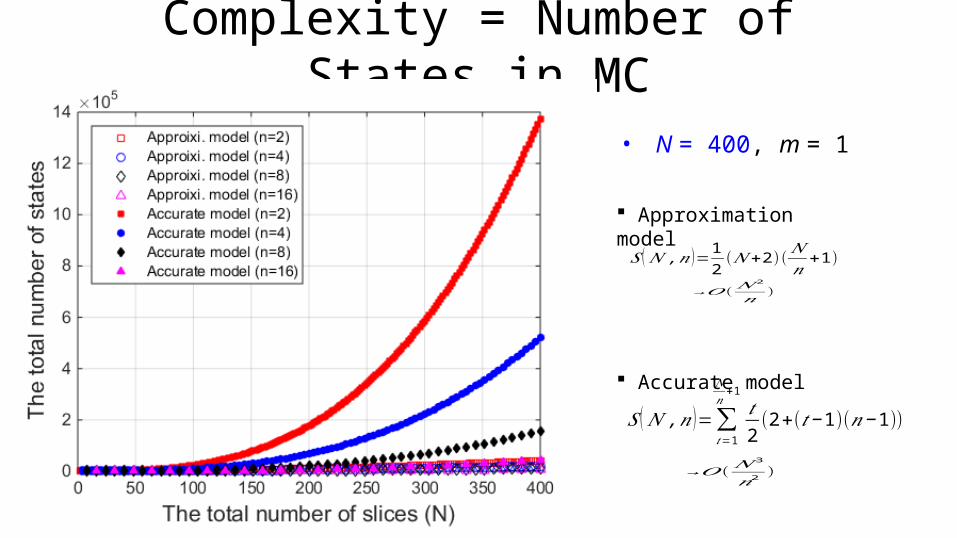
Complexity = Number of States in MC
Approximation model
Accurate model
𝑆 (𝑁 ,𝑛 )=∑𝑡=1
𝑁𝑛
+1
𝑡2(2+(𝑡−1)(𝑛−1))
𝑆 (𝑁 ,𝑛 )=12(𝑁+2)(
𝑁𝑛
+1)
→𝑂 (𝑁3
𝑛2 )
→𝑂 (𝑁2
𝑛)
• N = 400, m = 1