Embed Size (px)
Citation preview
Broadband spillovers andBroadband spillovers and investment
FTTH Council EuropeLisbon25 Feb 2010
Taylor REYNOLDS
The views expressed in this presentation are those of the author anddo not necessarily reflect the opinions of the OECD or its Membership.

Pandemic: Schools closedPandemic: Schools closed
Photo: http://a5.vox.com/6a0109811381e6000c0110163e514d860c-500pi

French responseFrench response• 620 hours of recorded courses• 620 hours of recorded courses
– 9 subjects– 90 days worth of material90 days worth of material
• TV Channels: – France 5– France Culture
• Not available on web b f l k fbecause of a lack of universal broadband

What if everyone had broadband?
• Video of all class subjects jdistributed via peer-to-peer
• Lessons multi-casted from local teachers to local students
• Chat/Voice/Video interaction
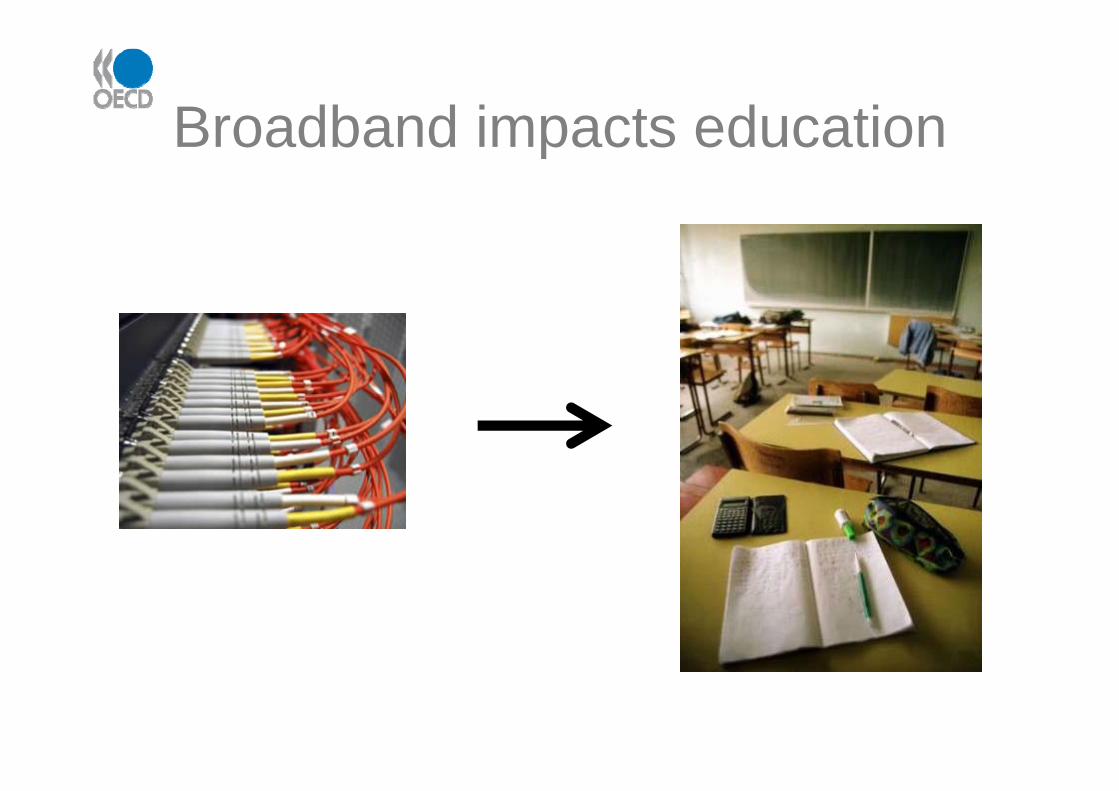
Broadband impacts educationBroadband impacts education
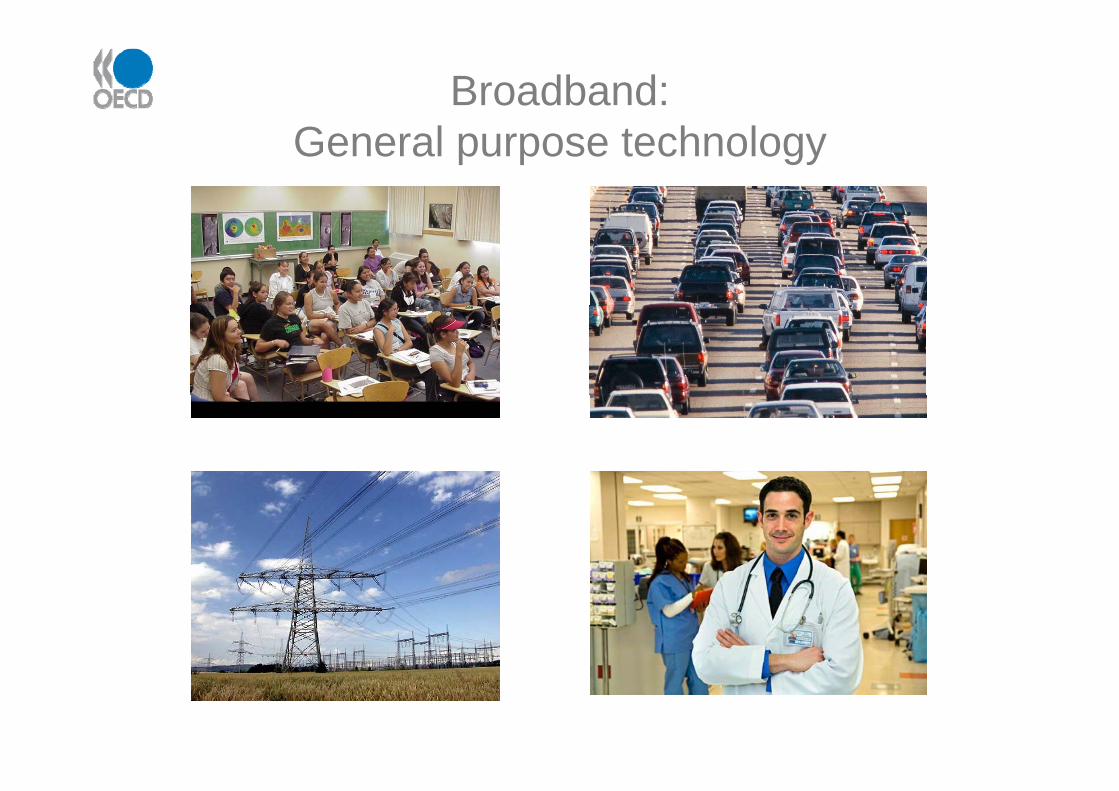
Broadband:G l h lGeneral purpose technology

So why fibre?So why fibre?

Looking ahead 50 years isyears is difficultdifficult
Feb 1950Feb 1950Popular Mechanics

Electricity growth surprised usElectricity growth surprised usAverage US Residential Electricity Consumption by Category, kWh/customer
9 000
10 000Television
Diswashers
7 000
8 000 Drying
Freezers
Air conditioning
4 000
5 000
6 000Lighting
Water heat
f d
2 000
3 000
4 000 Refridgeration
Other
Cooking
1 000
2 000
Space heat
1950 1960 1970 1980

New electronic devices introduced after 1980
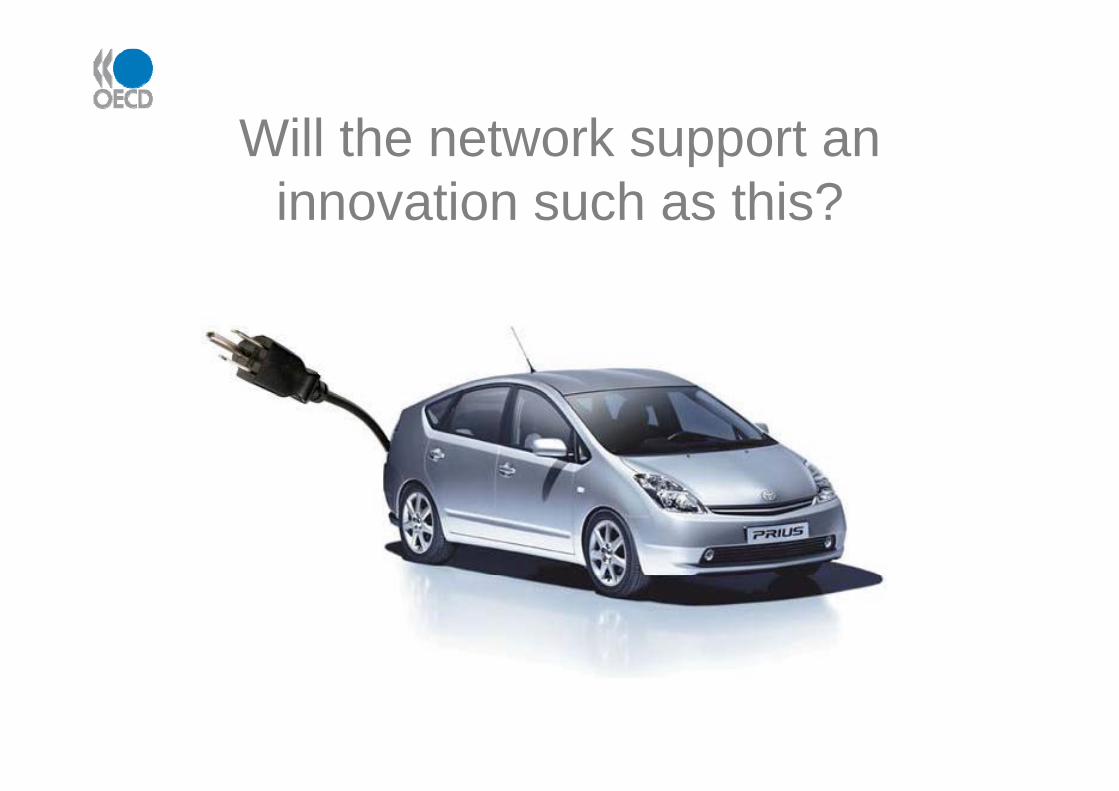
Will th t k tWill the network support an innovation such as this?innovation such as this?

We can’t predict the future so we need a “future-proof” platform

Upload bottlenecksUpload bottlenecksAverage advertised upload speeds by platform in OECD countries
Mbit/s, Oct 200949.7
1.4 2.2
DSL Cable FTTH

How will we get fibre?How will we get fibre?
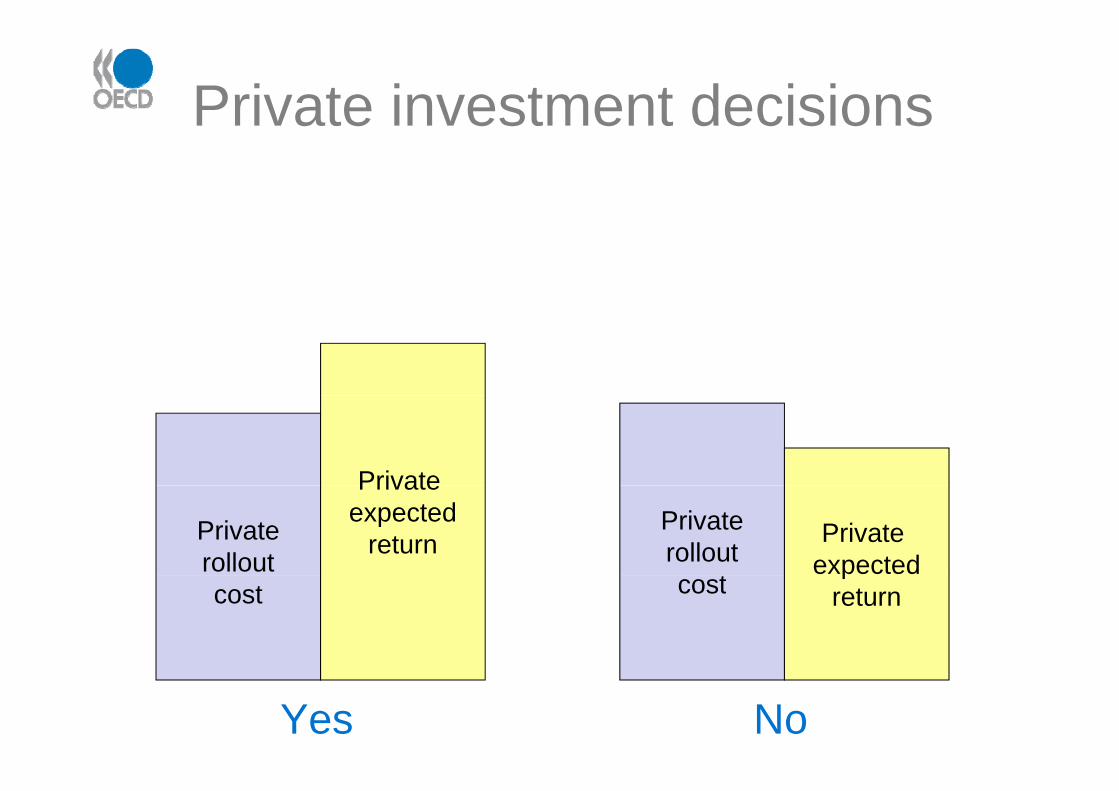
Private investment decisionsa e es e dec s o s
Private
Privaterollout
Private expected
returnPrivaterollout
t
Private expected
cost costp
return
Yes No

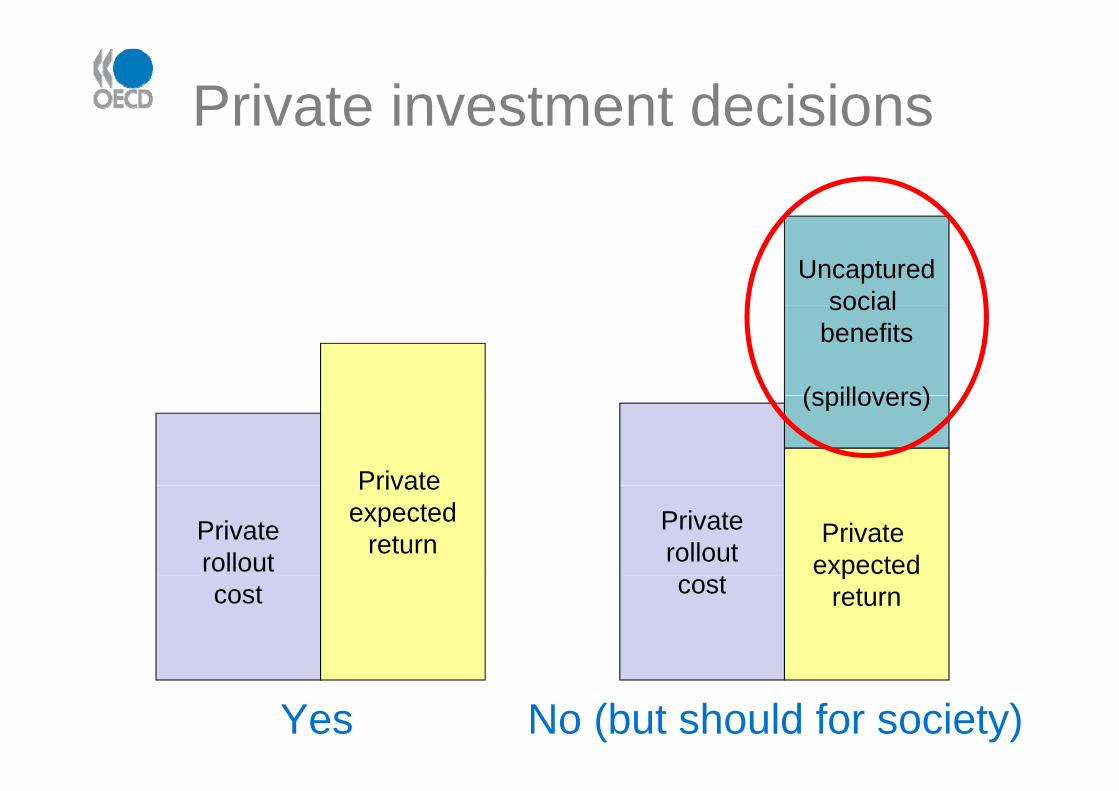
Private investment decisionsa e es e dec s o s
Uncapturedsocialsocial
benefits
(spillovers)
Private
(spillovers)
Privaterollout
Private expected
returnPrivaterollout
t
Private expected
cost costp
return
Yes No (but should for society)
Private investment decisionsa e es e dec s o s
Uncapturedsocialsocial
benefits
(spillovers)
Private
(spillovers)
Privaterollout
Private expected
returnPrivaterollout
t
Private expected
cost costp
return
Yes No (but should for society)

What amount of spillovers could justify a national FTTH network?
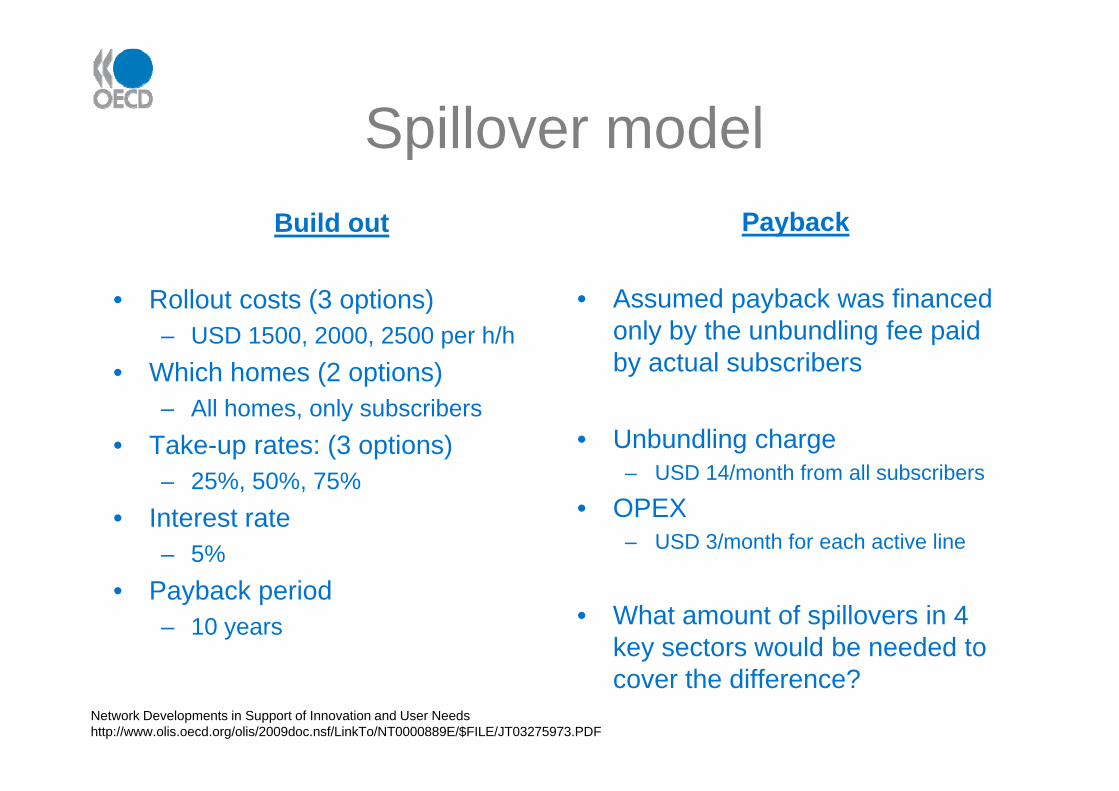
Spillover modelSpillover modelB ild t P b kBuild out
• Rollout costs (3 options)
Payback
• Assumed payback was financedRollout costs (3 options)– USD 1500, 2000, 2500 per h/h
• Which homes (2 options)
Assumed payback was financed only by the unbundling fee paid by actual subscribers
– All homes, only subscribers• Take-up rates: (3 options)
– 25% 50% 75%
• Unbundling charge – USD 14/month from all subscribers25%, 50%, 75%
• Interest rate – 5%
• OPEX– USD 3/month for each active line
• Payback period– 10 years • What amount of spillovers in 4
key sectors would be needed to cover the difference?
Network Developments in Support of Innovation and User Needshttp://www.olis.oecd.org/olis/2009doc.nsf/LinkTo/NT0000889E/$FILE/JT03275973.PDF

Electricity Transportation Education Health
0 5% 1 5%0.5% – 1.5%
On average, a cost savings of between 0.5% and 1.5% in each of the four t t lti di tl f th b db d t ksectors over ten years resulting directly from the new broadband network
platform could justify the cost of building a national point-to-point, fibre-to-the-home network.
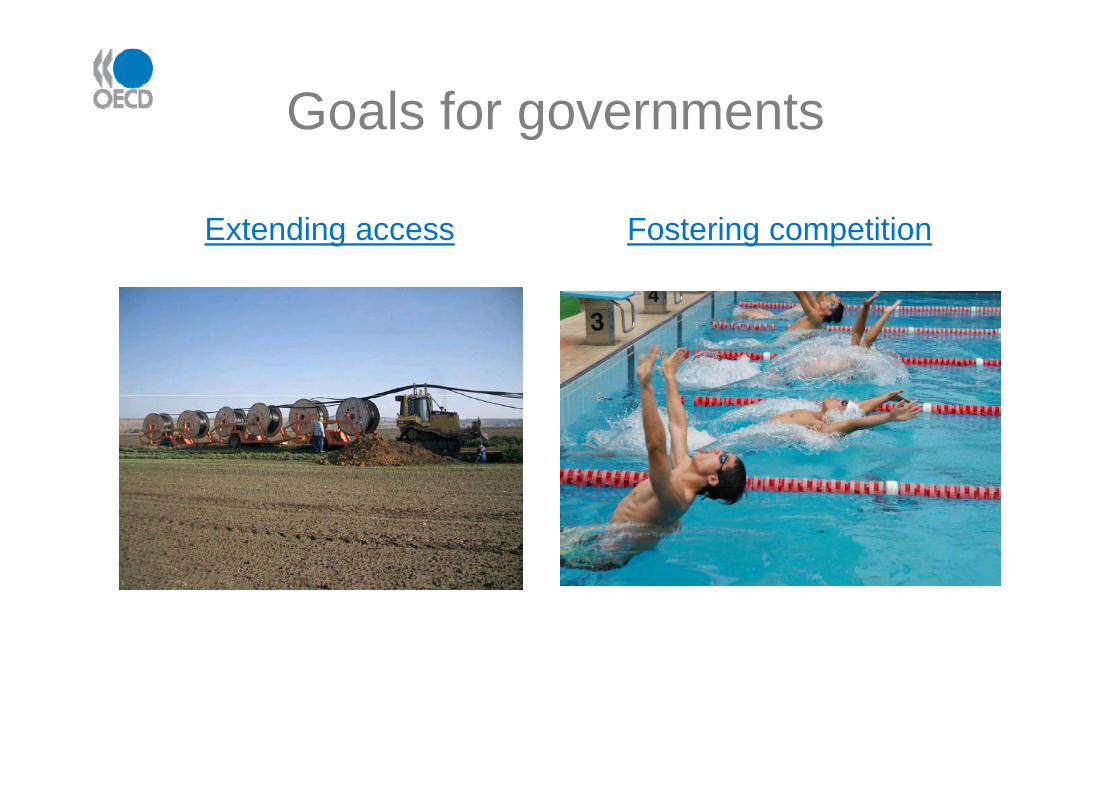
Goals for governmentsGoals for governments
Extending access Fostering competition

Open accessOpen access
• When the public pays for broadband investment they yshould expect to benefit from improved service and greater choice in the market.
• Networks built or augmented using public funds should offer access or capacity to all marketaccess or capacity to all market participants at cost-based, non-discriminatory termsdiscriminatory terms

ConclusionsConclusions• Spillovers matter• Private firms don’t consider them• Governments should
• New networks should be “forward looking” • Fibre is the foundation of future networks
• Any government investment in networks should help foster competition

Muito obrigado