Embed Size (px)
Citation preview
© 2017 Anaconda, Inc.
Taming the Python Data
Visualization Jungle
Peter Wang and James A. Bednar

© 2017 Anaconda, Inc.
Peter Wang
Chief Technical Officer,
Anaconda Inc.
James A. BednarSenior Solutions Architect,
Anaconda, Inc.
Your Speakers For Today

© 2017 Anaconda, Inc. 3
Good news:
Lots of
choices!
(Adapted from
Jake VanderPlas)

© 2017 Anaconda, Inc. 4
Bad news:
Lots of
choices!
• No way to
learn or even
try them all
• None solve
everything
• Few work well
together

© 2017 Anaconda, Inc. 5
Let’s make
sense of
this corner
of the
jungle:
a few well-
supported
tools that
cover most
workflows

© 2017 Anaconda, Inc.
Workflows we’ll discuss
1. Data exploration Learning from data
2. Report generation Sharing figures
3. Dashboards Deploying interactive apps
… most of what people use visualization for!
© 2017 Anaconda, Inc.
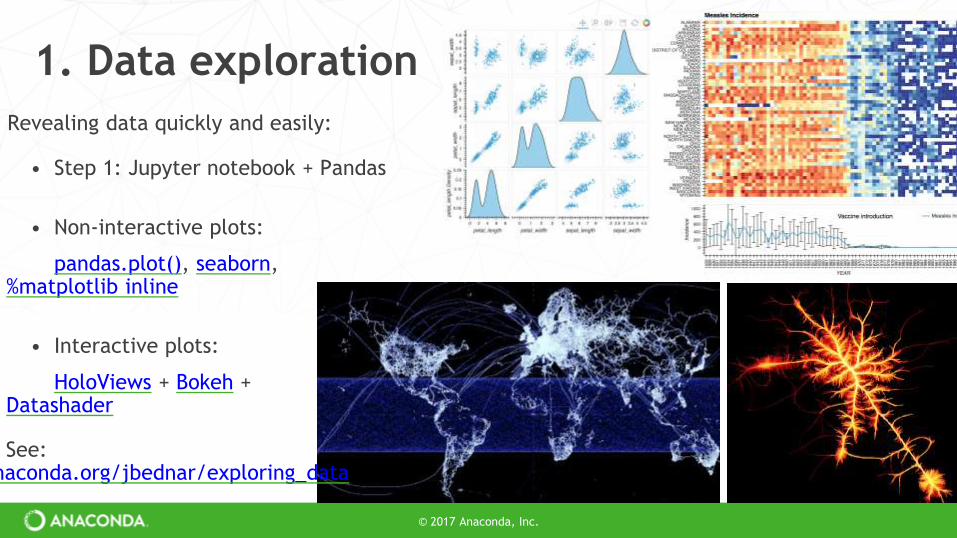
1. Data exploration
Revealing data quickly and easily:
• Step 1: Jupyter notebook + Pandas
• Non-interactive plots:
pandas.plot(), seaborn, %matplotlib inline
• Interactive plots:
HoloViews + Bokeh + Datashader
See: anaconda.org/jbednar/exploring_data

© 2017 Anaconda, Inc.
2. Report generationAfter uncovering meaningful patterns or features in a dataset, a typical next step
is to share your results in a report, publication, presentation, blog post, or web page. See: anaconda.org/jbednar/reporting

© 2017 Anaconda, Inc.
3. Dashboards
• Very often, exploration leads to a way of analyzing data, not a fixed set of plots.
• E.g. — these variables are important, this way of looking at the data is useful.
• Need to be able to build apps and dashboards to make it simpler to explore data, both for the original author and for others not using Python
See: https://github.com/pyviz/pyviz

© 2017 Anaconda, Inc.
Dashboard deployment
• Deploying visualizations is time-
consuming and difficult
• Anaconda Enterprise makes
deployment fast and easy
• With just one click you can
deploy a secure, scalable
visualization accessible by any
authorized person in your
organization

© 2017 Anaconda, Inc.
Summary
• Python has a rich and powerful visualization ecosystem
• There are now incredibly rich and easy to use tools for exploring data
• It’s simple to use use your results in reports and presentations
• You can even build powerful apps and dashboards without much additional
work
• It’s good practice to try out some unfamiliar tools well suited for your tasks
• It’s not as hard to get started as you might think!https://github.com/pyviz/pyviz
© 2017 Anaconda, Inc.
Next Steps
Download Anaconda Distributionwww.anaconda.com/download
Sign up for Anaconda Enterprise Trialgo.anaconda.com/test-drive-anaconda-enterprise-5
Contact Sales+1- (512) 776-1066 | [email protected]