Embed Size (px)
Citation preview
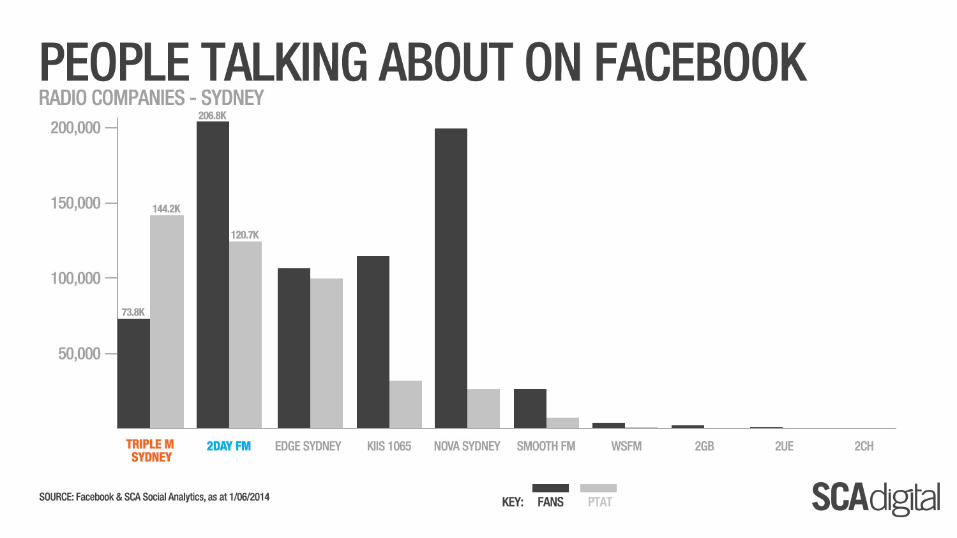
SYDNEY
statistics sourced from:
SYDNEY
SCA DIGITAL – MAY RATINGS INDEX
Slide 3 SCA Network Monthly Unique Browsers - NSW Slide 4 Today Network Monthly Users - NSW Slide 5 Triple M Network Monthly Users - NSW Slide 6 Sydney Radio Groups Ranked by Avg. Daily UB - NSW Slide 7 Mobile Share of Daily Radio Browsing – Today Network & Triple M Network – NSW Slide 8 People Talking About On Facebook – Radio Companies – Sydney
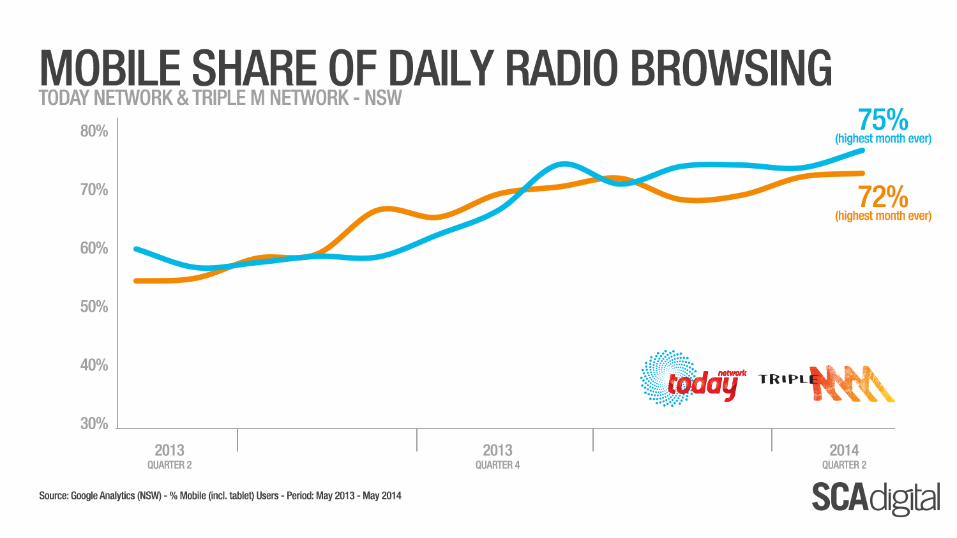
SYDNEY

Source: Nielsen Market Intelligence (NSW) – May 2013 – May 2014 – SCA Network – National
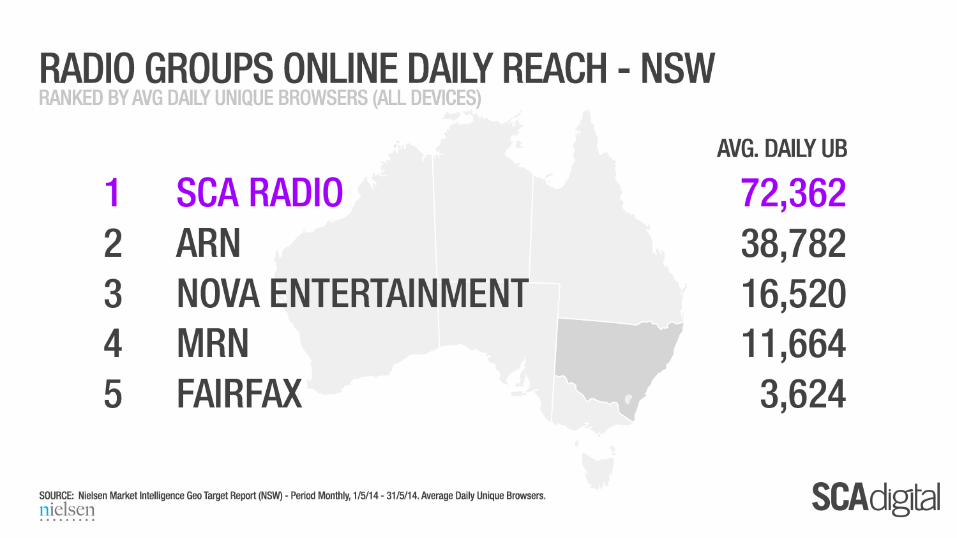
SCA Network traffic in NSW increased 32% year on year in Average Daily Unique Browsers to 72,362 – Highest Ever ! Driven by Shows, Social, Sport, Celebrity and Mobile Browsers.
SO THIS HAPPENED…
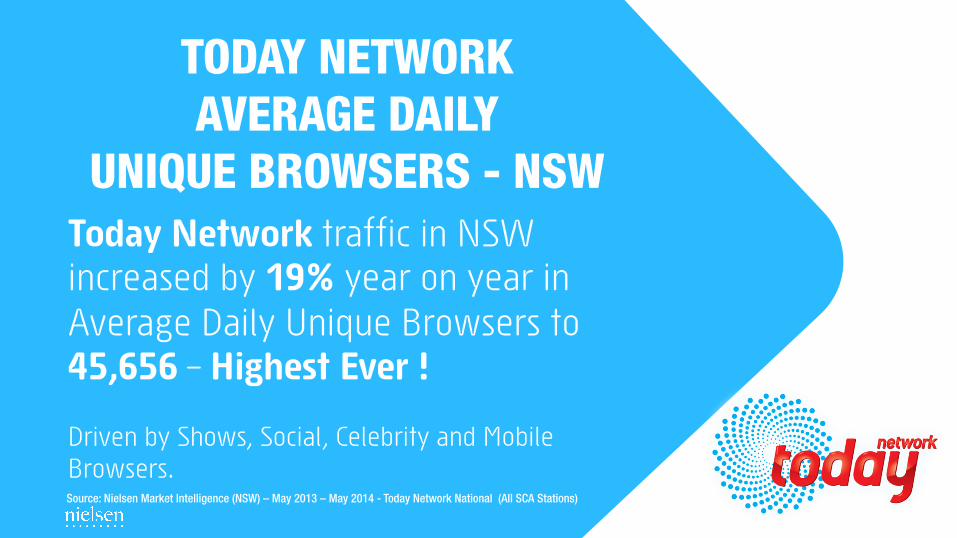
Source: Nielsen Market Intelligence (NSW) – May 2013 – May 2014 - Today Network National (All SCA Stations)
Today Network traffic in NSW increased by 19% year on year in Average Daily Unique Browsers to 45,656 – Highest Ever ! Driven by Shows, Social, Celebrity and Mobile Browsers.
TODAY NETWORK AVERAGE DAILY
UNIQUE BROWSERS - NSW
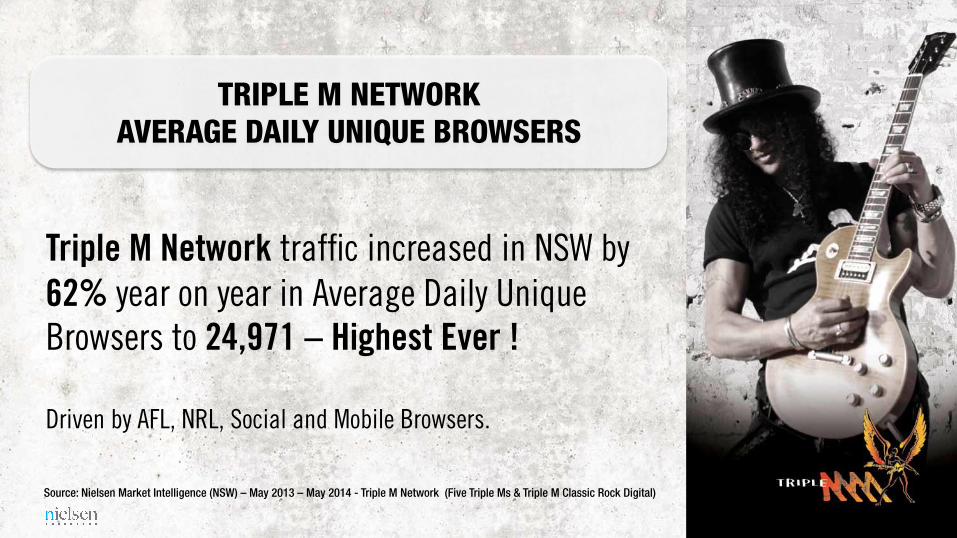
Triple M Network traffic increased in NSW by 62% year on year in Average Daily Unique Browsers to 24,971 – Highest Ever ! Driven by AFL, NRL, Social and Mobile Browsers. Source: Nielsen Market Intelligence (NSW) – May 2013 – May 2014 - Triple M Network (Five Triple Ms & Triple M Classic Rock Digital)
TRIPLE M NETWORK AVERAGE DAILY UNIQUE BROWSERS
Southern Cross Austereo (SCA) each month reports Australian digital ratings. Data sourced from Nielsen Market Intelligence (Domestic) and Nielsen Answers has been used wherever possible. SCA also reports ‘Brands’ as collated and approved by Nielsen and not ‘Ad Networks’, which are synthetically created by publishers for commercial scale purposes. The Social data is collated using the public terms of the respective network public APIs and terms of service. The Social Data is not currently domestic. This will be amended if and when possible. Publication of this data is intended for personal use and should be seen as a reflection of business performance or forward looking statements that are always given to the market and shareholders first. Any comments in regards to this data or any claims of misreprestation should be addressed to [email protected]
statistics sourced from: