Embed Size (px)
Citation preview
PIVOTAL NY – BIG DATA & ANALYTICS MEETUP
SQL and Machine Learning on HDFS using HAWQ
Prasad Radhakrishnan Amey Banarse Josh Plotkin April 7th, 2015
Pivotal Labs, New York

Pivotal NY – Big Data & Analytics Meetup
Hadoop-HDFS vs
MPP Databases
Pivotal NY – Big Data & Analytics Meetup
Quick overview of Hadoop-HDFS
¨ Hadoop is a Framework to store and process large volumes of data.
¨ HDFS is a fault-tolerant file system: ¤ Assumes that Hardware will fail ¤ Combines cluster’s local storage into a single namespace. ¤ All data is replicated to multiple machines and Infinitely (read
highly) Scalable.
¨ A classic Master-Slave Architecture.

Pivotal NY – Big Data & Analytics Meetup
Hadoop & HDFS Architecture – Simplistic View �
Zookeeper, Yarn Resource Manager
Node 3
…Data Node
Zookeeper, Yarn Resource Manager
Node 4
Data Node
Zookeeper, Yarn Resource Manager
Node N
Data Node
NameNode
Node 1 Quorum Journal
Manager
Zoo Keeper, YARN
Secondary NameNode
Node 2 Quorum Journal
Manager
Zoo Keeper, YARN
Pivotal NY – Big Data & Analytics Meetup
Hadoop – HDFS: 2 sides of the same coin
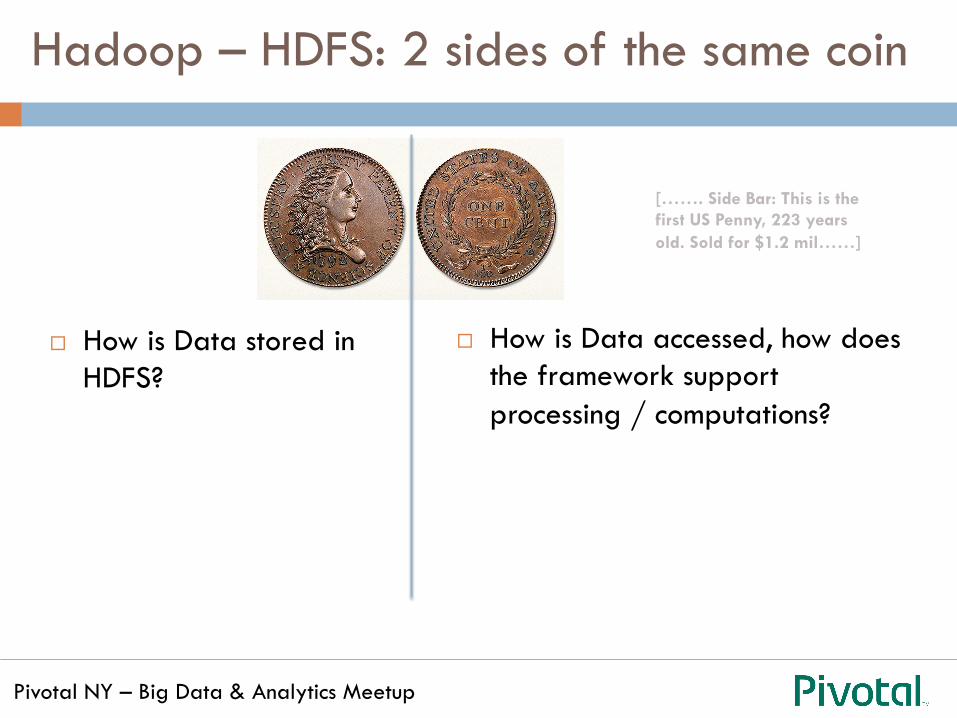
[……. Side Bar: This is the first US Penny, 223 years old. Sold for $1.2 mil……]
¨ How is Data stored in HDFS?
¨ How is Data accessed, how does the framework support processing / computations?

Pivotal NY – Big Data & Analytics Meetup
¨ Everything is a File. ¨ A File is broken into small blocks. ¨ Stores multiple copies of each
block. ¨ If a node goes down, there are
other nodes that can provide the missing blocks.
¨ Schema-less, it’s a distributed FS that will accept any kind of data (Structured, un/semi-Structured).
Hadoop – HDFS: Storage side

Pivotal NY – Big Data & Analytics Meetup
¨ Map-Reduce is the most popular processing framework for access and computational needs.
¨ MR is slow. Suited for batch work loads and to process un/semi-structured data.
¨ SQL support is minimal and not matured.
Hadoop – HDFS: Processing side
Pivotal NY – Big Data & Analytics Meetup
Quick overview of MPP Databases
¨ MPPs predate Hadoop-HDFS. ¨ Most MPPs have a Master-Slave design and a shared-
nothing Architecture ¨ A very few software based MPPs, most run on custom
h/w. ¨ They are known for their sheer horse power to process
and compute big data work loads.
Pivotal NY – Big Data & Analytics Meetup
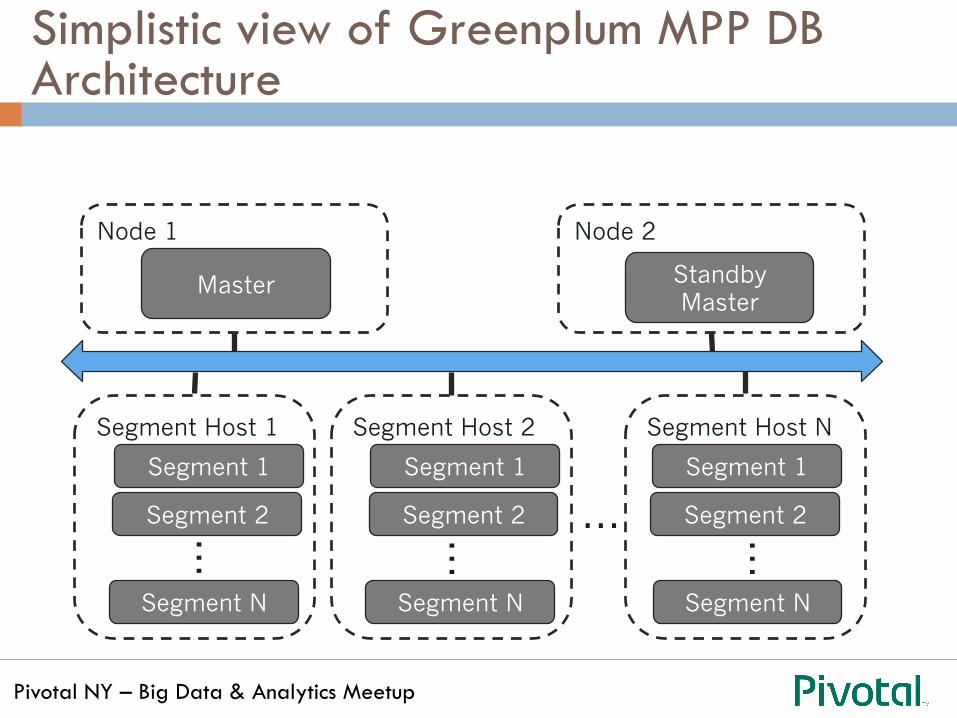
Simplistic view of Greenplum MPP DB Architecture
Master
Segment 1
Segment 2
Segment N
Node 1
Standby Master
Node 2
Segment Host 1
Segment 1
Segment 2
Segment N
Segment Host 2
Segment N
Segment Host N
… … ……Segment 1
Segment 2

Pivotal NY – Big Data & Analytics Meetup
MPP Databases: 2 sides of the same coin
¨ How is Data stored in MPPs?
¨ How is Data accessed, how does the framework support processing / computations?
Pivotal NY – Big Data & Analytics Meetup
¨ MPPs too, have a distributed FS but only for a table’s data. Tables are database objects.
¨ A File needs to be loaded into a table, pre-knowledge of it’s schema is required.
¨ MPPs are fault-tolerant as well. They store redundant copies of data.
¨ Handling un/semi-structured data is not it’s sweet spot and could get very challenging.
MPP Databases: Storage side of things

Pivotal NY – Big Data & Analytics Meetup
¨ MPPs are SQL engines. ¨ Known for their horse power in
being able to handle & process big data work loads.
¨ Extensive/Full ANSI SQL support. ¨ Rich ETL and BI tools for easy dev
& consumption. ¨ Some MPPs like Greenplum support
Machine Learning use cases extensively.
MPP Databases: Processing side

Pivotal NY – Big Data & Analytics Meetup
The Winning Combination
¨ HDFS as the distributed FS.
¨ Schema-less, fault-tolerant.
¨ Huge Apache eco-system of tools/products.
¨ MPP SQL Engine for Data access, processing and ML work loads.
¨ Blend with and leverage BI and ETL tools
¨ Blend with Hadoop File formats and integrate with Apache HDFS tools/products.

Pivotal NY – Big Data & Analytics Meetup
HAWQ, the MPP SQL Engine for HDFS
¨ Derived from Greenplum MPP, shortening many years engineering efforts that will go into building an MPP from scratch.
¨ Stores data in HDFS using Parquet file format.
¨ Familiar SQL interface, 100% ANSI compliant.
¨ All kinds of joins, analytical functions etc.
¨ Doesn’t use MapReduce, no dependencies on Hive or Hive metastore.
¨ Way faster than MR, not even a valid comparison.
¨ Enables In-Database Machine Learning.

Pivotal NY – Big Data & Analytics Meetup
Pivotal HAWQ Architecture
HAWQ Master
HAWQ Segment(s)
Node 1
HAWQ Secondary Master
Node 2
Node 5
…
NameNode
Node 3
Secondary NameNode
Node 4 Quorum Journal Manager
Quorum Journal Manager
Zoo Keeper
Quorum Journal Manager
Data Node
HAWQ Segment(s)
Node 6
Data Node
HAWQ Segment(s)
Node N
Data Node
Zoo Keeper
Zoo Keeper
High speed Interconnect
Pivotal NY – Big Data & Analytics Meetup
Pivotal HAWQ Architecture
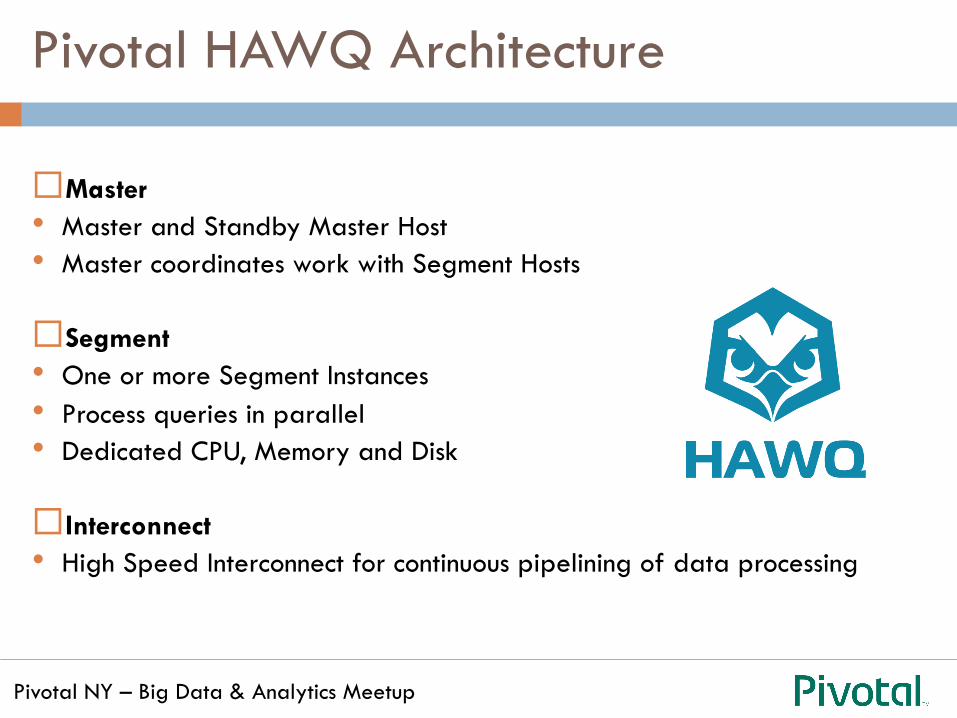
¨ Master • Master and Standby Master Host • Master coordinates work with Segment Hosts
¨ Segment • One or more Segment Instances • Process queries in parallel • Dedicated CPU, Memory and Disk
¨ Interconnect • High Speed Interconnect for continuous pipelining of data processing
Pivotal NY – Big Data & Analytics Meetup
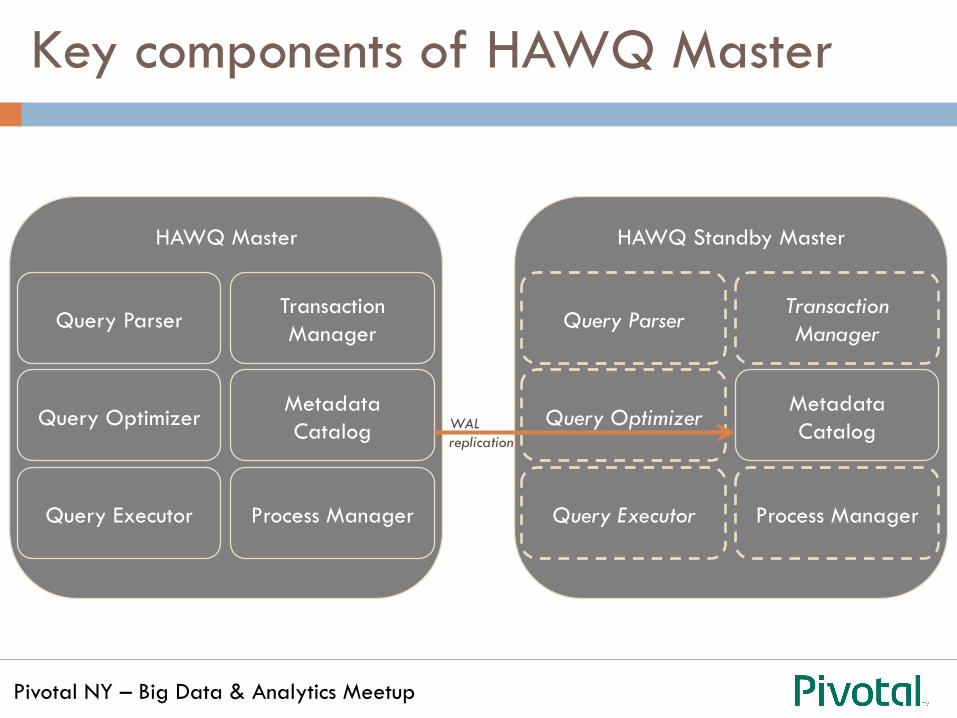
Key components of HAWQ Master
HAWQ Master
Query Parser
Query Optimizer
Query Executor
Transaction Manager
Process Manager
Metadata Catalog
HAWQ Standby Master
Query Parser
Query Optimizer
Query Executor
Transaction Manager
Process Manager
Metadata Catalog WAL
replication

Pivotal NY – Big Data & Analytics Meetup
Key components of HAWQ segments
HAWQ Segment HDFS Datanode
Segment Data Directory
Local Filesystem
Spill Data Directory
Query Executor
libhdfs3
PXF
Pivotal NY – Big Data & Analytics Meetup
What differentiates
HAWQ?
Pivotal NY – Big Data & Analytics Meetup
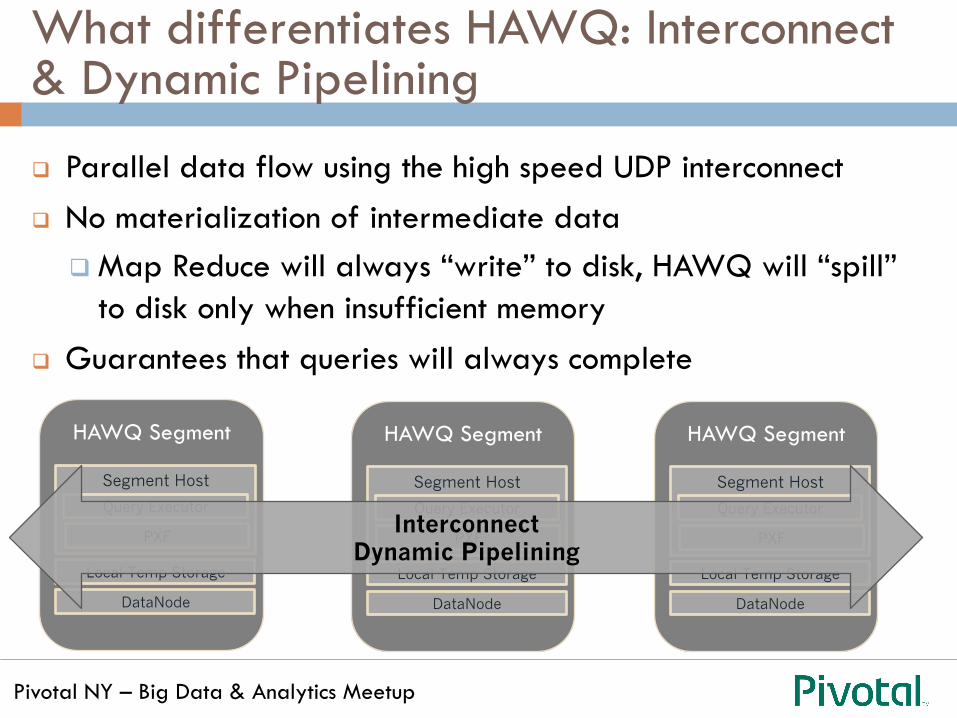
What differentiates HAWQ: Interconnect & Dynamic Pipelining
q Parallel data flow using the high speed UDP interconnect q No materialization of intermediate data
q Map Reduce will always “write” to disk, HAWQ will “spill” to disk only when insufficient memory
q Guarantees that queries will always complete
HAWQ Segment
PXF
Local Temp Storage
Segment Host
Query Executor
DataNode
PXF
HAWQ Segment
PXF
Local Temp Storage
Segment Host
Query Executor
DataNode
PXF
HAWQ Segment
PXF
Local Temp Storage
Segment Host
Query Executor
DataNode
PXF Interconnect
Dynamic Pipelining

Pivotal NY – Big Data & Analytics Meetup
What differentiates HAWQ: libhdfs3
¨ Pivotal rewrote libhdfs in C++ resulting in libhdfs3 ¤ C based library ¤ Leverages protocol buffers to achieve greater performance
¨ libhdfs3 is used to access HDFS from HAWQ ¨ Could benefit from short circuit reads ¨ Open sourced libhdfs3
https://github.com/PivotalRD/libhdfs3

Pivotal NY – Big Data & Analytics Meetup
What differentiates HAWQ: HDFS Truncate
¨ HDFS is designed as append-only, POSIX-like FS ¨ ACID compliant –
¤ HDFS guarantees the atomicity of Truncate operations i.e. either it succeeds or fails
¨ Added HDFS Truncate(HDFS-3107) to support rollbacks

Pivotal NY – Big Data & Analytics Meetup
What differentiates HAWQ: ORCA
¨ Multi-core query optimizer(codename ORCA) ¨ Cost based optimizer ¨ Window and Analytic Functions ¨ 1.2 Billion options evaluated in 250ms as an ex. for
TPC-DS Query #21 ¤ Partition Elimination ¤ Subquery Unnesting
¨ Presented at ACM SIGMOD 2014 Conference

Pivotal NY – Big Data & Analytics Meetup
Pivotal Xtensions Framework(PXF)
¨ External table interface in HAWQ to read data stored in Hadoop ecosystem
¨ External tables can be used to ¤ Load data into HAWQ from Hadoop ¤ Query Hadoop data without materializing it into HAWQ
¨ Enables loading and querying of data stored in ¤ HDFS Text ¤ Avro ¤ HBase ¤ Hive
n Text, Sequence and RCFile formats
Pivotal NY – Big Data & Analytics Meetup
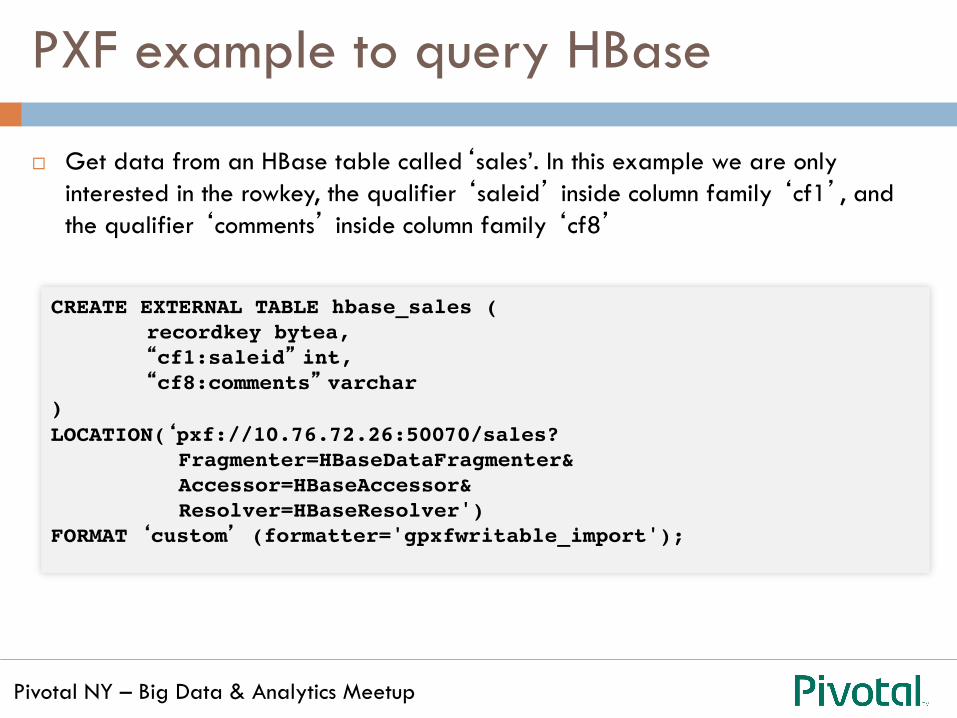
PXF example to query HBase
¨ Get data from an HBase table called‘sales’. In this example we are only interested in the rowkey, the qualifier ‘saleid’ inside column family ‘cf1’, and the qualifier ‘comments’ inside column family ‘cf8’
CREATE EXTERNAL TABLE hbase_sales (recordkey bytea, “cf1:saleid” int, “cf8:comments” varchar
)LOCATION(‘pxf://10.76.72.26:50070/sales? Fragmenter=HBaseDataFragmenter& Accessor=HBaseAccessor& Resolver=HBaseResolver')FORMAT ‘custom’ (formatter='gpxfwritable_import');

Pivotal NY – Big Data & Analytics Meetup
Source Data to HDFS
HAWQ External Table for immediate
Ad-Hoc
Load or Append a regular HAWQ
table
Load or Append directly to a regular
HAWQ Table Data outside HDFS
Example Data Flow in HAWQ
BI Tools for Reporting & Dashboard
In-Database Machine Learning using MADLib, PL/
Python, PL/R
Pivotal NY – Big Data & Analytics Meetup
HAWQ Demo
¨ HAWQ Cluster Topology ¨ HAWQ Ingest ¨ HAWQ PXF ¨ Dashboards

Pivotal NY – Big Data & Analytics Meetup
HAWQ Demo DataSet
¨ 23 Million rows of fake data, Customer Credit Card spend.
¨ Time Dimension ¨ Aggregate Tables
MACHINE LEARNING ON HDFS USING HAWQ
SQL and Machine Learning on HDFS using HAWQ

Pivotal NY – Big Data & Analytics Meetup
Analytics on HDFS, Popular Notions
¨ Store it all in HDFS and Query it all using HAWQ ¤ Scalable Storage and Scalable Compute
¨ “Gravity” of Data changes everything ¤ Move code, not data ¤ Parallelize everything ¤ Look at enGre data set and not just a sample ¤ More data could mean simpler models

Pivotal NY – Big Data & Analytics Meetup
MADLib for Machine Learning
¨ MADlib is an open-‐source library for scalable in-‐database analyGcs. It provides data-‐parallel implementaGons of mathemaGcal, staGsGcal and machine learning methods for structured and unstructured data.

Pivotal NY – Big Data & Analytics Meetup
UDF - PL/X : X in {pgsql, R, Python, Java, Perl, C etc.}
¨ Allows users to write functions in the R/Python/Java, Perl, pgsql or C languages
¨ The interpreter/VM of the language ‘X’ is installed on each node of the Greenplum Database Cluster
¨ Can install Python extensions like Numpy, NLTK, Scikit-learn, Scipy.
¨ Data Parallelism: PL/X piggybacks on MPP architecture

Pivotal NY – Big Data & Analytics Meetup
UDF - PL/X : X in {pgsql, R, Python, Java, Perl, C etc.}
HAWQ Master
HAWQ Segment(s)
Node 1
HAWQ Secondary Master
Node 2
Node 5
…
NameNode
Node 3
Secondary NameNode
Node 4 Quorum Journal Manager
Quorum Journal Manager
Zoo Keeper
Quorum Journal Manager
Data Node
HAWQ Segment(s)
Node 6
Data Node
HAWQ Segment(s)
Node N
Data Node
Zoo Keeper
Zoo Keeper
High speed Interconnect
Pivotal NY – Big Data & Analytics Meetup
Data Analytics in SQL w/ HAWQ
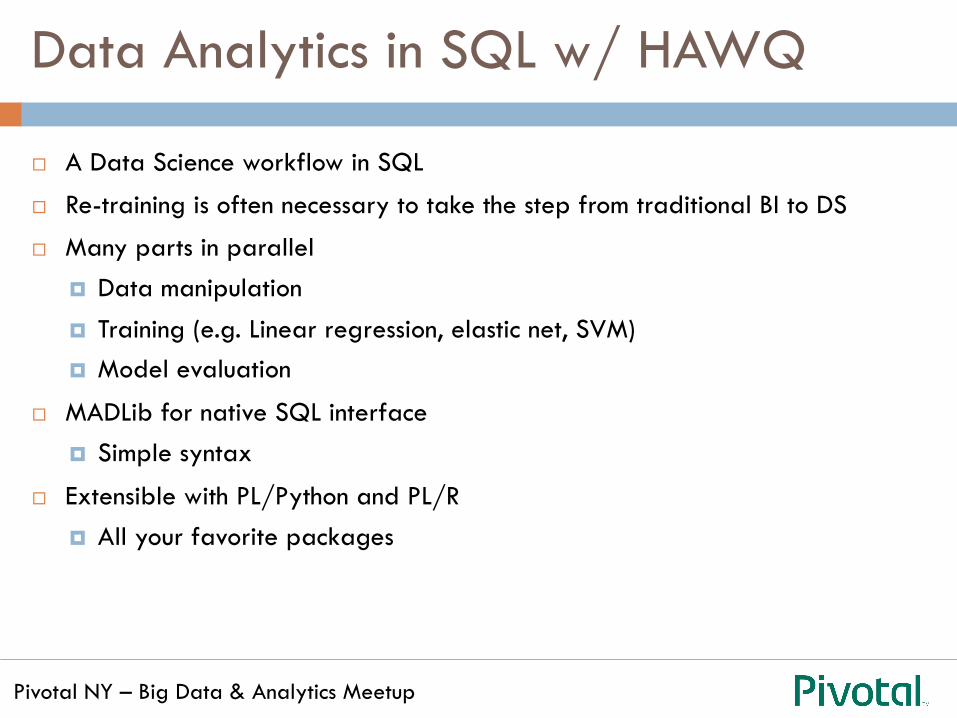
¨ A Data Science workflow in SQL
¨ Re-training is often necessary to take the step from traditional BI to DS
¨ Many parts in parallel ¤ Data manipulation ¤ Training (e.g. Linear regression, elastic net, SVM) ¤ Model evaluation
¨ MADLib for native SQL interface ¤ Simple syntax
¨ Extensible with PL/Python and PL/R ¤ All your favorite packages
Pivotal NY – Big Data & Analytics Meetup
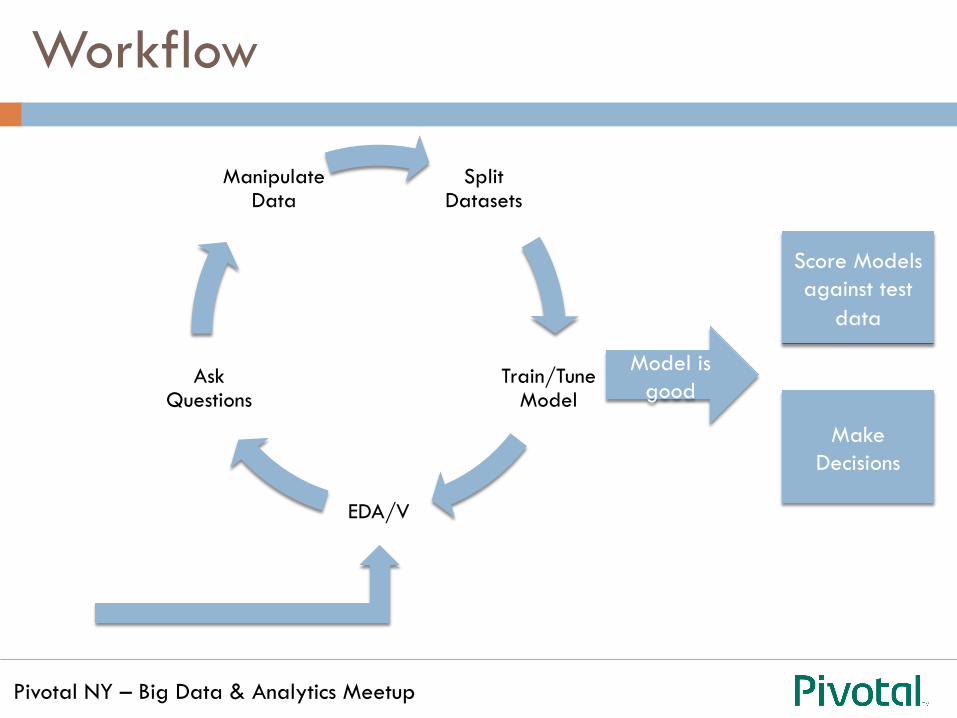
Workflow
Score Models against test
data
Split Datasets
Train/Tune Model
EDA/V
Ask Questions
Manipulate Data
Model is good
Make Decisions

Pivotal NY – Big Data & Analytics Meetup
Exploratory Data Analysis/Viz
Score Models against test
data
Split Datasets
Train/Tune Model
EDA/V
Ask Questions
Manipulate Data
Model is good
Make Decisions
- SQL - MADLib - BI Tools

Pivotal NY – Big Data & Analytics Meetup
Explore Data with MADLib
¨ Select a row ¨ Group by customer (+ age and gender) to see total spend
¤ Call it ‘summary_stats’ ¤ Select a row
¨ Use MADLib Summary Stats function ¤ select madlib.summary('summary_stats', 'summary_stats_out’,
‘total_spent'); ¤ Creates a table ‘summary_stats_out’ we can query
¤ Can group by: select madlib.summary('summary_stats', 'summary_stats_out_grouped', ‘total_spent’, ‘gender, age’);
Pivotal NY – Big Data & Analytics Meetup
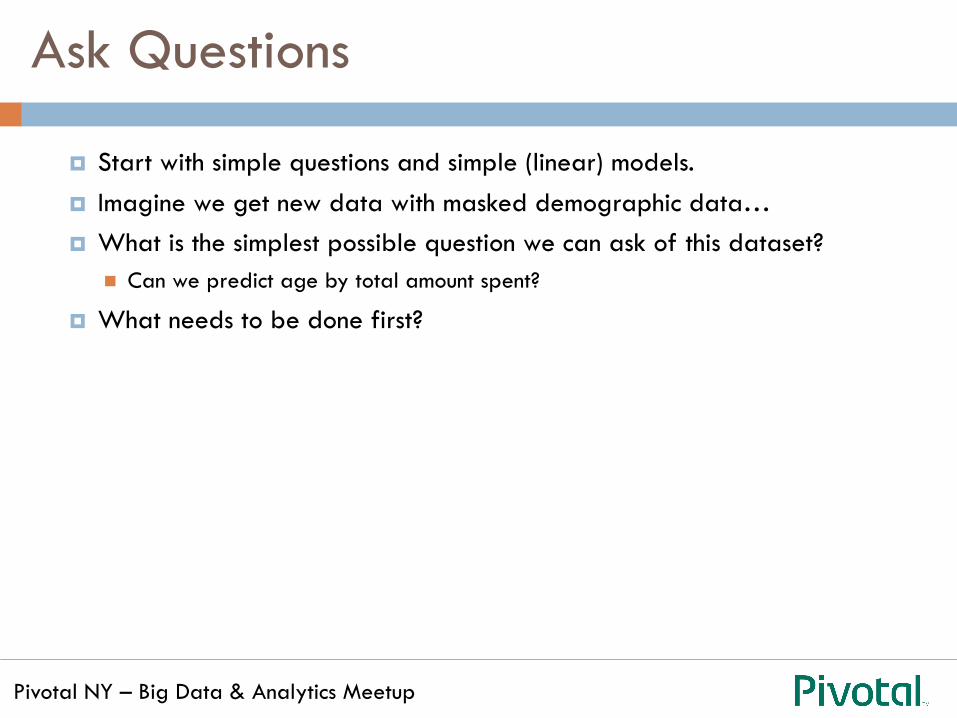
Ask Questions
¤ Start with simple questions and simple (linear) models. ¤ Imagine we get new data with masked demographic data… ¤ What is the simplest possible question we can ask of this dataset?
n Can we predict age by total amount spent?
¤ What needs to be done first?

Pivotal NY – Big Data & Analytics Meetup
Feature Engineering
Score Models against test
data
Split Datasets
Train/Tune Model
EDA/V
Ask Questions
Manipulate Data
Model is good
Make Decisions
- SQL - PL/R - PL/Python
Pivotal NY – Big Data & Analytics Meetup
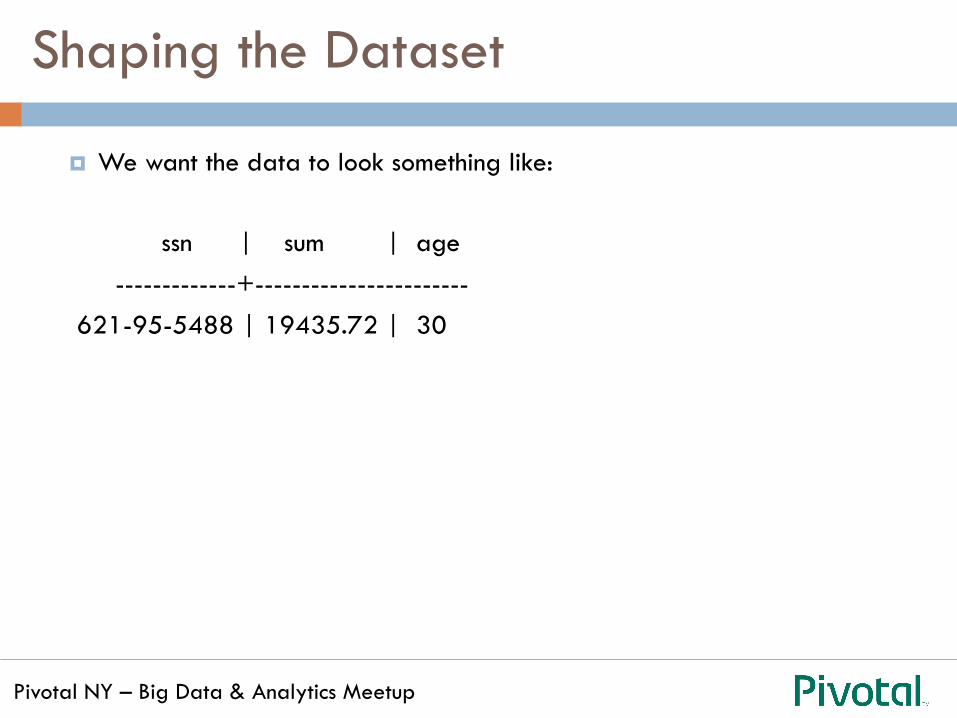
Shaping the Dataset
¤ We want the data to look something like:
ssn | sum | age -------------+----------------------- 621-95-5488 | 19435.72 | 30

Pivotal NY – Big Data & Analytics Meetup
Shaping the Dataset
¤ We want the data to look something like:
ssn | sum | age -------------+----------------------- 621-95-5488 | 19435.72 | 30 CREATE OR REPLACE VIEW cust_age_totalspend AS SELECT ssn, sum(amt), extract(years from age(NOW(),dob)) as age FROM mart.trans_fact GROUP BY ssn, extract(years from age(NOW(),dob));

Pivotal NY – Big Data & Analytics Meetup
Skipping for now…
Score Models against test
data
Split Datasets
Train/Tune Model
EDA/V
Ask Questions
Manipulate Data
Model is good
Make Decisions
- SQL - PL/R - PL/Python - MADLib

Pivotal NY – Big Data & Analytics Meetup
Building Models
Score Models against test
data
Split Datasets
Train/Tune Model
EDA/V
Ask Questions
Manipulate Data
Model is good
Make Decisions
- PL/R - PL/Python - MADLib

Pivotal NY – Big Data & Analytics Meetup
MADLib’s Interface
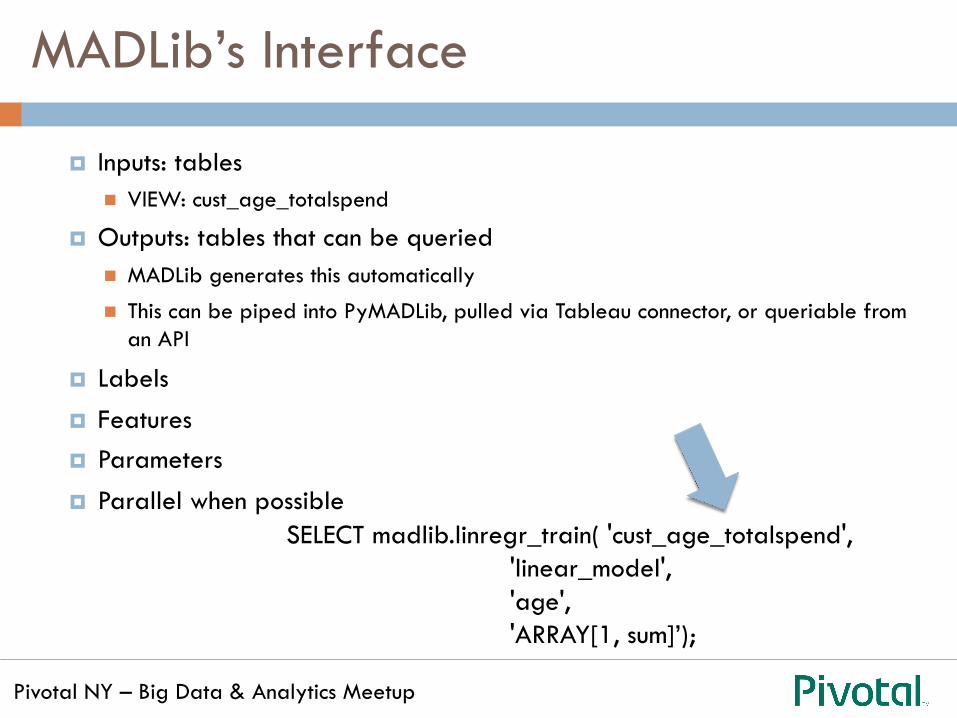
¤ Inputs: tables n VIEW: cust_age_totalspend
¤ Outputs: tables that can be queried n MADLib generates this automatically
n This can be piped into PyMADLib, pulled via Tableau connector, or queriable from an API
¤ Labels ¤ Features ¤ Parameters ¤ Parallel when possible
Pivotal NY – Big Data & Analytics Meetup
MADLib’s Interface
¤ Inputs: tables n VIEW: cust_age_totalspend
¤ Outputs: tables that can be queried n MADLib generates this automatically
n This can be piped into PyMADLib, pulled via Tableau connector, or queriable from an API
¤ Labels ¤ Features ¤ Parameters ¤ Parallel when possible SELECT madlib.linregr_train( 'cust_age_totalspend',
'linear_model', 'age', 'ARRAY[1, sum]’);
Pivotal NY – Big Data & Analytics Meetup
MADLib’s Interface
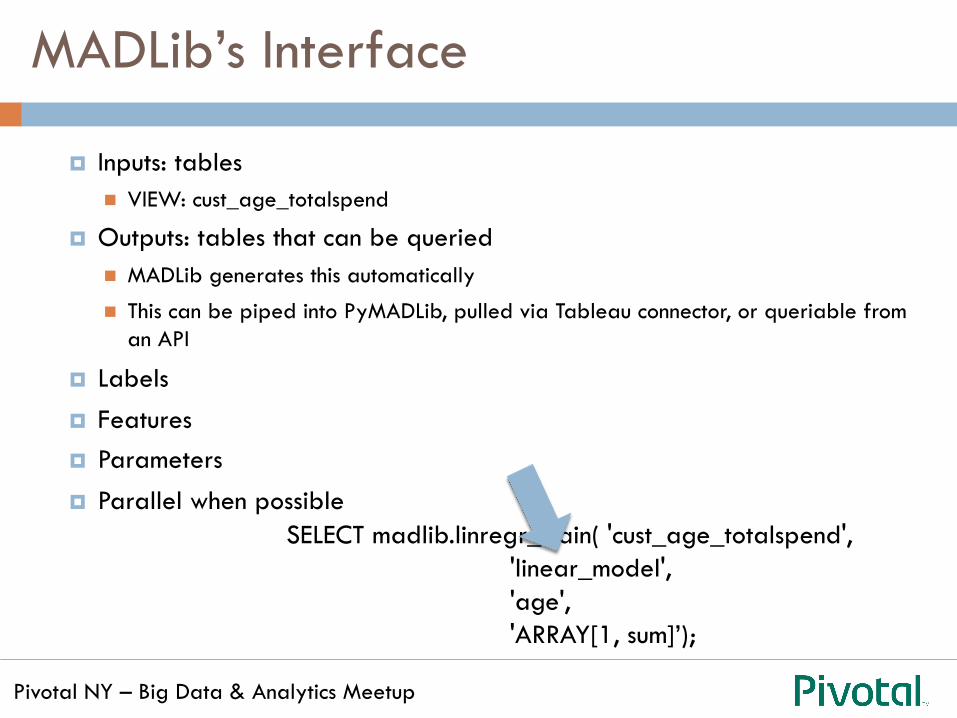
¤ Inputs: tables n VIEW: cust_age_totalspend
¤ Outputs: tables that can be queried n MADLib generates this automatically
n This can be piped into PyMADLib, pulled via Tableau connector, or queriable from an API
¤ Labels ¤ Features ¤ Parameters ¤ Parallel when possible SELECT madlib.linregr_train( 'cust_age_totalspend',
'linear_model', 'age', 'ARRAY[1, sum]’);

Pivotal NY – Big Data & Analytics Meetup
MADLib’s Interface
¤ Inputs: tables n VIEW: cust_age_totalspend
¤ Outputs: tables that can be queried n MADLib generates this automatically
n This can be piped into PyMADLib, pulled via Tableau connector, or queriable from an API
¤ Labels ¤ Features ¤ Parameters ¤ Parallel when possible SELECT madlib.linregr_train( 'cust_age_totalspend',
'linear_model', 'age', 'ARRAY[1, sum]’);

Pivotal NY – Big Data & Analytics Meetup
Scoring Chosen Model
Score Models against test
data
Split Datasets
Train/Tune Model
EDA/V
Ask Questions
Manipulate Data
Model is good
Make Decisions
- PL/R - PL/Python - MADLib

Pivotal NY – Big Data & Analytics Meetup
Viewing Coefficients
¤ As simple as querying a table: SELECT * FROM linear_model;
¤ Unnest arrays: SELECT unnest(ARRAY['intercept', 'sum']) as attribute,
unnest(coef) as coefficient, unnest(std_err) as standard_error,
unnest(t_stats) as t_stat, unnest(p_values) as pvalue
FROM linear_model;
Pivotal NY – Big Data & Analytics Meetup
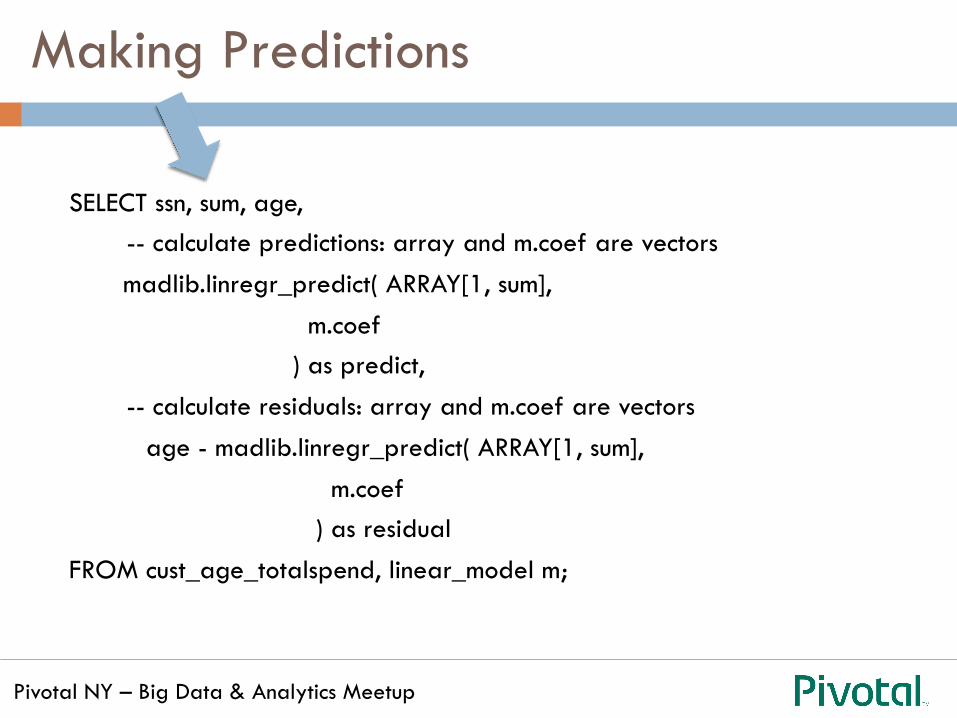
Making Predictions
SELECT ssn, sum, age,
-- calculate predictions: array and m.coef are vectors madlib.linregr_predict( ARRAY[1, sum], m.coef ) as predict,
-- calculate residuals: array and m.coef are vectors age - madlib.linregr_predict( ARRAY[1, sum], m.coef ) as residual FROM cust_age_totalspend, linear_model m;

Pivotal NY – Big Data & Analytics Meetup
Making/Evaluating Predictions
SELECT ssn, sum, age,
-- calculate predictions: array and m.coef are vectors madlib.linregr_predict( ARRAY[1, sum], m.coef ) as predict,
-- calculate residuals: array and m.coef are vectors age - madlib.linregr_predict( ARRAY[1, sum], m.coef ) as residual FROM cust_age_totalspend, linear_model m;

Pivotal NY – Big Data & Analytics Meetup
Scoring (Mean Squared Error)
SELECT avg(residual^2) AS mse FROM (SELECT age - madlib.linregr_predict( ARRAY[1, sum], m.coef ) as residual FROM cust_age_totalspend, linear_model m) PREDICTIONS;
Pivotal NY – Big Data & Analytics Meetup
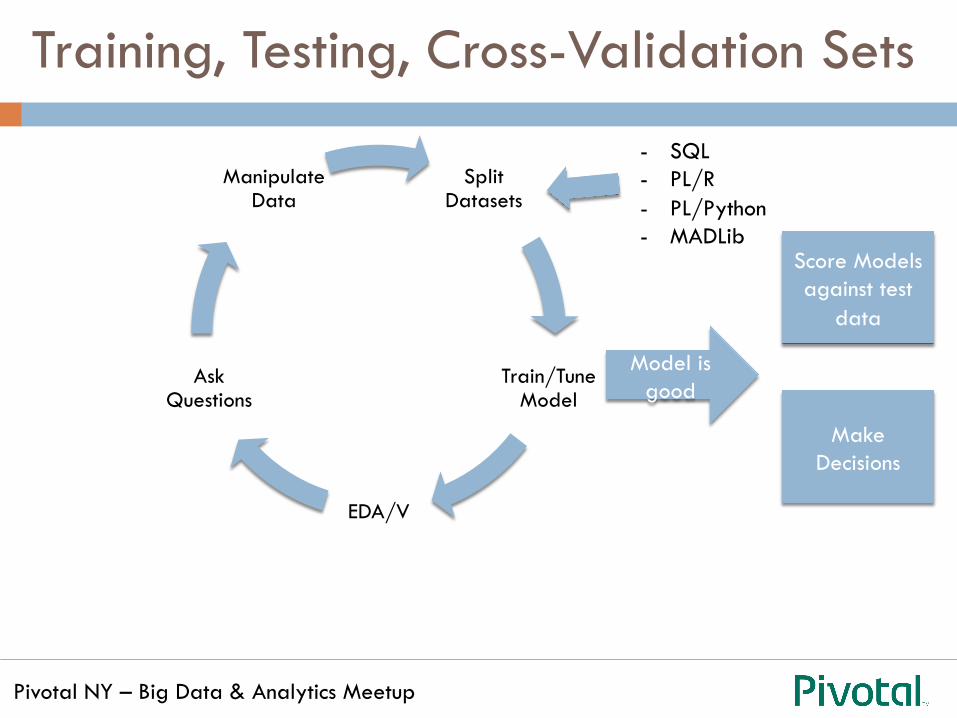
Training, Testing, Cross-Validation Sets
Score Models against test
data
Split Datasets
Train/Tune Model
EDA/V
Ask Questions
Manipulate Data
Model is good
Make Decisions
- SQL - PL/R - PL/Python - MADLib

Pivotal NY – Big Data & Analytics Meetup
SQL To Create 80/20 Test/Train
¤ MADLib has a built-in cross validation function ¤ Stratified Sampling with pure SQL
n Random seed (-1, 1): n SELECT setseed(0.444); n Partition the data by group n Sort by the random # n Assign a row count n Use a correlated subquery to select the lowest 80% of row counts by partition into the training
set
n The code…

Pivotal NY – Big Data & Analytics Meetup
SQL To Create 80/20 Test/Train
-- 1. perform the same aggregation step as before in creating the view
WITH assign_random AS (
SELECT ssn, extract(years from age(NOW(),dob)) as age, sum(amt) as total_spent, random() as random
FROM mart.trans_fact
GROUP BY ssn, extract(years from age(NOW(),dob))
),
-- 2. add a different row count for group type (in this case, just age)
training_rownums AS (
SELECT *, ROW_NUMBER() OVER (PARTITION BY age ORDER BY random) AS rownum FROM assign_random
)
-- 3. sample the lowest 80% of rownums as the training set by group using
----- a correlated subquery (iterate over groups) because HAWQ is ANSI complient
SELECT ssn, age, total_spent
FROM training_rownums tr1
WHERE rownum <= (
(SELECT MAX(rownum) * 0.8 FROM training_rownums tr2 WHERE tr1.age = tr2.age
)));

Pivotal NY – Big Data & Analytics Meetup
Another question
Score Models against test
data
Split Datasets
Train/Tune Model
EDA/V
Ask Questions
Manipulate Data
Model is good
Make Decisions
Pivotal NY – Big Data & Analytics Meetup
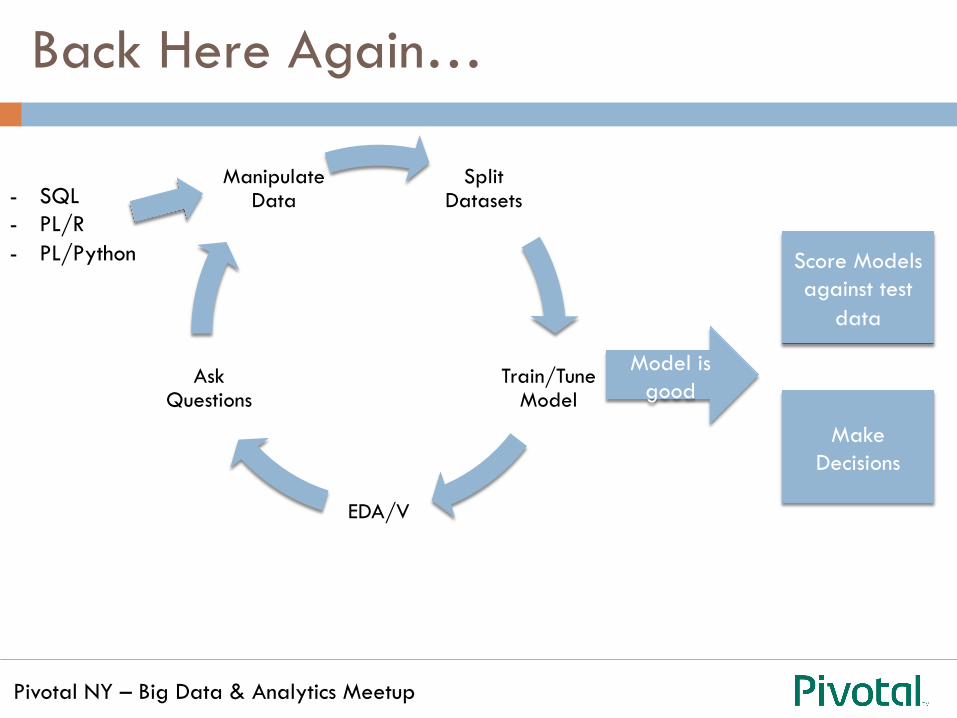
Back Here Again…
Score Models against test
data
Split Datasets
Train/Tune Model
EDA/V
Ask Questions
Manipulate Data
Model is good
Make Decisions
- SQL - PL/R - PL/Python
Pivotal NY – Big Data & Analytics Meetup
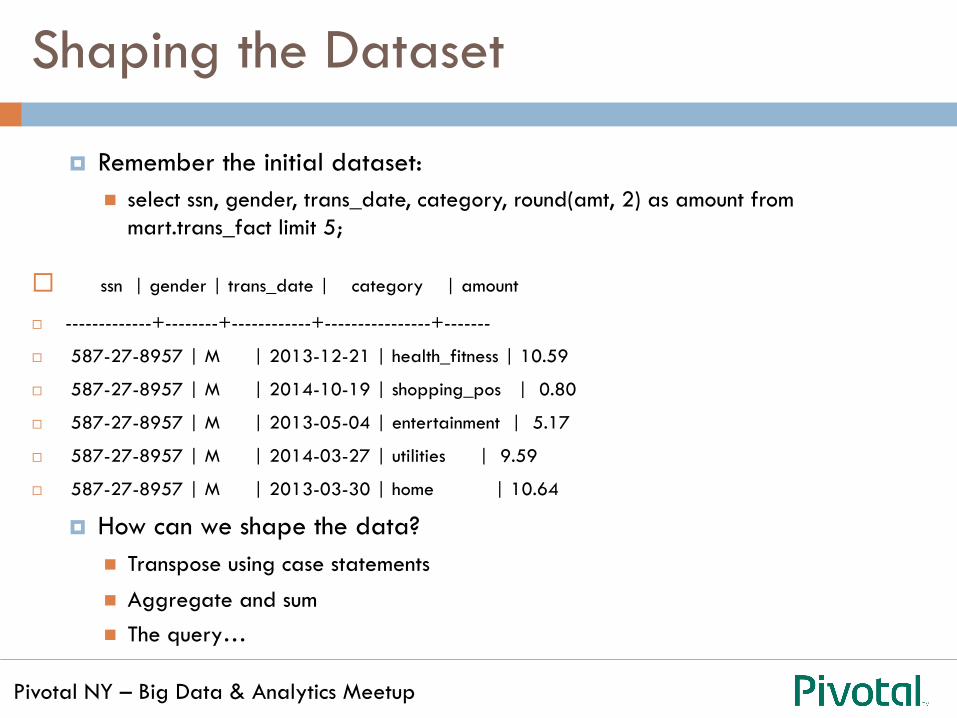
Shaping the Dataset
¤ Remember the initial dataset: n select ssn, gender, trans_date, category, round(amt, 2) as amount from
mart.trans_fact limit 5;
¨ ssn | gender | trans_date | category | amount
¨ -------------+--------+------------+----------------+-------
¨ 587-27-8957 | M | 2013-12-21 | health_fitness | 10.59
¨ 587-27-8957 | M | 2014-10-19 | shopping_pos | 0.80
¨ 587-27-8957 | M | 2013-05-04 | entertainment | 5.17
¨ 587-27-8957 | M | 2014-03-27 | utilities | 9.59
¨ 587-27-8957 | M | 2013-03-30 | home | 10.64
¤ How can we shape the data? n Transpose using case statements
n Aggregate and sum n The query…

Pivotal NY – Big Data & Analytics Meetup
Shaping the Dataset
¤ Remember the initial dataset: n select ssn, gender, trans_date, category, round(amt, 2) as amount from
mart.trans_fact limit 5;
¨ ssn | gender | trans_date | category | amount
¨ -------------+--------+------------+----------------+-------
¨ 587-27-8957 | M | 2013-12-21 | health_fitness | 10.59
¨ 587-27-8957 | M | 2014-10-19 | shopping_pos | 0.80
¨ 587-27-8957 | M | 2013-05-04 | entertainment | 5.17
¨ 587-27-8957 | M | 2014-03-27 | utilities | 9.59
¨ 587-27-8957 | M | 2013-03-30 | home | 10.64
¤ How can we shape the data? n Transpose using case statements
n Aggregate and sum n The query…
Pivotal NY – Big Data & Analytics Meetup
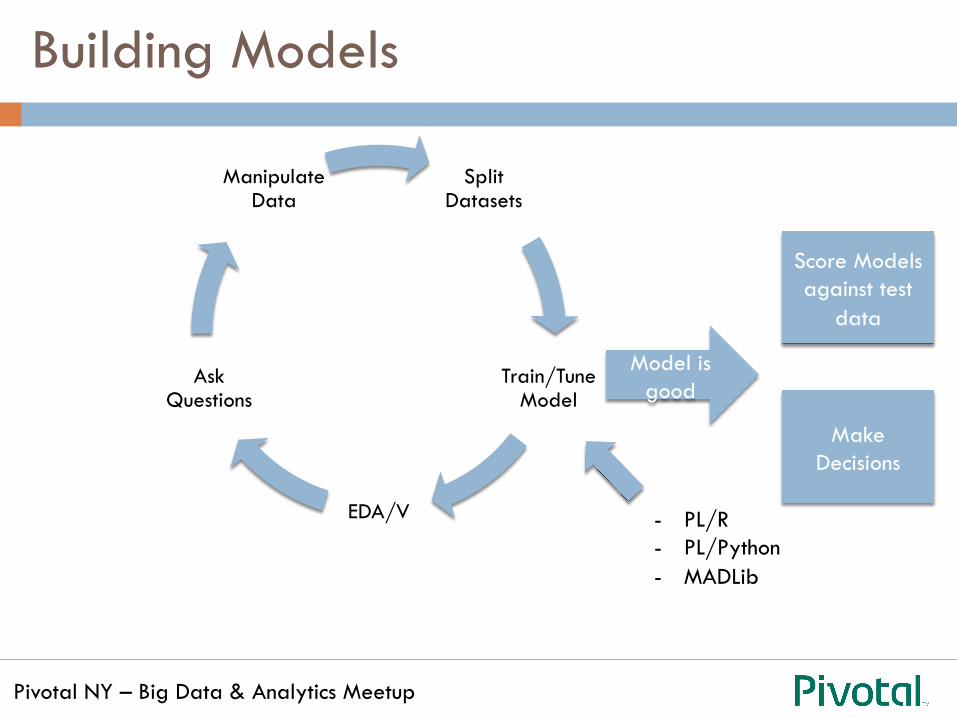
Building Models
Score Models against test
data
Split Datasets
Train/Tune Model
EDA/V
Ask Questions
Manipulate Data
Model is good
Make Decisions
- PL/R - PL/Python - MADLib

Pivotal NY – Big Data & Analytics Meetup
Learn Age Using Category Spending
DROP TABLE IF EXISTS elastic_output; SELECT madlib.elastic_net_train( 'training_set', 'elastic_output', 'age', 'array[food_dining, utilities, grocery_net, home, pharmacy, shopping_pos, kids_pets, personal_care, misc_pos, gas_transport, misc_net, health_fitness, shopping_net, travel]',
<other parameters>);
Pivotal NY – Big Data & Analytics Meetup
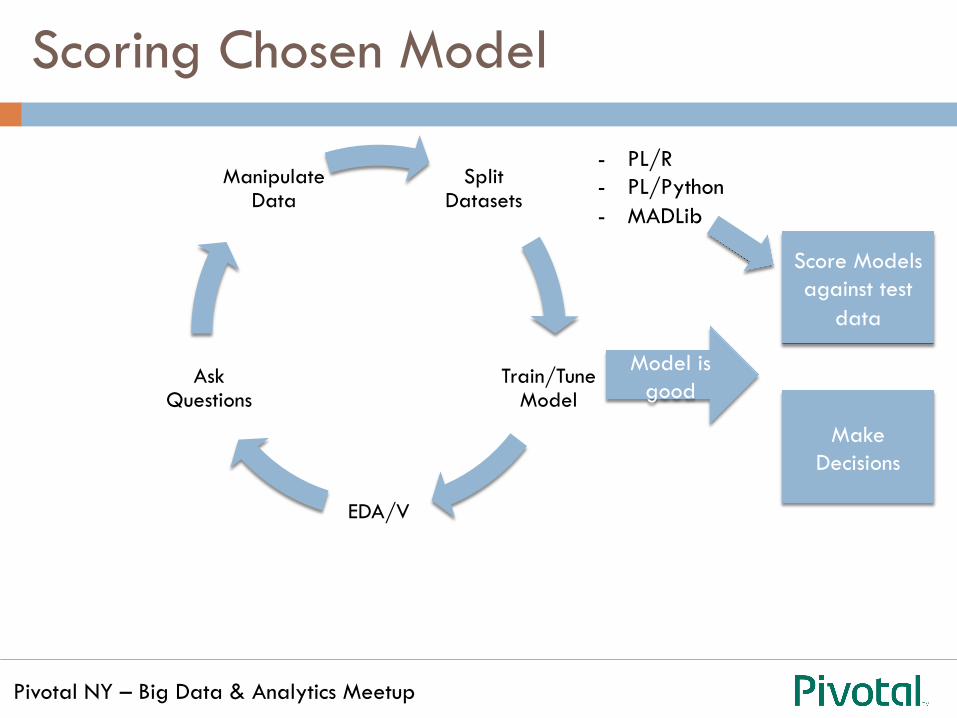
Scoring Chosen Model
Score Models against test
data
Split Datasets
Train/Tune Model
EDA/V
Ask Questions
Manipulate Data
Model is good
Make Decisions
- PL/R - PL/Python - MADLib

Pivotal NY – Big Data & Analytics Meetup
Predictions on Test Set
SELECT ssn, predict, age - predict AS residual FROM ( SELECT test_set.*, madlib.elastic_net_gaussian_predict( m.coef_all, m.intercept, ARRAY[food_dining, utilities, grocery_net, home, pharmacy, shopping_pos, kids_pets, personal_care, misc_pos, gas_transport, misc_net, health_fitness, shopping_net, travel] ) AS predict FROM test_set, elastic_output m) s ORDER BY ssn;

Pivotal NY – Big Data & Analytics Meetup
Score Results
SELECT avg(residual^2) FROM (<previous slide>) RESIDUALS;

Pivotal NY – Big Data & Analytics Meetup
PL/Python
¤ PL/Python (or PL/R) for data manipulation and training models ¤ Less intuitive than MADLib
Pivotal NY – Big Data & Analytics Meetup
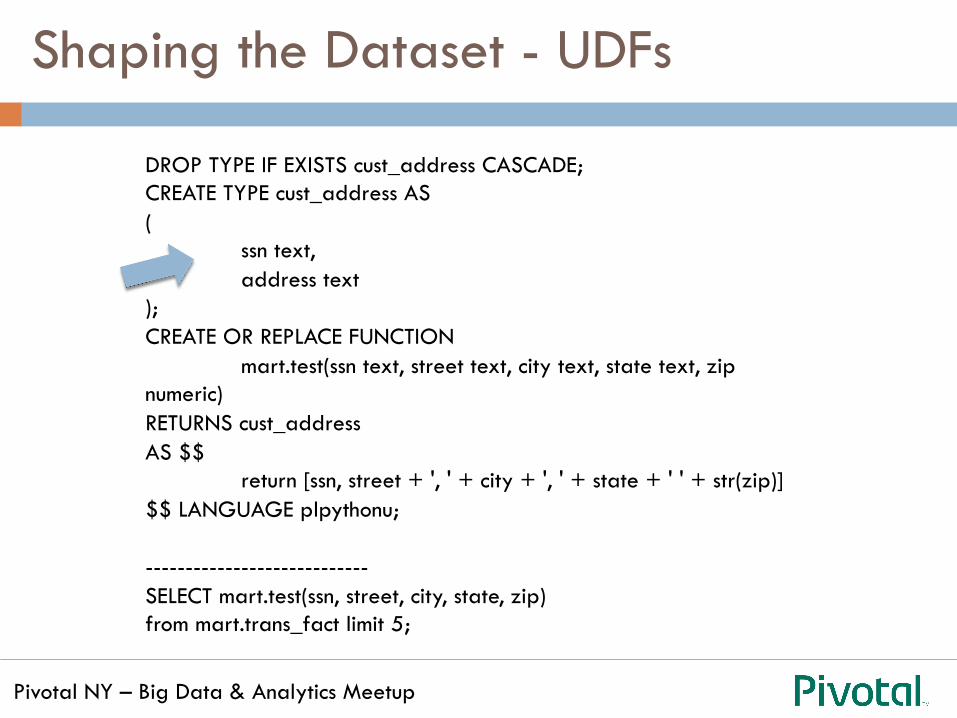
Shaping the Dataset - UDFs
DROP TYPE IF EXISTS cust_address CASCADE; CREATE TYPE cust_address AS (
ssn text, address text
); CREATE OR REPLACE FUNCTION
mart.test(ssn text, street text, city text, state text, zip numeric) RETURNS cust_address AS $$
return [ssn, street + ', ' + city + ', ' + state + ' ' + str(zip)] $$ LANGUAGE plpythonu; ---------------------------- SELECT mart.test(ssn, street, city, state, zip) from mart.trans_fact limit 5;
Pivotal NY – Big Data & Analytics Meetup
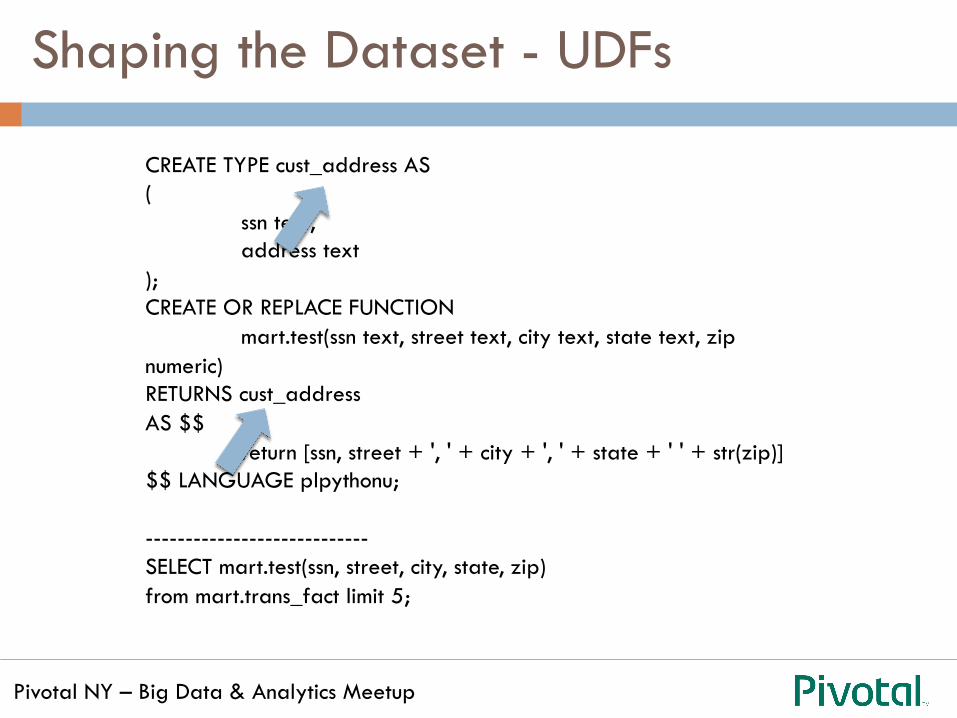
Shaping the Dataset - UDFs
CREATE TYPE cust_address AS (
ssn text, address text
); CREATE OR REPLACE FUNCTION
mart.test(ssn text, street text, city text, state text, zip numeric) RETURNS cust_address AS $$
return [ssn, street + ', ' + city + ', ' + state + ' ' + str(zip)] $$ LANGUAGE plpythonu; ---------------------------- SELECT mart.test(ssn, street, city, state, zip) from mart.trans_fact limit 5;

Pivotal NY – Big Data & Analytics Meetup
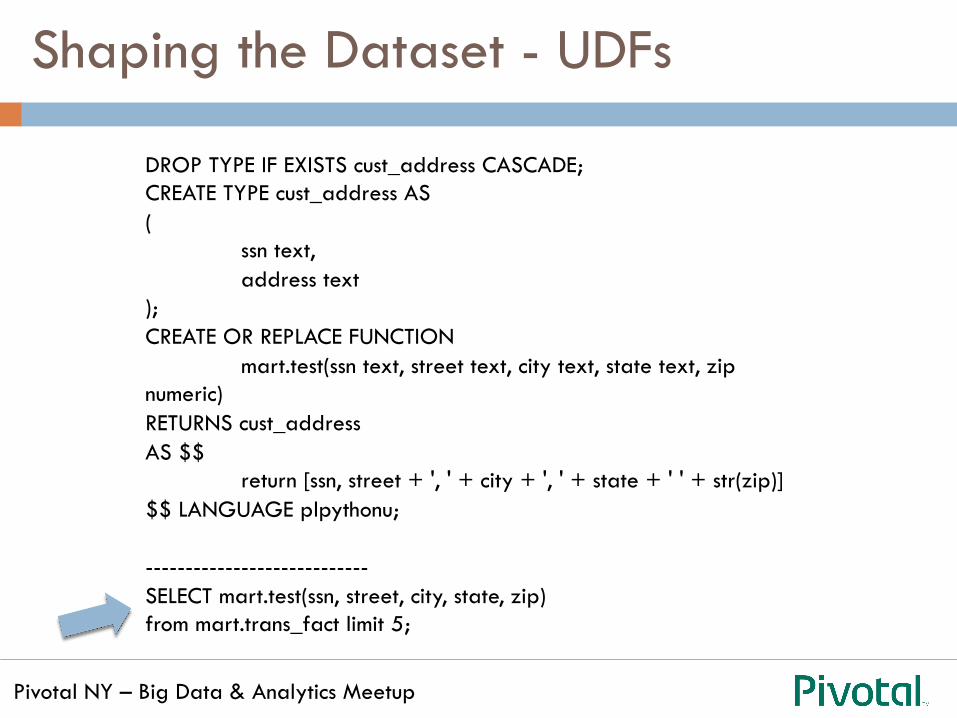
Shaping the Dataset - UDFs
DROP TYPE IF EXISTS cust_address CASCADE; CREATE TYPE cust_address AS (
ssn text, address text
); CREATE OR REPLACE FUNCTION
mart.test(ssn text, street text, city text, state text, zip numeric) RETURNS cust_address AS $$
return [ssn, street + ', ' + city + ', ' + state + ' ' + str(zip)] $$ LANGUAGE plpythonu; ---------------------------- SELECT mart.test(ssn, street, city, state, zip) from mart.trans_fact limit 5;

Pivotal NY – Big Data & Analytics Meetup
Shaping the Dataset - UDFs
DROP TYPE IF EXISTS cust_address CASCADE; CREATE TYPE cust_address AS (
ssn text, address text
); CREATE OR REPLACE FUNCTION
mart.test(ssn text, street text, city text, state text, zip numeric) RETURNS cust_address AS $$
return [ssn, street + ', ' + city + ', ' + state + ' ' + str(zip)] $$ LANGUAGE plpythonu; ---------------------------- SELECT mart.test(ssn, street, city, state, zip) from mart.trans_fact limit 5;
Pivotal NY – Big Data & Analytics Meetup
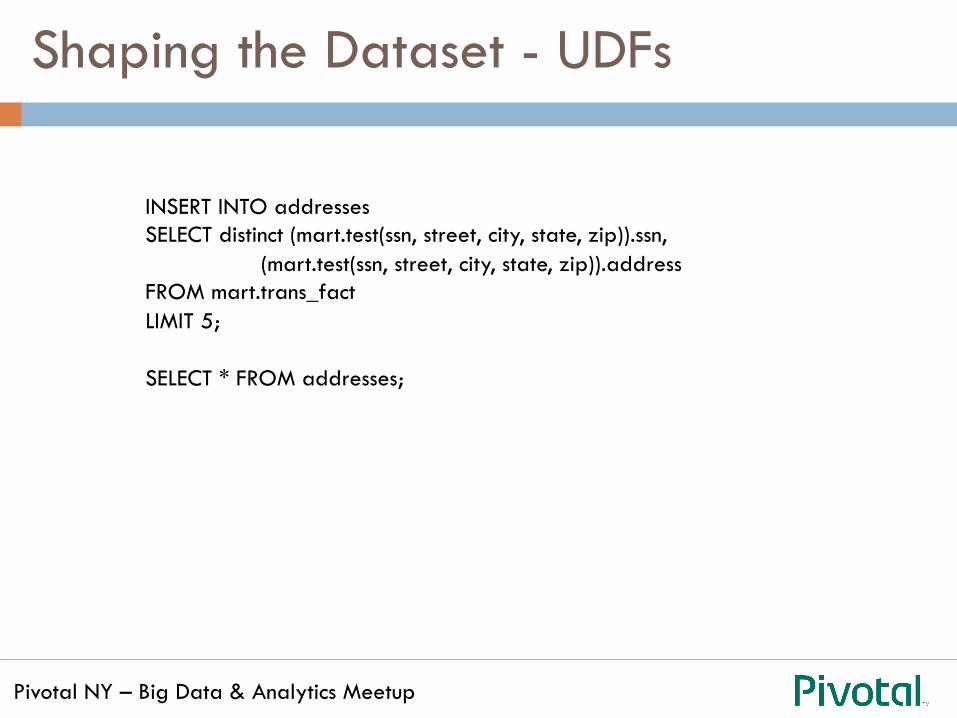
Shaping the Dataset - UDFs
INSERT INTO addresses SELECT distinct (mart.test(ssn, street, city, state, zip)).ssn,
(mart.test(ssn, street, city, state, zip)).address FROM mart.trans_fact LIMIT 5; SELECT * FROM addresses;