Embed Size (px)
Citation preview

Semantic integration at large scale: benefits and challenges
Maria-Cristina Marinescu Barcelona Supercomputing Center

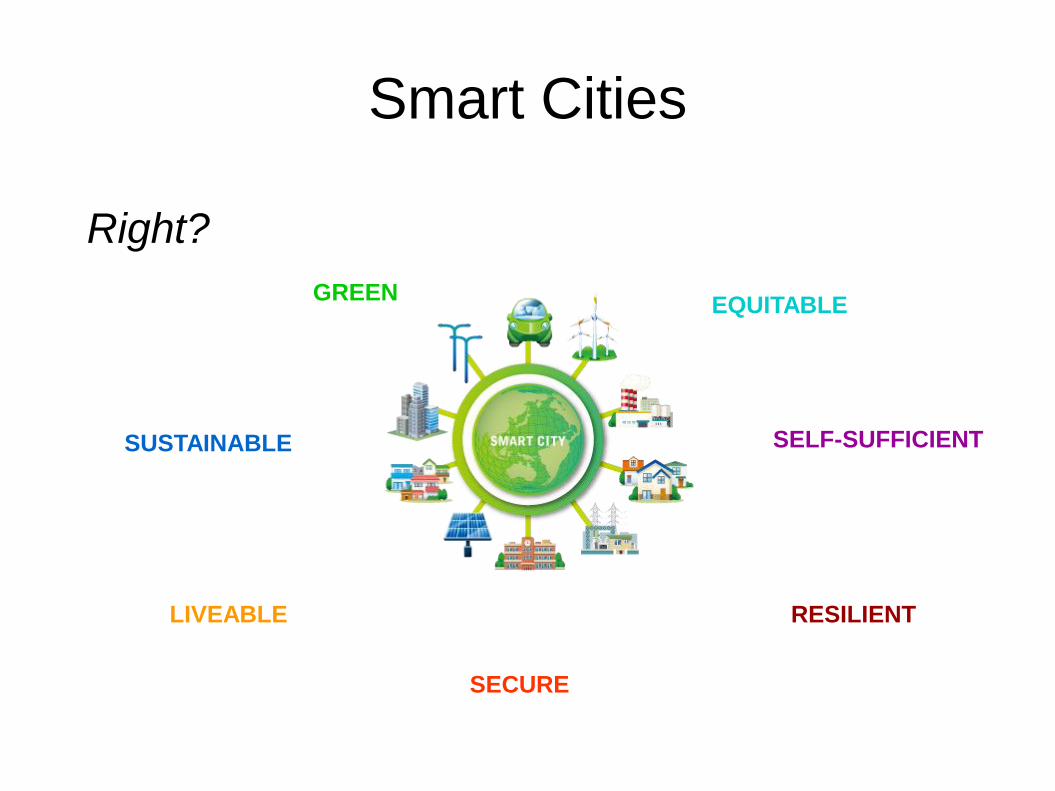
What is a Smart City?

Smart Cities
SUSTAINABLE
GREEN
SECURE
LIVEABLE
SELF-SUFFICIENT
RESILIENT
EQUITABLE
Smart Cities
SUSTAINABLE
GREEN
SECURE
LIVEABLE
SELF-SUFFICIENT
RESILIENT
EQUITABLE
Right?

Smart Cities?
BETTER, FASTER MAIN AVENUE … may split neighbourhoods
NEW HOUSING IN PREVIOUSLY RAN DOWN NEIGHBOURHOOD … housing may become unaffordable for previous neighbours … neighbourhoods loose identity, friends/family move apart … existing local issues spread globally (crime, STDs – Baltimore housing projects, ...)
CITY FOCUSES ON LOCAL PRODUCE / RURAL REGION SPECIALIZES IN FEW HIGHLY DEMANDED PRODUCTS … draught or plague may hit a crop → there`s no backup plan for rural region, and delayed response in city
TRAM TO AVOID TRAFFIC JAMS AND RUN DIRECTLY … may collapse car /public transport. traffic that runs in different direction
WALKABLE CITIES … commercial traffic worsens, no place to stop … less parking space for neighbours … possibly in places where people don`t usually walk! (e.g. steep hills)
CHANGING / DAMMING WATER COURSE FOR CITIES … ecosystem changes … displaced people

Smart(er) Cities
BETTER, FASTER MAIN AVENUE … may split neighbourhoods
NEW HOUSING IN PREVIOUSLY RAN DOWN NEIGHBOURHOOD … housing may become unaffordable for previous neighbours … neighbourhoods loose identity, friends/family move apart … existing local issues spread globally (crime, STDs, ...)
CITY FOCUSES ON LOCAL PRODUCE / RURAL REGION SPECIALIZES IN FEW HIGHLY DEMANDED PRODUCTS … draught or plague may hit a crop → there`s no backup plan for rural region, and delayed response in city
TRAM TO AVOID TRAFFIC JAMS AND RUN DIRECTLY … may collapse car /public transport. traffic that runs in different direction
WALKABLE CITIES … commercial traffic worsens, no place to stop … less parking space for neighbours … possibly in places where people don`t usually walk! (e.g. steep hills)
CHANGING / DAMMING WATER COURSE FOR CITIES … ecosystem changes … displaced people
Define goals Define model that allows - integration of data - measuring the current status Capture interconnections between domains (and goals)

Massive city data integration
Not only in volume, but more importantly, in number of heterogeneous data sources!
Structured, semi-structured, raw data… in different formats
Traditional approach:
1. Manually identify relevant data and map it to a schema
Problem: schema may not support actual data, needs redesign!
2. Consult, analyze, display data
Problem: if schema changes,
apps don´t work any longer!
Green&Sport Area
Number of Trees
Coordinates (format1)
Status
Area
Id
Adjacent to
Coordinates (format2)
Surface
Green Area Id
Number of Trees
Sport Area Id
Sport Material
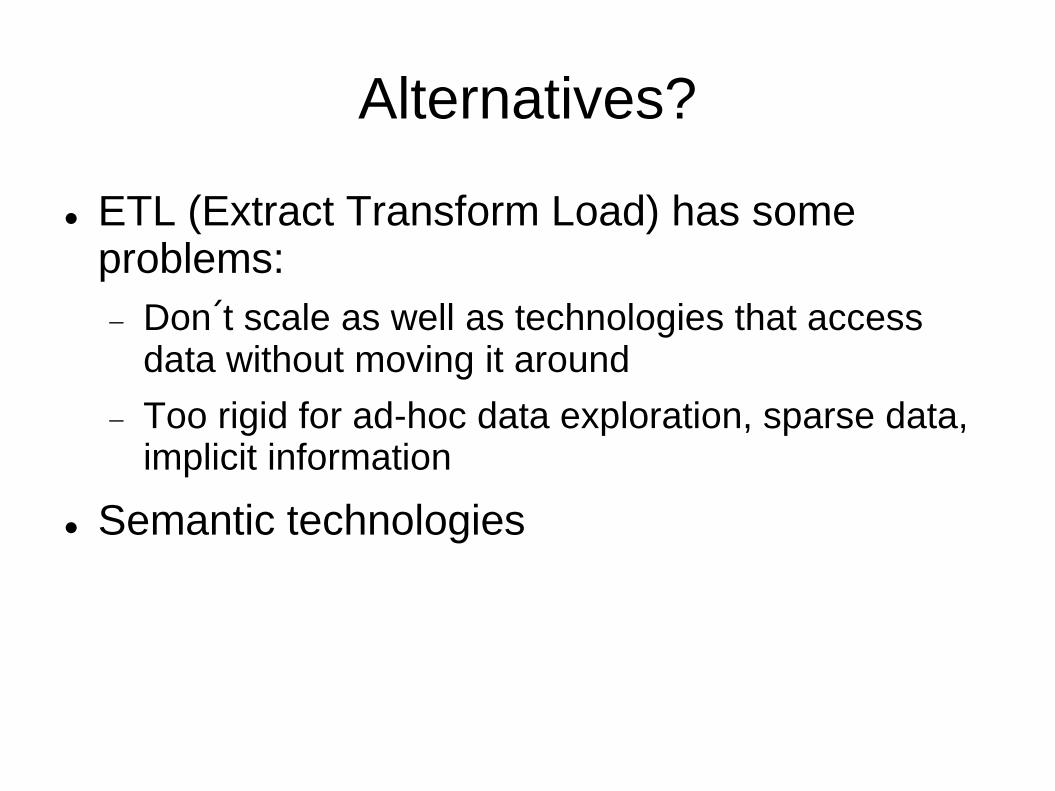
Alternatives?
ETL (Extract Transform Load) has some problems:
Don´t scale as well as technologies that access data without moving it around
Too rigid for ad-hoc data exploration, sparse data, implicit information
Semantic technologies

Explicit relationships
Richer, more general model (domain rather than application
specific)
Association Is a
Semantic integration
Area
Coordinates
Surface
Green Area Sport Area
Is a Is a
Has Coordinates
Has Surface
Adjacent to
Numeric
Has Sport Material
Numeric
Has Trees

Semantic integration
Examples: ‘Adjacent to’ not only a field
name in table ‘Area’, but a
concept in itself, with labels,
relationships, synonyms,
superconcepts, subconcepts, etc.
‘Adjacent to’ transitive
Newly inferred relationships:
Sport Area has surface
Reflexive
Transitive
Road
Adjacent to
Traffic volume
Contamination
Has
Measured by
Area
Coordinates
Surface
Green Area Sport Area
Is a Is a
Has Coordinates
Has Surface
Adjacent to
Numeric
Has Sport Material
Numeric
Has Trees
Association
Is a
Explicit relationships
Richer, more general model (domain rather than application
specific) Easier to understand, browse, and search
Easier to integrate cross-domain information
Semantic Approach. Part III
Area
Coordinates
Surface
Green Area
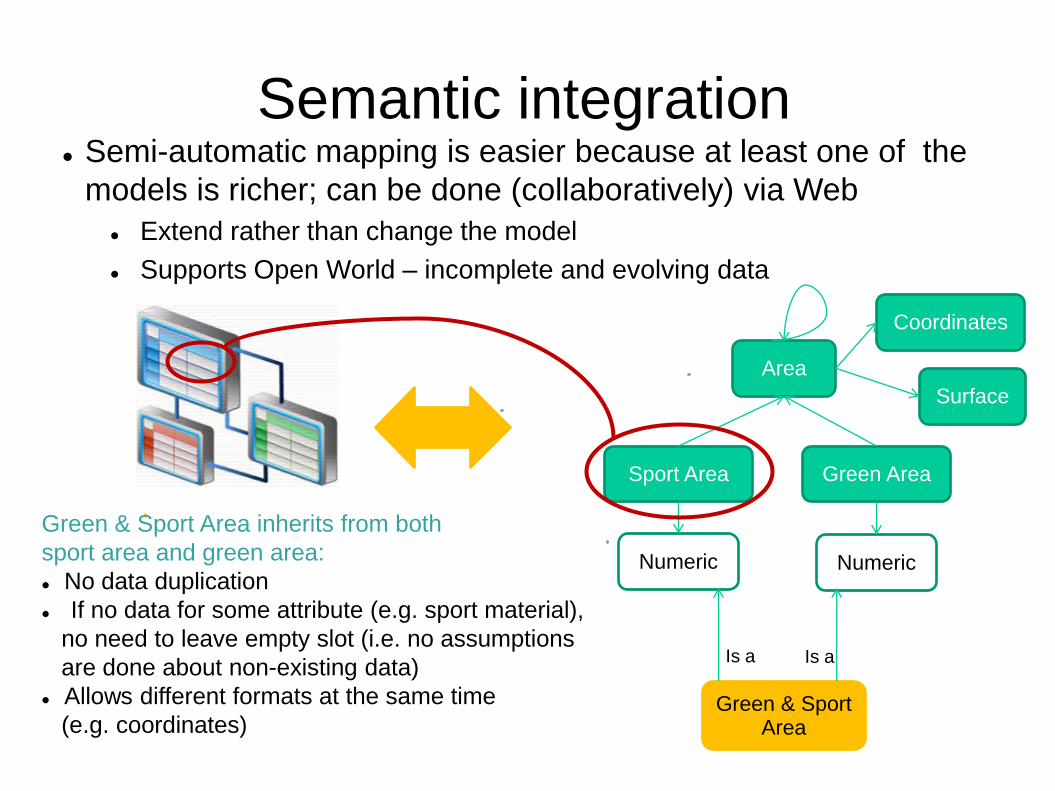
Semantic integration
Green & Sport Area inherits from both
sport area and green area:
No data duplication
If no data for some attribute (e.g. sport material),
no need to leave empty slot (i.e. no assumptions
are done about non-existing data)
Allows different formats at the same time
(e.g. coordinates)
Area
Coordinates
Surface
Green Area Sport Area
Numeric Numeric
Green & Sport Area
Is a Is a
Semi-automatic mapping is easier because at least one of the
models is richer; can be done (collaboratively) via Web
Extend rather than change the model
Supports Open World – incomplete and evolving data

Semantic Approach. Part V
Consult, analyze, display
Reduce app re-engineering (e.g. Green &
Sport Areas are implicity included as types
of Areas)
Semantic access without modifying the apps
– mapping to different data via the same model
Display areas on map, show
attributes and related concepts,
query data and model
Semantic integration
Barcelona schema Quito schema
MAP MAP
Is a Is a
Area
Green Area Sport Area
Is a (inference)
Software
Schema
Data
Is a Is a
Green & Sport Area

Semantic Approach. Part VI
Data accessible unambiguously (each concept = URI) and directly
via Web
Open Linked Data: publish, share, reuse, import (same format!)
Link with concepts from other semantic models!
Area
Semantic integration
Geo-spatial
Measures
Indicators
Time
Area
Coordinates
Surface

Semantic Models Issues & Solutions
Bad design of the semantic model could affect its extensibility
A good ontology is domain specific, but depends on HOW it will
be used (application goals), based on standards when possible
Complex models to browse and search
The more domain specific, the easier to use (but less reusable)
Integration of open data, evolving ontologies, population at
large scale
Entities and relationships may evolve over time or between
cities
Data of new types – help from mapping tool and exploration /
navigation tools
Data not precise, inconsistent, or uncertain
Data curation and consistency
Probabilistic data
Challenges

Semantic Models Issues & Solutions
Lack of support for geo-spatial information
Needs huge storage capacity
Integration with maps
Querying easier than in general purpose GIS or general
purpose semantic platforms
Specific platforms/algorithms to speed up the queries
Data not available at requested spatial granularity – domain
experts apply different approximation methods depending
on data type
Query scalability
Trade-off between expressiveness and computational costs
Reasons: reasoning at runtime, no generally applicable
efficient indexing schemas, graph-based querying, etc
Challenges (cont´d)

Questions?

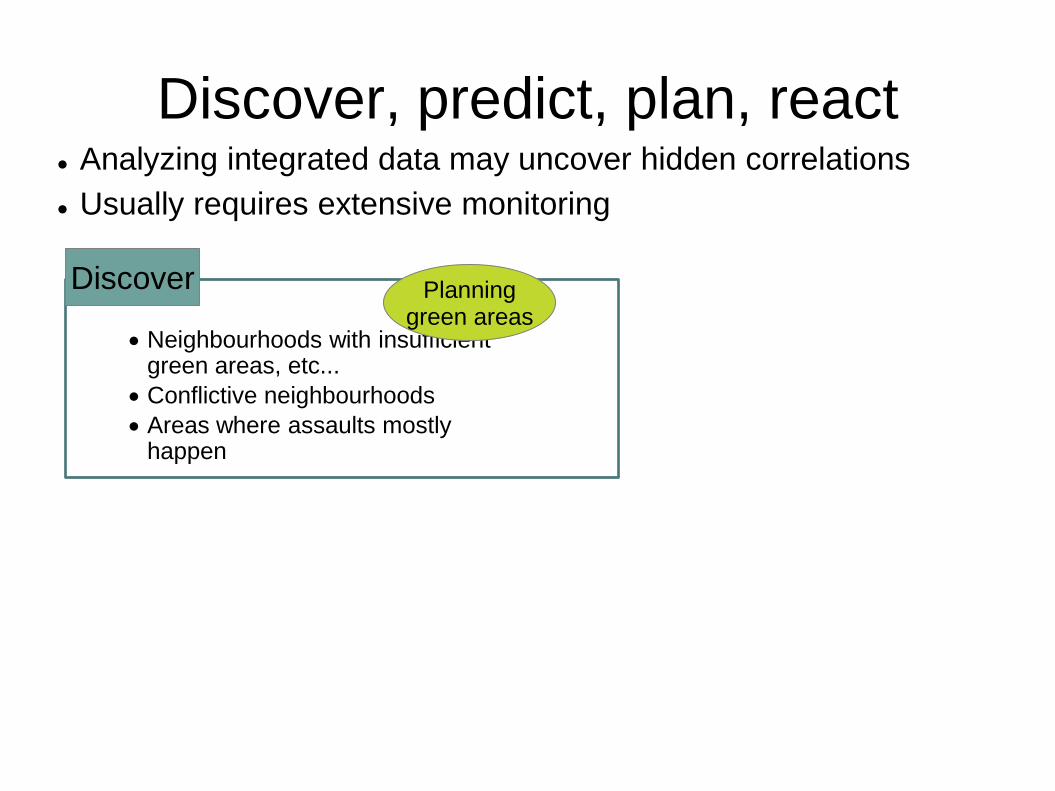
Analyzing integrated data may uncover hidden correlations
Usually requires extensive monitoring
Discover, predict, plan, react
Neighbourhoods with insufficient green areas, etc...
Conflictive neighbourhoods
Areas where assaults mostly happen
Discover
Discover, predict, plan, react
Neighbourhoods with insufficient green areas, etc...
Conflictive neighbourhoods
Areas where assaults mostly happen
Planning green areas
Analyzing integrated data may uncover hidden correlations
Usually requires extensive monitoring
Discover

... less racially mixed
… have low density of population in the streets
… at night when (1) single person waiting (2) bus stop hidden from camera view (3) in tourist neighborhood ...etc … different behavior may be suspicious
Discover, predict, plan, react Analyzing integrated data may uncover hidden correlations
Usually requires extensive monitoring
Neighbourhoods with insufficient green areas, etc...
Conflictive neighbourhoods
Areas where assaults mostly happen
Planning green areas
Predict
Discover

... less racially mixed
… have low density of population in the streets
Predict
… at night when (1) single person waiting (2) bus stop hidden from camera view (3) in tourist neighborhood ...etc … different behavior may be suspicious
Long-term demographic mix, preventive security
Discover, predict, plan, react
Neighbourhoods with insufficient green areas, etc...
Conflictive neighbourhoods
Areas where assaults mostly happen
Planning green areas
Analyzing integrated data may uncover hidden correlations
Usually requires extensive monitoring
Discover

... less racially mixed
… have low density of population in the streets
Predict
… at night when (1) single person waiting (2) bus stop hidden from camera view (3) in tourist neighborhood ...etc … different behavior may be suspicious
Long-term demographic mix, preventive security
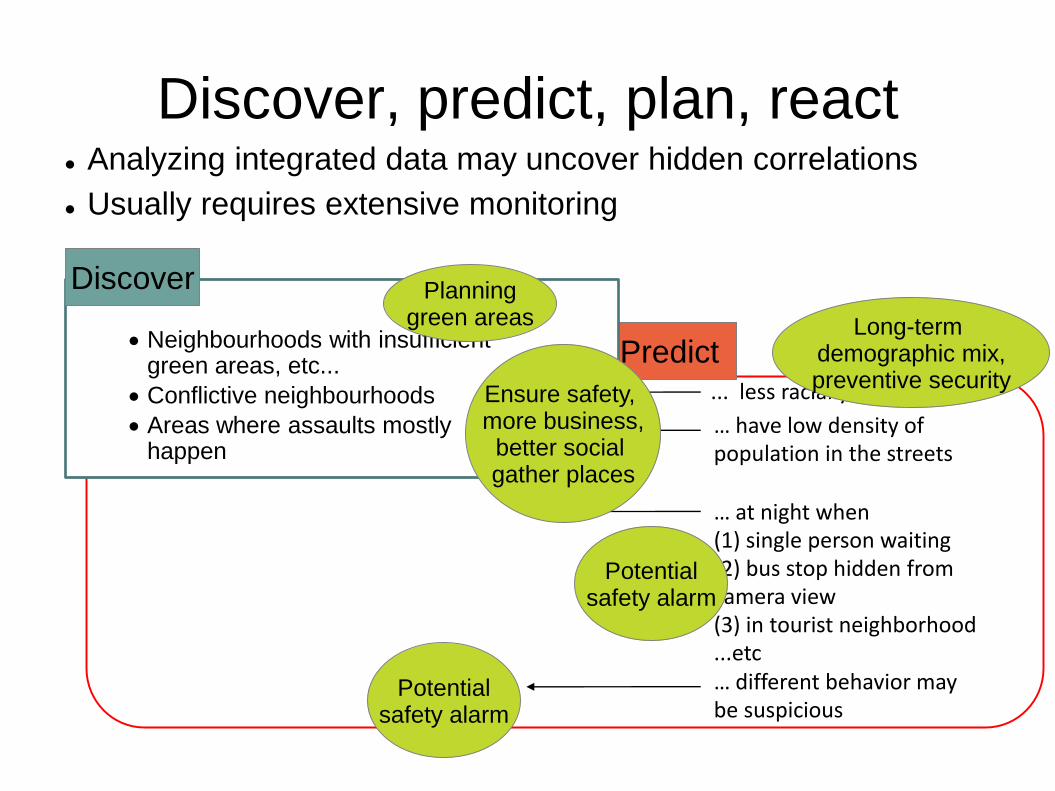
Discover, predict, plan, react
Neighbourhoods with insufficient green areas, etc...
Conflictive neighbourhoods
Areas where assaults mostly happen
Ensure safety, more business, better social gather places
Planning green areas
Analyzing integrated data may uncover hidden correlations
Usually requires extensive monitoring
Discover

... less racially mixed
… have low density of population in the streets
Predict
… at night when (1) single person waiting (2) bus stop hidden from camera view (3) in tourist neighborhood ...etc … different behavior may be suspicious
Potential safety alarm
Long-term demographic mix, preventive security
Discover, predict, plan, react Analyzing integrated data may uncover hidden correlations
Usually requires extensive monitoring
Neighbourhoods with insufficient green areas, etc...
Conflictive neighbourhoods
Areas where assaults mostly happen
Planning green areas
Ensure safety, more business, better social gather places
Discover
... less racially mixed
… have low density of population in the streets
Predict
… at night when (1) single person waiting (2) bus stop hidden from camera view (3) in tourist neighborhood ...etc … different behavior may be suspicious
Potential safety alarm
Long-term demographic mix, preventive security
Potential safety alarm
Discover, predict, plan, react Analyzing integrated data may uncover hidden correlations
Usually requires extensive monitoring
Neighbourhoods with insufficient green areas, etc...
Conflictive neighbourhoods
Areas where assaults mostly happen
Ensure safety, more business, better social gather places
Planning green areas
Discover

How should smart infrastructure be integrated to make a Smart City truly smart?
What does this mean for the organization of our city governments?
How do we find guidelines to understand the architecture of integrated infrastructures?