Embed Size (px)
Citation preview
1
2017/06/20
Future Architect, Inc.
Hisashi Hibino
Security Threat Analysis Points for Enterprise with OSS

2
Hibino Hisashi
Employee at
Future Architect Inc.
Technology Innovation Group
Security Architect
Fields:
Server
OS
Database
Application
Network
Data Center
Secu
rity

3
× Security

4
Elastic Stack + X-Pack
Kibana
Elasticsearch
Logstash Beats
Elastic Cloud
Alert
Performance
Monitoring
Graph
Security
X-Pack
Elastic Stack (Open Source)
Paid Subscription Machine Learning
Report
Normalization
Save/Store
Visualization Authorization
/Encryption
Notification
Correlation
Analysis
Anomaly
Detection
These are the functions useful for security threat analysis with Elastic.
Collect
5
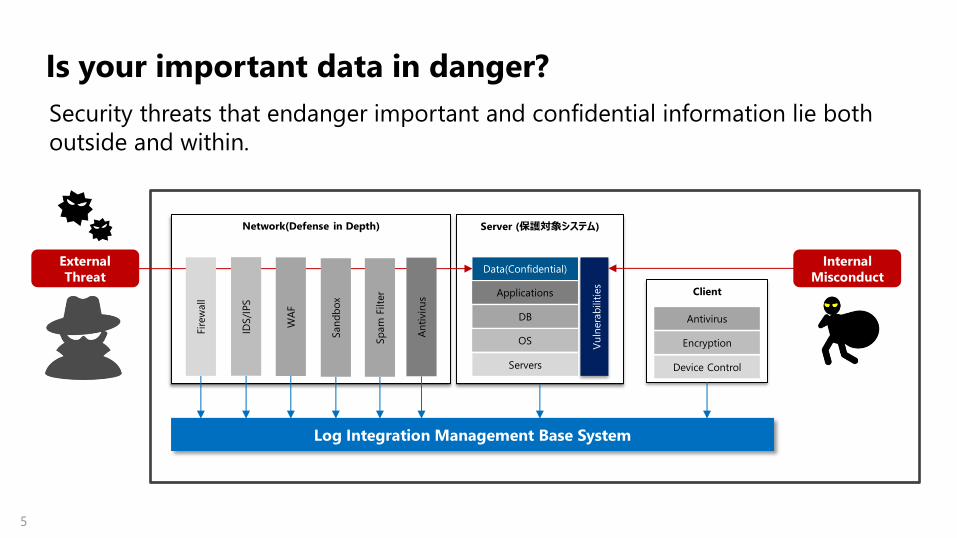
Is your important data in danger?
Security threats that endanger important and confidential information lie both
outside and within.
Server (保護対象システム)
External
Threat
Internal
Misconduct
Servers
OS
DB
Applications
Vu
lnera
bilit
ies
Data(Confidential)
Network(Defense in Depth)
Log Integration Management Base System
Fir
ew
all
IDS/I
PS
WA
F
An
tivir
us
San
db
ox
Sp
am
Filte
r Client
Device Control
Encryption
Antivirus
6
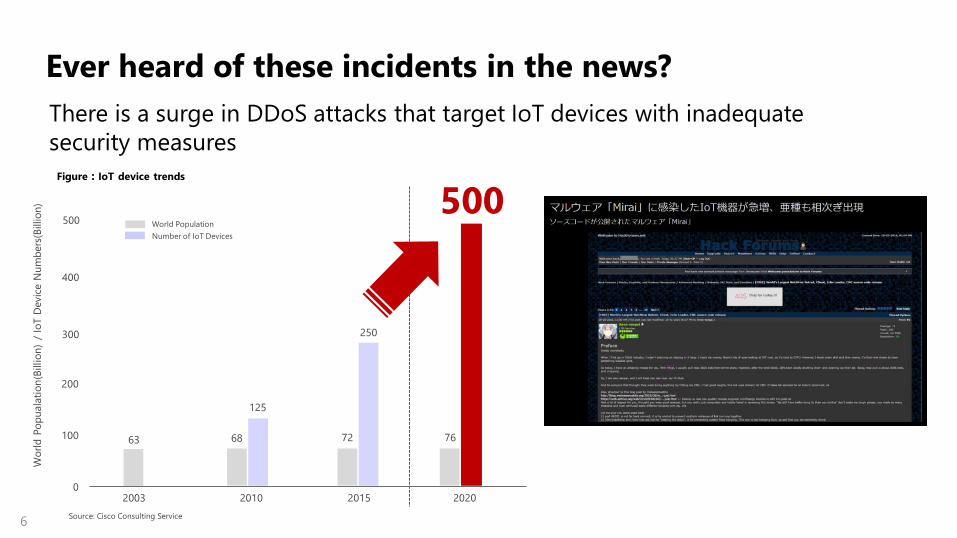
Ever heard of these incidents in the news?
There is a surge in DDoS attacks that target IoT devices with inadequate
security measures
2003 2010 2015 2020 0
63 68
125
250
500 Figure:IoT device trends
100
200
300
400
500
72 76
Source: Cisco Consulting Service
Wo
rld
Po
pu
ala
tio
n(B
illio
n)
/ Io
T D
evic
e N
um
bers
(Billio
n)
World Population
Number of IoT Devices
7
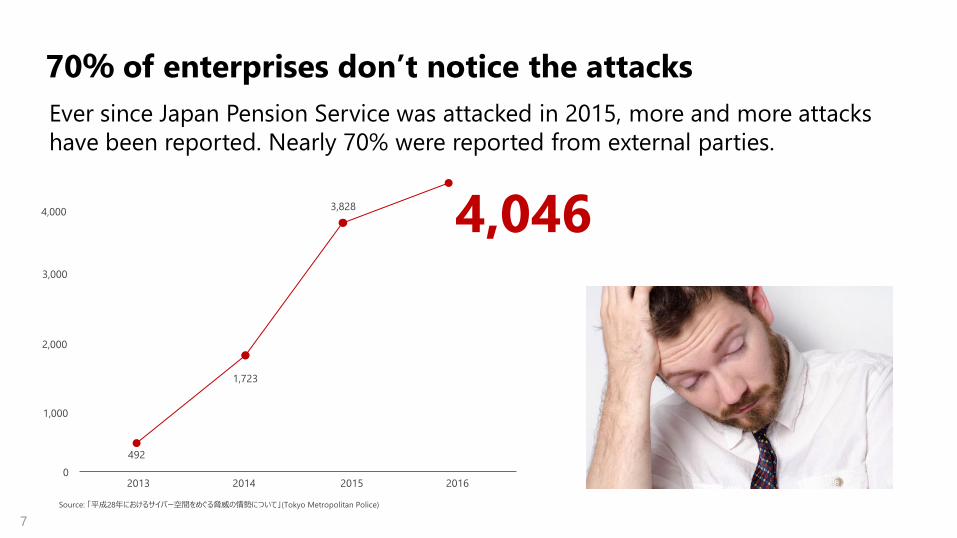
70% of enterprises don’t notice the attacks
Ever since Japan Pension Service was attacked in 2015, more and more attacks
have been reported. Nearly 70% were reported from external parties.
2013 2014 2015 2016 0
Source: 「平成28年におけるサイバー空間をめぐる脅威の情勢について」(Tokyo Metropolitan Police)
492
1,723
4,046
1,000
2,000
3,000
4,000 3,828

8
And now to our main topic!
Enough with the introduction, and on to what you can do with Elastic Stack to
counter internal and external security threats.
1.External Threats
→Defense against Targeted Threats on Servers
2.Internal Threats
→Defense against illegal acquisition of
Specific Personal Information
9
Internal
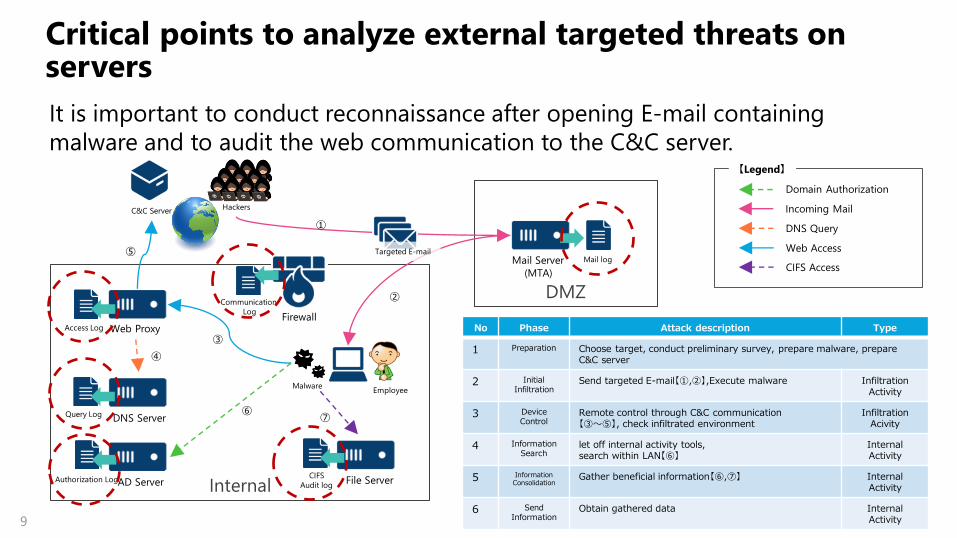
Critical points to analyze external targeted threats on servers
It is important to conduct reconnaissance after opening E-mail containing
malware and to audit the web communication to the C&C server.
Firewall
DNS Server
Mail Server
(MTA)
AD Server
Malware
Hackers C&C Server
DMZ
Employee
Web Proxy Access Log
Query Log
Mail log
Communication
Log
Authorization Log
①
⑥
③
②
④
⑤
No Phase Attack description Type
1 Preparation Choose target, conduct preliminary survey, prepare malware, prepare C&C server
2 Initial Infiltration
Send targeted E-mail【①,②】,Execute malware Infiltration Activity
3 Device Control
Remote control through C&C communication 【③~⑤】, check infiltrated environment
Infiltration Acivity
4 Information Search
let off internal activity tools, search within LAN【⑥】
Internal Activity
5 Information Consolidation
Gather beneficial information【⑥,⑦】 Internal Activity
6 Send Information
Obtain gathered data Internal Activity
Targeted E-mail
File Server CIFS
Audit log
⑦
Incoming Mail
Domain Authorization
DNS Query
Web Access
【Legend】
CIFS Access
10
Application
Server
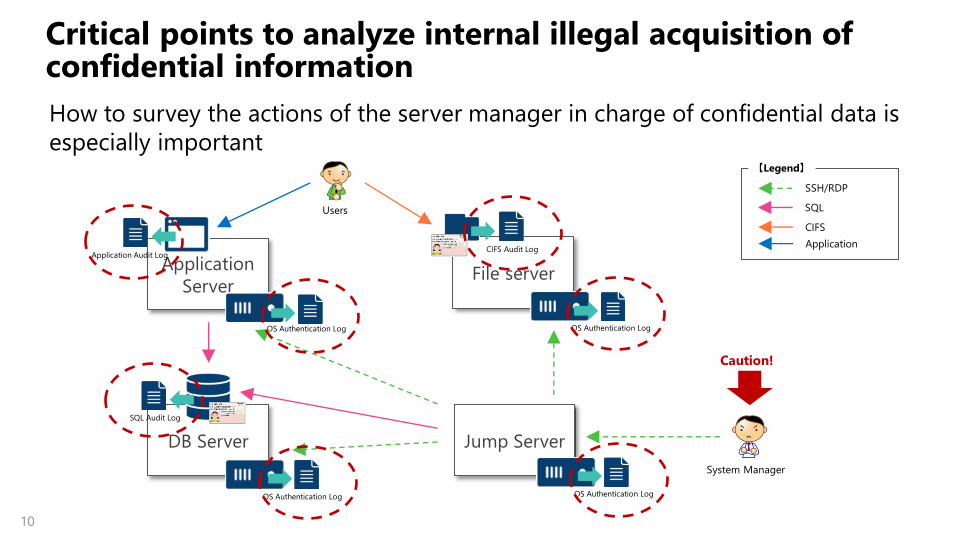
Critical points to analyze internal illegal acquisition of confidential information
How to survey the actions of the server manager in charge of confidential data is
especially important
Jump Server DB Server
File server
OS Authentication Log
OS Authentication Log OS Authentication Log
SQL Audit Log
CIFS Audit Log
OS Authentication Log
System Manager
Users SQL
SSH/RDP
CIFS
Application
【Legend】
Application Audit Log
Caution!
11
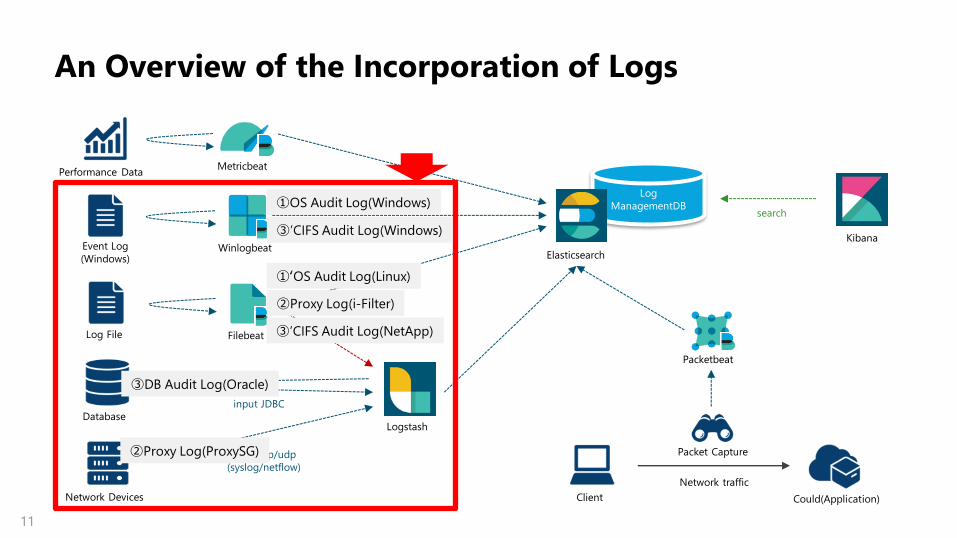
An Overview of the Incorporation of Logs
Log
ManagementDB
Log File
Database
Network Devices
Performance Data
Event Log
(Windows)
Metricbeat
Filebeat
Winlogbeat
Logstash
input JDBC
input tcp/udp
(syslog/netflow)
Client Could(Application)
Network traffic
Packet Capture
Packetbeat
Kibana
Elasticsearch
【要正規化】
search ①OS Audit Log(Windows)
①‘OS Audit Log(Linux)
②Proxy Log(ProxySG)
②Proxy Log(i-Filter)
③DB Audit Log(Oracle)
③’CIFS Audit Log(NetApp)
③’CIFS Audit Log(Windows)

12
①OS Audit Log

13
Effective utilization of OS Audit Log
Be able to audit all audit logs regardless if it’s internal or external.
Server A
Server B
Server C
Jump Server
System manager
SSH/RDP
①Windows Server: Gather Event logs
②Linux Server: Gather audit.log System A
14
Log
Management DB
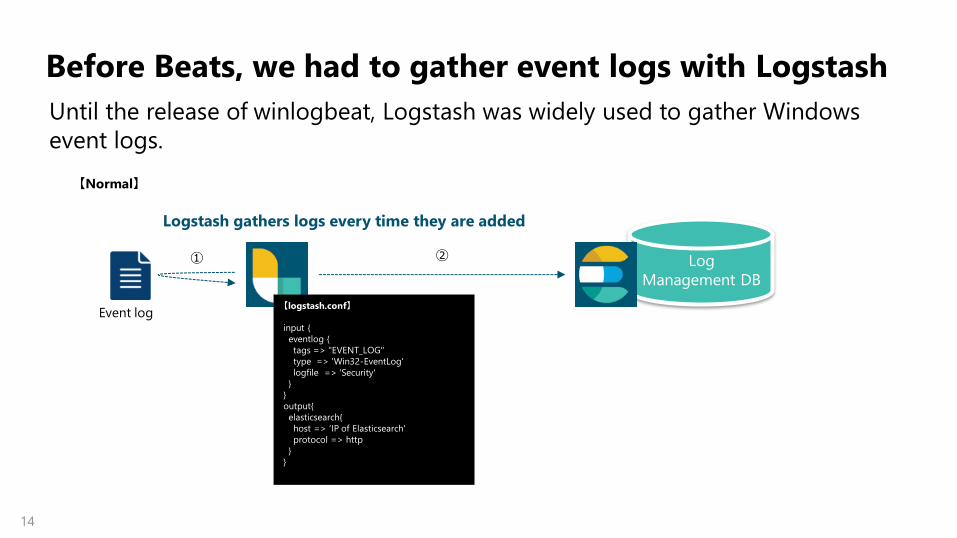
Before Beats, we had to gather event logs with Logstash
Until the release of winlogbeat, Logstash was widely used to gather Windows
event logs.
Event log
【Normal】
① ②
Logstash gathers logs every time they are added
【logstash.conf】
input {
eventlog {
tags => "EVENT_LOG"
type => 'Win32-EventLog'
logfile => 'Security'
}
}
output{
elasticsearch{
host => ‘IP of Elasticsearch'
protocol => http
}
}
15
Log
Management DB
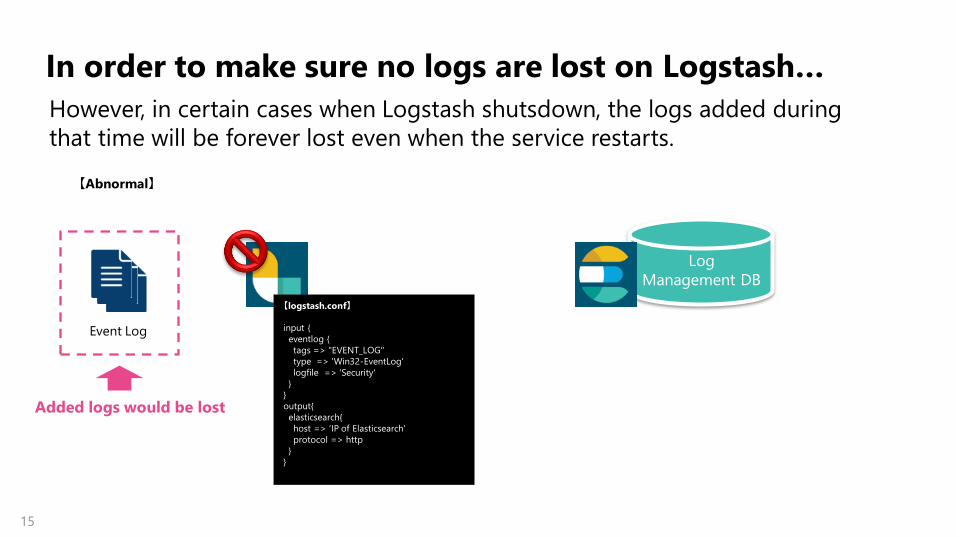
In order to make sure no logs are lost on Logstash…
However, in certain cases when Logstash shutsdown, the logs added during
that time will be forever lost even when the service restarts.
Event Log
【Abnormal】
Added logs would be lost
【logstash.conf】
input {
eventlog {
tags => "EVENT_LOG"
type => 'Win32-EventLog'
logfile => 'Security'
}
}
output{
elasticsearch{
host => ‘IP of Elasticsearch'
protocol => http
}
}
16
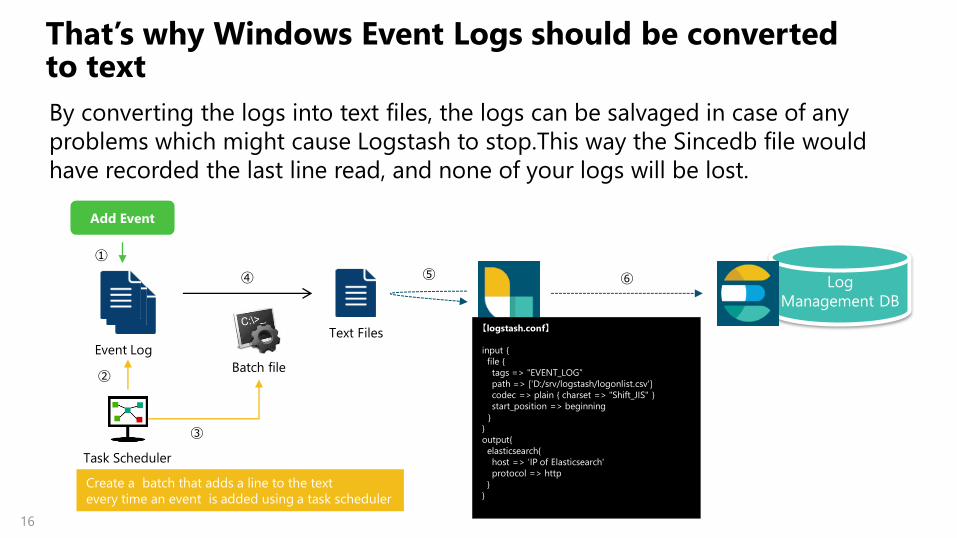
That’s why Windows Event Logs should be converted to text
By converting the logs into text files, the logs can be salvaged in case of any
problems which might cause Logstash to stop.This way the Sincedb file would
have recorded the last line read, and none of your logs will be lost.
Event Log
Add Event
①
Task Scheduler
②
③
Text Files
Batch file
④ Log
Management DB
⑤ ⑥
【logstash.conf】
input {
file {
tags => "EVENT_LOG“
path => ['D:/srv/logstash/logonlist.csv']
codec => plain { charset => "Shift_JIS" }
start_position => beginning
}
}
output{
elasticsearch{
host => ‘IP of Elasticsearch'
protocol => http
}
}
Create a batch that adds a line to the text
every time an event is added using a task scheduler
17
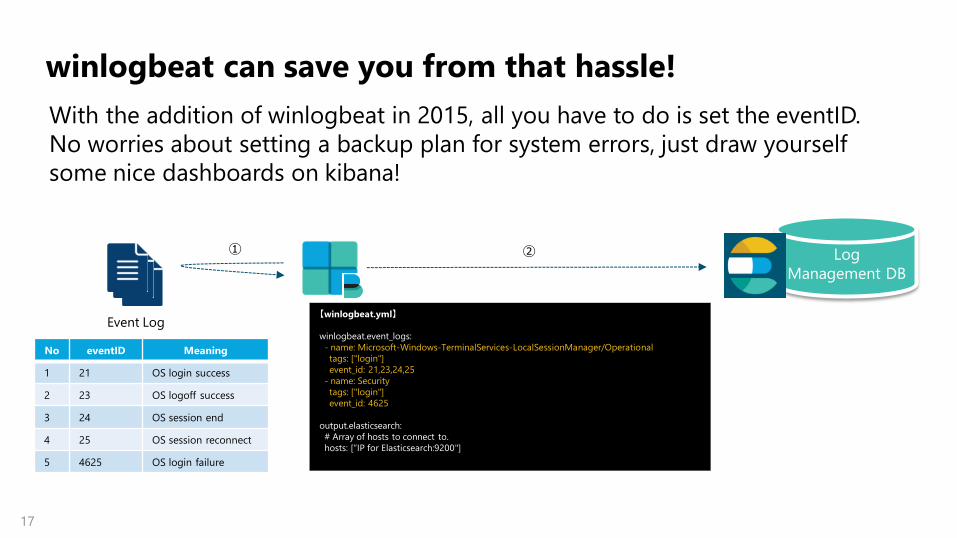
winlogbeat can save you from that hassle!
With the addition of winlogbeat in 2015, all you have to do is set the eventID.
No worries about setting a backup plan for system errors, just draw yourself
some nice dashboards on kibana!
Event Log
① ② Log
Management DB
No eventID Meaning
1 21 OS login success
2 23 OS logoff success
3 24 OS session end
4 25 OS session reconnect
5 4625 OS login failure
【winlogbeat.yml】
winlogbeat.event_logs:
- name: Microsoft-Windows-TerminalServices-LocalSessionManager/Operational
tags: ["login"]
event_id: 21,23,24,25
- name: Security
tags: ["login"]
event_id: 4625
output.elasticsearch:
# Array of hosts to connect to.
hosts: [“IP for Elasticsearch:9200"]
18
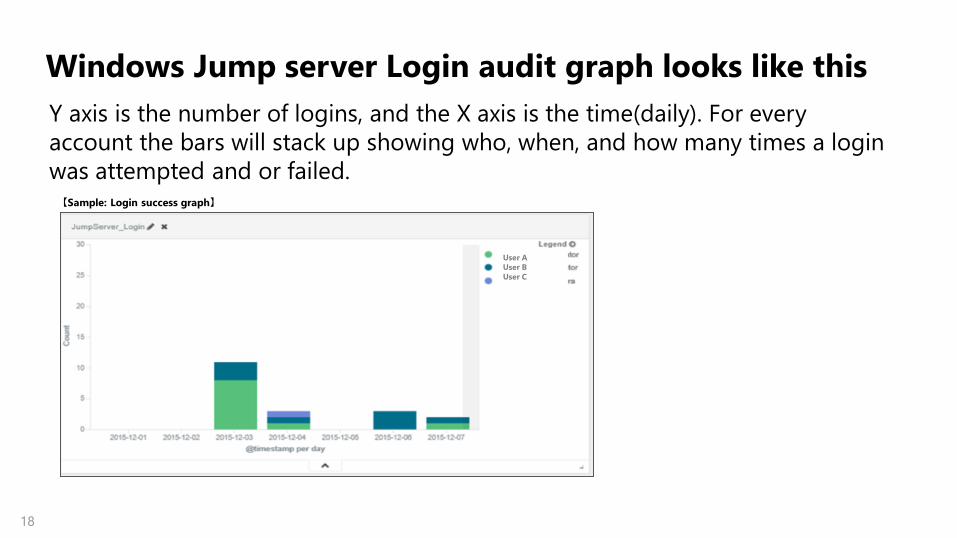
Windows Jump server Login audit graph looks like this
Y axis is the number of logins, and the X axis is the time(daily). For every
account the bars will stack up showing who, when, and how many times a login
was attempted and or failed.
User A
User B
User C
【Sample: Login success graph】
19
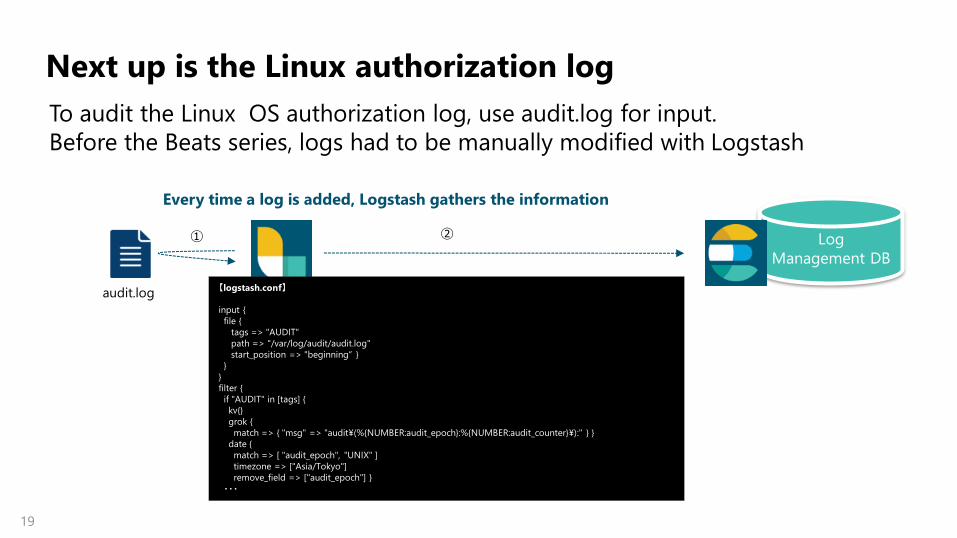
Next up is the Linux authorization log
To audit the Linux OS authorization log, use audit.log for input.
Before the Beats series, logs had to be manually modified with Logstash
Log
Management DB
audit.log
① ②
Every time a log is added, Logstash gathers the information
【logstash.conf】
input {
file {
tags => "AUDIT"
path => "/var/log/audit/audit.log"
start_position => "beginning“ }
}
}
filter {
if "AUDIT" in [tags] {
kv{}
grok {
match => { "msg" => "audit¥(%{NUMBER:audit_epoch}:%{NUMBER:audit_counter}¥):" } }
date {
match => [ "audit_epoch", "UNIX" ]
timezone => ["Asia/Tokyo"]
remove_field => ["audit_epoch"] }
・・・
20
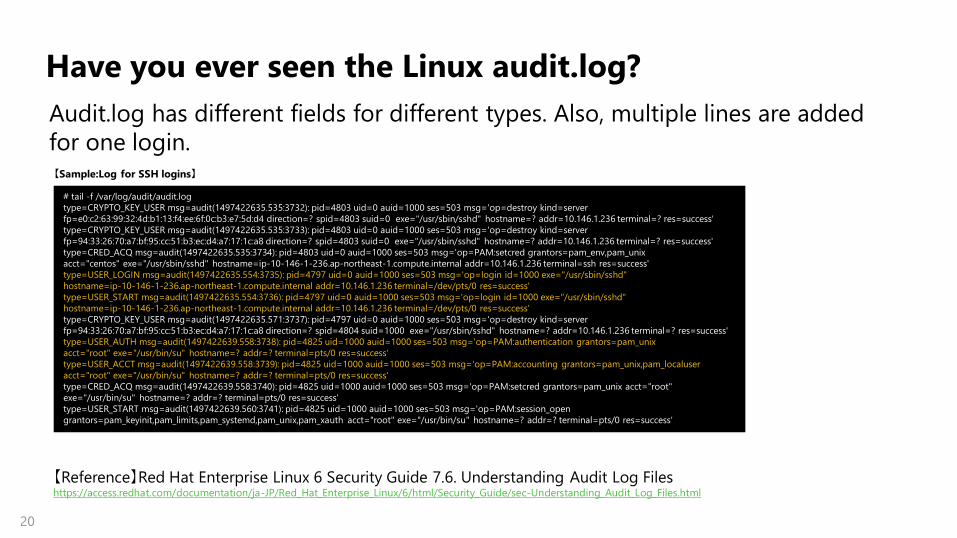
Have you ever seen the Linux audit.log?
Audit.log has different fields for different types. Also, multiple lines are added
for one login.
# tail -f /var/log/audit/audit.log
type=CRYPTO_KEY_USER msg=audit(1497422635.535:3732): pid=4803 uid=0 auid=1000 ses=503 msg='op=destroy kind=server
fp=e0:c2:63:99:32:4d:b1:13:f4:ee:6f:0c:b3:e7:5d:d4 direction=? spid=4803 suid=0 exe="/usr/sbin/sshd" hostname=? addr=10.146.1.236 terminal=? res=success'
type=CRYPTO_KEY_USER msg=audit(1497422635.535:3733): pid=4803 uid=0 auid=1000 ses=503 msg='op=destroy kind=server
fp=94:33:26:70:a7:bf:95:cc:51:b3:ec:d4:a7:17:1c:a8 direction=? spid=4803 suid=0 exe="/usr/sbin/sshd" hostname=? addr=10.146.1.236 terminal=? res=success'
type=CRED_ACQ msg=audit(1497422635.535:3734): pid=4803 uid=0 auid=1000 ses=503 msg='op=PAM:setcred grantors=pam_env,pam_unix
acct="centos" exe="/usr/sbin/sshd" hostname=ip-10-146-1-236.ap-northeast-1.compute.internal addr=10.146.1.236 terminal=ssh res=success'
type=USER_LOGIN msg=audit(1497422635.554:3735): pid=4797 uid=0 auid=1000 ses=503 msg='op=login id=1000 exe="/usr/sbin/sshd"
hostname=ip-10-146-1-236.ap-northeast-1.compute.internal addr=10.146.1.236 terminal=/dev/pts/0 res=success'
type=USER_START msg=audit(1497422635.554:3736): pid=4797 uid=0 auid=1000 ses=503 msg='op=login id=1000 exe="/usr/sbin/sshd"
hostname=ip-10-146-1-236.ap-northeast-1.compute.internal addr=10.146.1.236 terminal=/dev/pts/0 res=success'
type=CRYPTO_KEY_USER msg=audit(1497422635.571:3737): pid=4797 uid=0 auid=1000 ses=503 msg='op=destroy kind=server
fp=94:33:26:70:a7:bf:95:cc:51:b3:ec:d4:a7:17:1c:a8 direction=? spid=4804 suid=1000 exe="/usr/sbin/sshd" hostname=? addr=10.146.1.236 terminal=? res=success'
type=USER_AUTH msg=audit(1497422639.558:3738): pid=4825 uid=1000 auid=1000 ses=503 msg='op=PAM:authentication grantors=pam_unix
acct="root" exe="/usr/bin/su" hostname=? addr=? terminal=pts/0 res=success'
type=USER_ACCT msg=audit(1497422639.558:3739): pid=4825 uid=1000 auid=1000 ses=503 msg='op=PAM:accounting grantors=pam_unix,pam_localuser
acct="root" exe="/usr/bin/su" hostname=? addr=? terminal=pts/0 res=success'
type=CRED_ACQ msg=audit(1497422639.558:3740): pid=4825 uid=1000 auid=1000 ses=503 msg='op=PAM:setcred grantors=pam_unix acct="root"
exe="/usr/bin/su" hostname=? addr=? terminal=pts/0 res=success'
type=USER_START msg=audit(1497422639.560:3741): pid=4825 uid=1000 auid=1000 ses=503 msg='op=PAM:session_open
grantors=pam_keyinit,pam_limits,pam_systemd,pam_unix,pam_xauth acct="root" exe="/usr/bin/su" hostname=? addr=? terminal=pts/0 res=success‘
【Reference】Red Hat Enterprise Linux 6 Security Guide 7.6. Understanding Audit Log Files https://access.redhat.com/documentation/ja-JP/Red_Hat_Enterprise_Linux/6/html/Security_Guide/sec-Understanding_Audit_Log_Files.html
【Sample:Log for SSH logins】
21
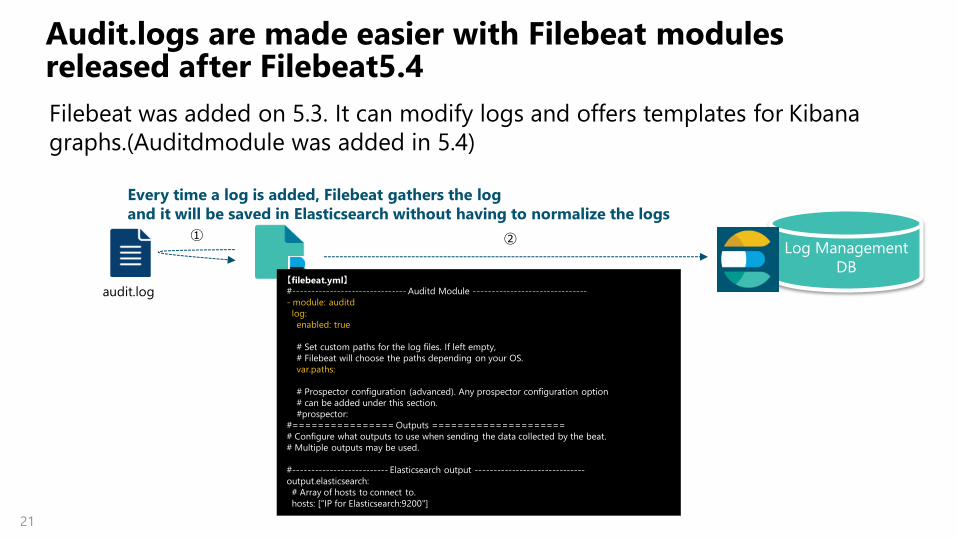
Audit.logs are made easier with Filebeat modules released after Filebeat5.4
Filebeat was added on 5.3. It can modify logs and offers templates for Kibana
graphs.(Auditdmodule was added in 5.4)
audit.log
① ②
Every time a log is added, Filebeat gathers the log
and it will be saved in Elasticsearch without having to normalize the logs
【filebeat.yml】 #------------------------------- Auditd Module -------------------------------
- module: auditd
log:
enabled: true
# Set custom paths for the log files. If left empty,
# Filebeat will choose the paths depending on your OS.
var.paths:
# Prospector configuration (advanced). Any prospector configuration option
# can be added under this section.
#prospector:
#================ Outputs =====================
# Configure what outputs to use when sending the data collected by the beat.
# Multiple outputs may be used.
#-------------------------- Elasticsearch output ------------------------------
output.elasticsearch:
# Array of hosts to connect to.
hosts: [“IP for Elasticsearch:9200"]
Log Management
DB

22
Now, Kibana offers template graphs for your logs
Timelion will show a correlation graph of login successes and failures
23
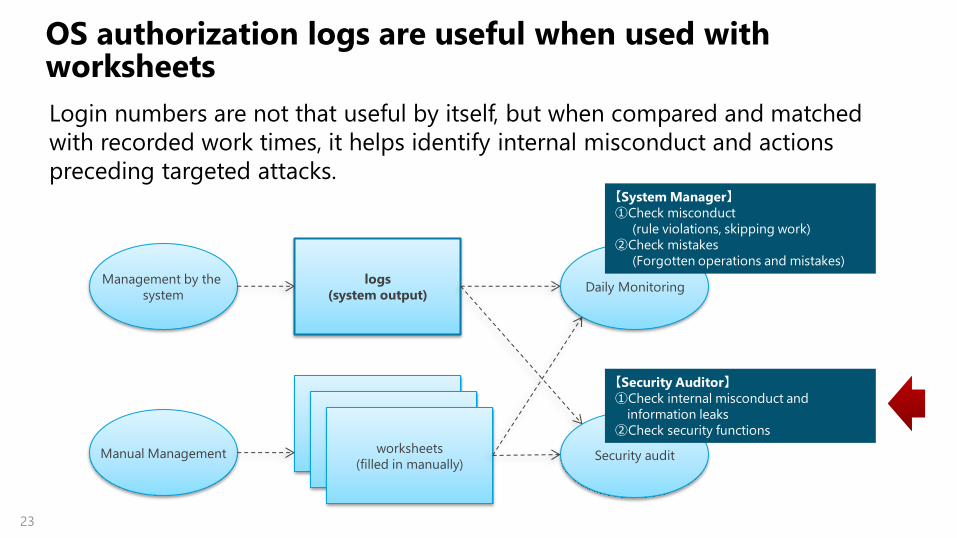
OS authorization logs are useful when used with worksheets
Login numbers are not that useful by itself, but when compared and matched
with recorded work times, it helps identify internal misconduct and actions
preceding targeted attacks.
Management by the
system
Manual Management
logs
(system output)
worksheets
(filled in manually)
Daily Monitoring
Security audit
【System Manager】 ①Check misconduct
(rule violations, skipping work)
②Check mistakes
(Forgotten operations and mistakes)
【Security Auditor】 ①Check internal misconduct and
information leaks
②Check security functions

24
②Proxy Logs
25
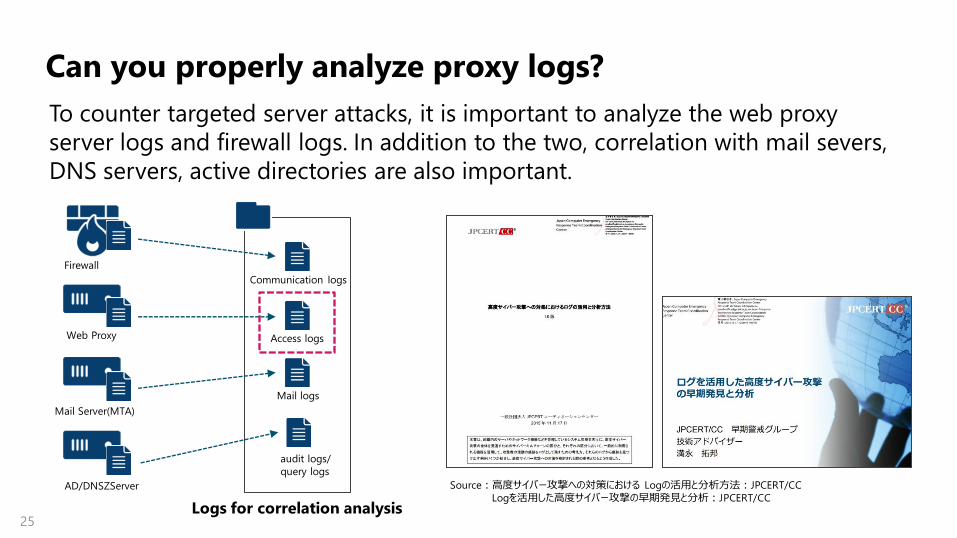
Can you properly analyze proxy logs?
To counter targeted server attacks, it is important to analyze the web proxy
server logs and firewall logs. In addition to the two, correlation with mail severs,
DNS servers, active directories are also important.
Source:高度サイバー攻撃への対策における Logの活用と分析方法:JPCERT/CC
Logを活用した高度サイバー攻撃の早期発見と分析:JPCERT/CC
Firewall
Web Proxy
Mail Server(MTA)
AD/DNSZServer
Communication logs
Access logs
Mail logs
audit logs/
query logs
Logs for correlation analysis
26
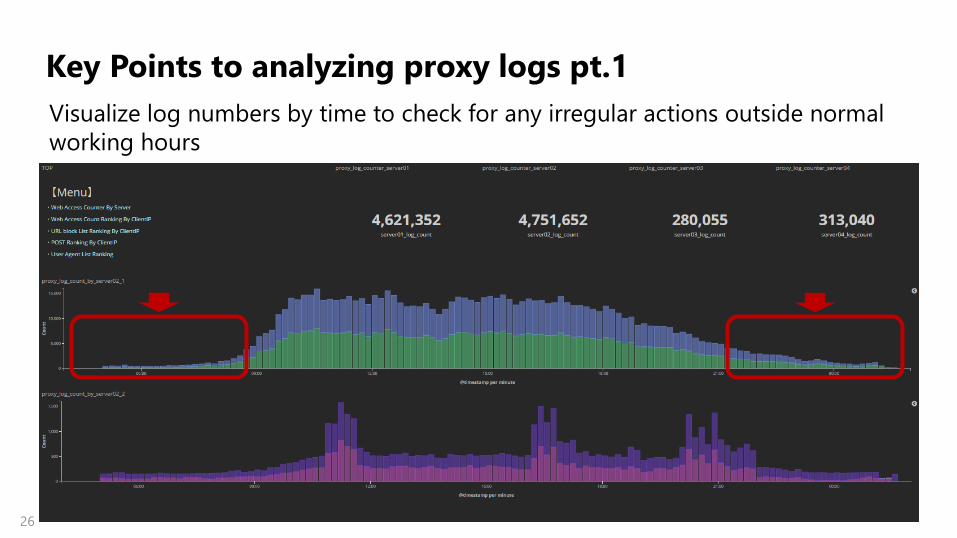
Key Points to analyzing proxy logs pt.1
Visualize log numbers by time to check for any irregular actions outside normal
working hours
27
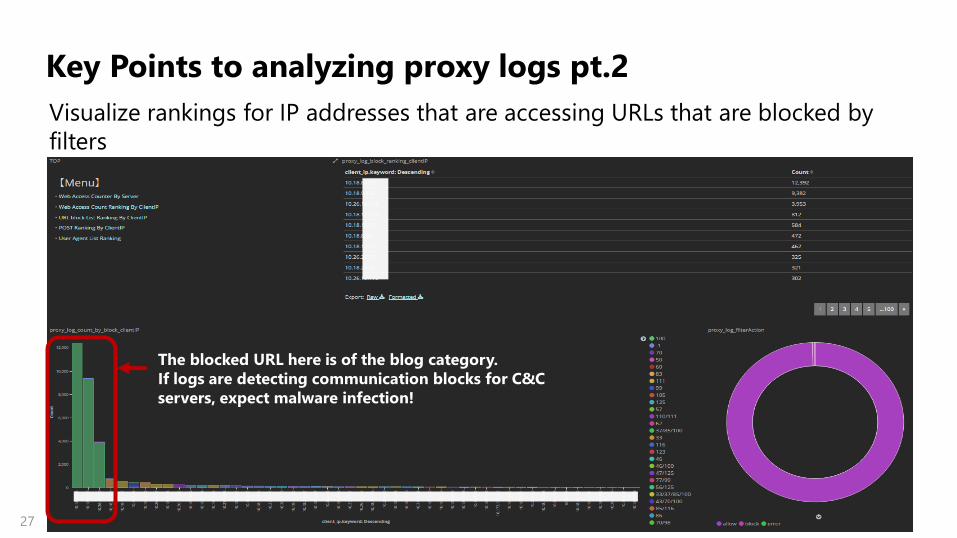
Key Points to analyzing proxy logs pt.2
Visualize rankings for IP addresses that are accessing URLs that are blocked by
filters
The blocked URL here is of the blog category.
If logs are detecting communication blocks for C&C
servers, expect malware infection!

28
Key Points to analyzing proxy logs pt.3
Visualize HTTP request size to POST and the number of files by rank according
to IP addresses
Are there any large data sent out externally?
Are there small data sent out but large numbers
of access to the C&C server?
Be prepared to audit these information!
29
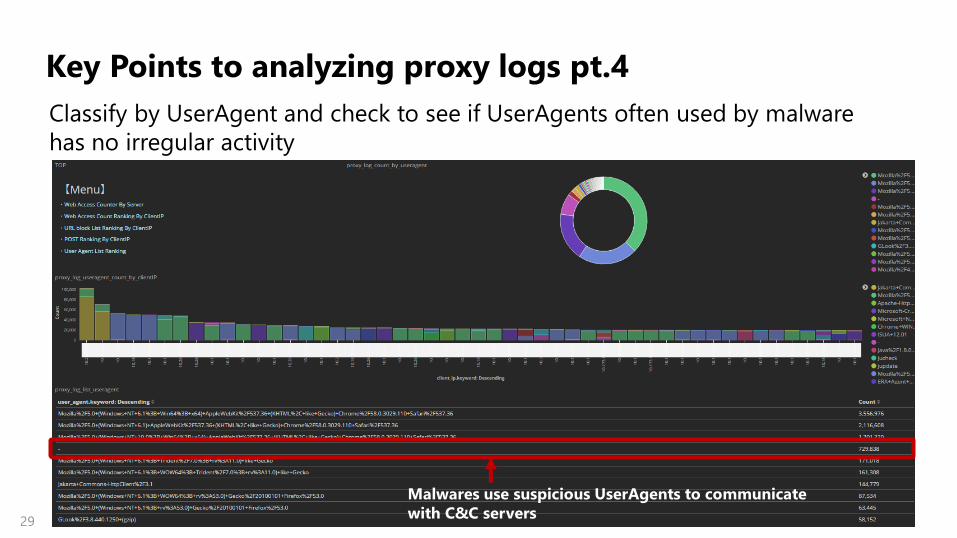
Key Points to analyzing proxy logs pt.4
Classify by UserAgent and check to see if UserAgents often used by malware
has no irregular activity
Malwares use suspicious UserAgents to communicate
with C&C servers

30
How to incorporate proxy logs
Below is an idea of how to incorporate proxy logs from ProxySG and i-Filter
Log
Management DB
rsyslog
ProxySG
i-Filter
syslog
Access log
(CSV)
Access log
(CSV)
input file
input beats
Normalize logs with filter csv
31
③DB Audit Log/
CIFS Audit Log
32
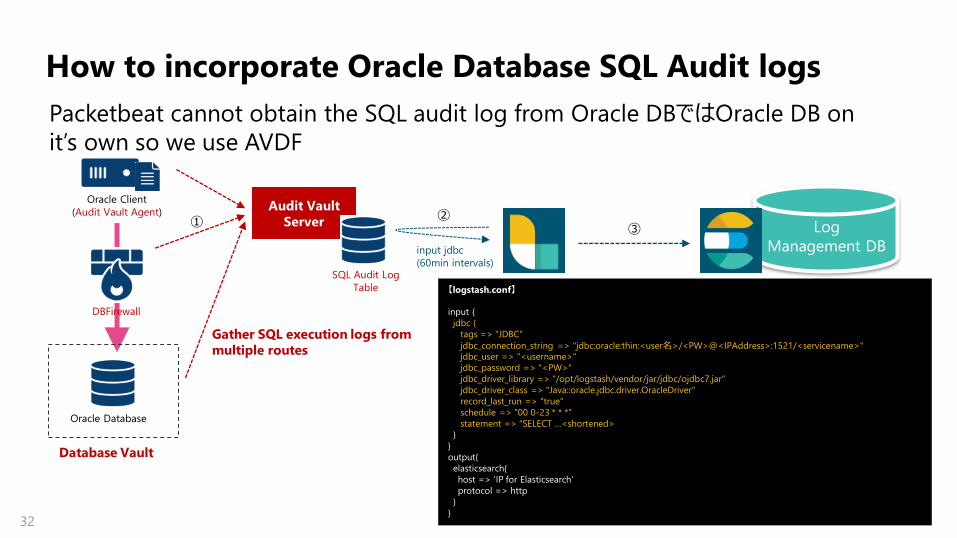
How to incorporate Oracle Database SQL Audit logs
Packetbeat cannot obtain the SQL audit log from Oracle DBではOracle DB on
it’s own so we use AVDF
Log
Management DB input jdbc
(60min intervals)
DBFirewall
Audit Vault
Server
Oracle Database
Database Vault
Oracle Client
(Audit Vault Agent)
【logstash.conf】
input {
jdbc {
tags => "JDBC"
jdbc_connection_string => "jdbc:oracle:thin:<user名>/<PW>@<IPAddress>:1521/<servicename>" jdbc_user => "<username>"
jdbc_password => "<PW>"
jdbc_driver_library => "/opt/logstash/vendor/jar/jdbc/ojdbc7.jar"
jdbc_driver_class => "Java::oracle.jdbc.driver.OracleDriver"
record_last_run => "true"
schedule => "00 0-23 * * *"
statement => "SELECT …<shortened>
}
}
output{
elasticsearch{
host => ‘IP for Elasticsearch'
protocol => http
}
}
SQL Audit Log
Table
Gather SQL execution logs from
multiple routes
① ②
③
33
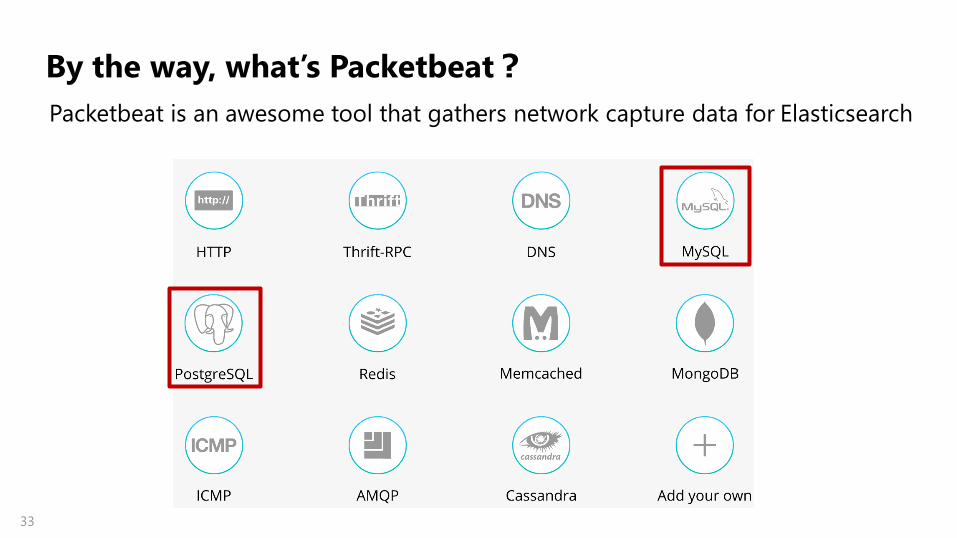
By the way, what’s Packetbeat?
Packetbeat is an awesome tool that gathers network capture data for Elasticsearch
34
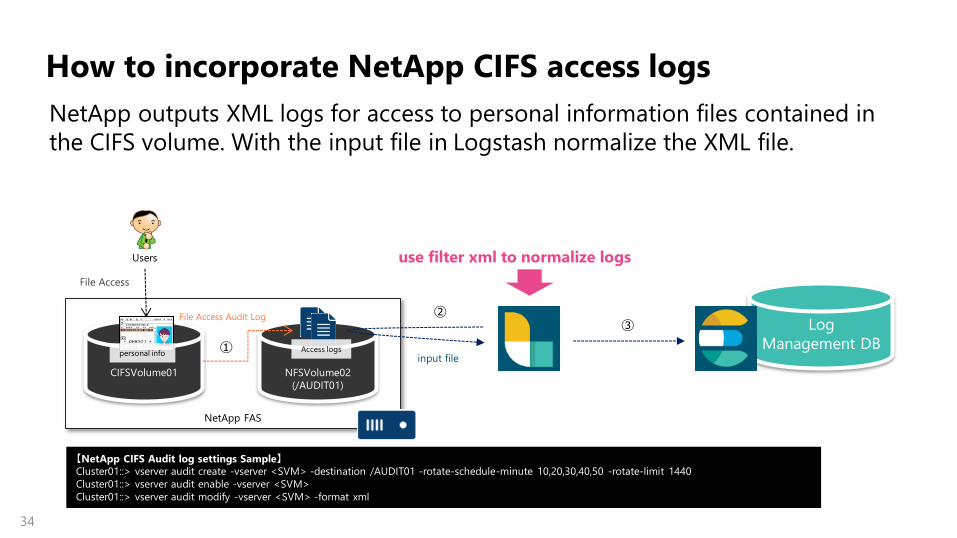
How to incorporate NetApp CIFS access logs
NetApp outputs XML logs for access to personal information files contained in
the CIFS volume. With the input file in Logstash normalize the XML file.
NetApp FAS
NASボリューム02
Users
File Access
CIFSVolume01 NFSVolume02
(/AUDIT01)
personal info
File Access Audit Log Log
Management DB input file
use filter xml to normalize logs
Access logs
【NetApp CIFS Audit log settings Sample】
Cluster01::> vserver audit create -vserver <SVM> -destination /AUDIT01 -rotate-schedule-minute 10,20,30,40,50 -rotate-limit 1440
Cluster01::> vserver audit enable -vserver <SVM>
Cluster01::> vserver audit modify -vserver <SVM> -format xml
①
② ③

35
NetApp CIFS Access Log Logstash 「XML filter」
filter {
xml {
source => "message"
store_xml => false
xpath => [
"/Event/System/EventID/text()","EventID",
"/Event/System/EventName/text()", "Event_Name",
"/Event/System/Source/text()", "Source",
"/Event/System/Opcode/text()", "Opcode",
"/Event/System/Result/text()", "Result",
"/Event/System/TimeCreated/@SystemTime","TimeCreated",
"/Event/System/Channel/text()", "Channel",
"/Event/System/Computer/text()", "Computer",
"/Event/EventData/Data[@Name='SubjectIP']/text()","SubjectIP",
"/Event/EventData/Data/@Uid","Uid",
"/Event/EventData/Data/@Gid","Gid",
"/Event/EventData/Data/@Local","Local",
"/Event/EventData/Data[@Name='SubjectUserid']/text()","SubjectUserSid",
"/Event/EventData/Data[@Name='SubjectUserIsLocal']/text()","SubjectUserIsLocal",
"/Event/EventData/Data[@Name='SubjectDomainName']/text()","SubjectDomainName",
"/Event/EventData/Data[@Name='SubjectUserName']/text()","SubjectUserName",
"/Event/EventData/Data[@Name='ObjectServer']/text()","ObjectServer",
"/Event/EventData/Data[@Name='ObjectType']/text()","ObjectType",
"/Event/EventData/Data[@Name='HandleID']/text()","HandleID",
"/Event/EventData/Data[@Name='ObjectName']/text()","ObjectName",
"/Event/EventData/Data[@Name='AccessList']/text()","AccessList",
"/Event/EventData/Data[@Name='AccessMask']/text()","AccessMask",
"/Event/EventData/Data[@Name='DesiredAccess']/text()","DesiredAccess",
"/Event/EventData/Data[@Name='Attributes']/text()","Attributes",
"/Event/EventData/Data[@Name='SearchPattern']/text()","SearchPattern",
"/Event/EventData/Data[@Name='InformationRequested']/text()","InfoReq",
"/Event/EventData/Data[@Name='OldPath']/text()","OldPath",
"/Event/EventData/Data[@Name='NewPath']/text()","NewPath",
"/Event/EventData/Data[@Name='InformationSet']/text()","InfoSet",
"/Event/EventData/Data[@Name='SearchFilter']/text()","SearchFilter",
"/Event/EventData/Data[@Name='ReadOffset']/text()","ReadOffset",
"/Event/EventData/Data[@Name='ReadCount']/text()","ReadCount"
]
}
}
36
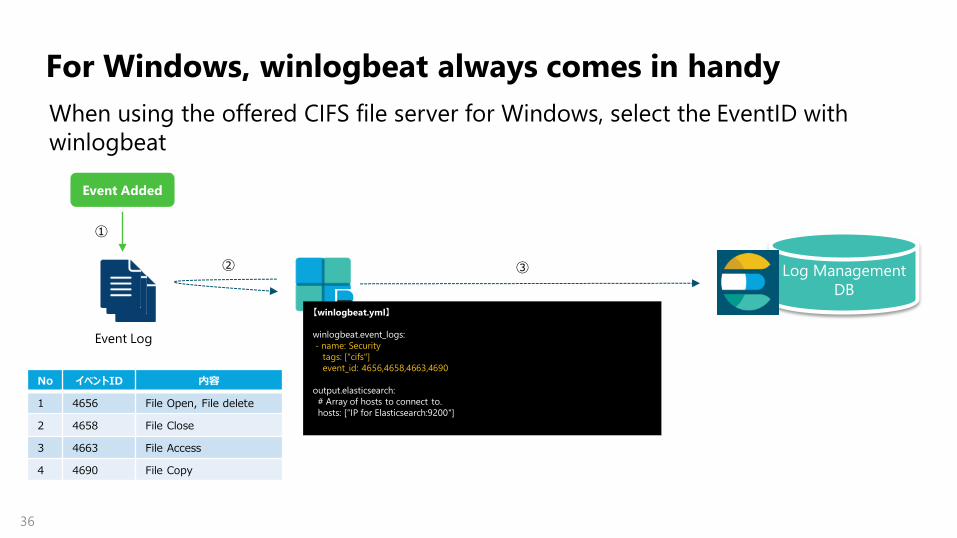
For Windows, winlogbeat always comes in handy
Event Log
Event Added
①
② ③ Log Management
DB
No イベントID 内容
1 4656 File Open, File delete
2 4658 File Close
3 4663 File Access
4 4690 File Copy
【winlogbeat.yml】
winlogbeat.event_logs:
- name: Security
tags: ["cifs"]
event_id: 4656,4658,4663,4690
output.elasticsearch:
# Array of hosts to connect to.
hosts: [“IP for Elasticsearch:9200"]
When using the offered CIFS file server for Windows, select the EventID with
winlogbeat
37
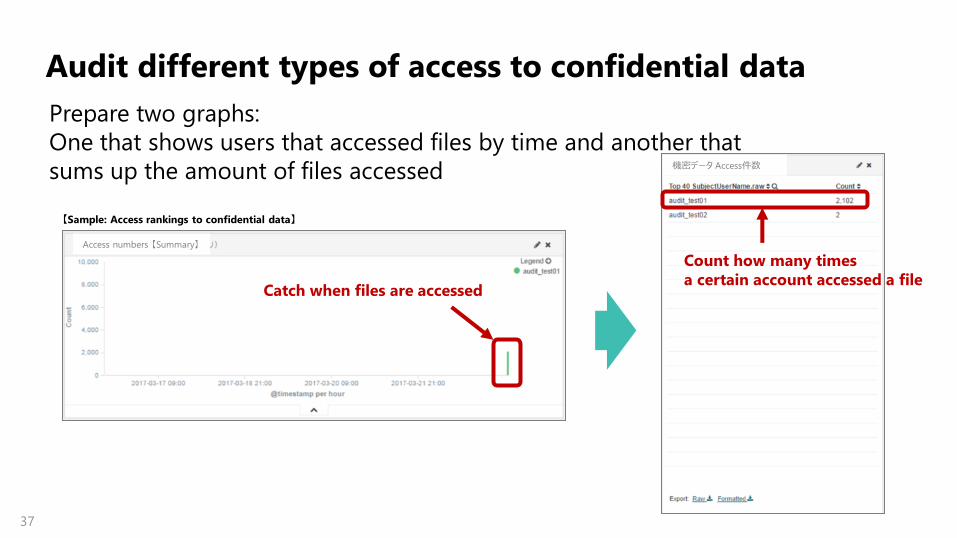
Audit different types of access to confidential data
Prepare two graphs:
One that shows users that accessed files by time and another that
sums up the amount of files accessed
Access numbers 【Summary】
機密データ Access件数
Catch when files are accessed
Count how many times
a certain account accessed a file
【Sample: Access rankings to confidential data】
38
Summary
Elasticsearch is useful for mission critical systems such as financial
organizations and public service systems Elastic Stack is capable of auditing everyday logs and for security auditing tasks.
It is important to start small and gather the minimum and prioritize logs to begin with.
Functions that the OSS can’t cover can be easily covered with X-Pack afterwards.
Just thinking about logs won’t count Imagine what sort of security management to have.
Create an architecture that would minimize the operation costs
Include Elastic Stack as part of that architecture
39
Appendix
40
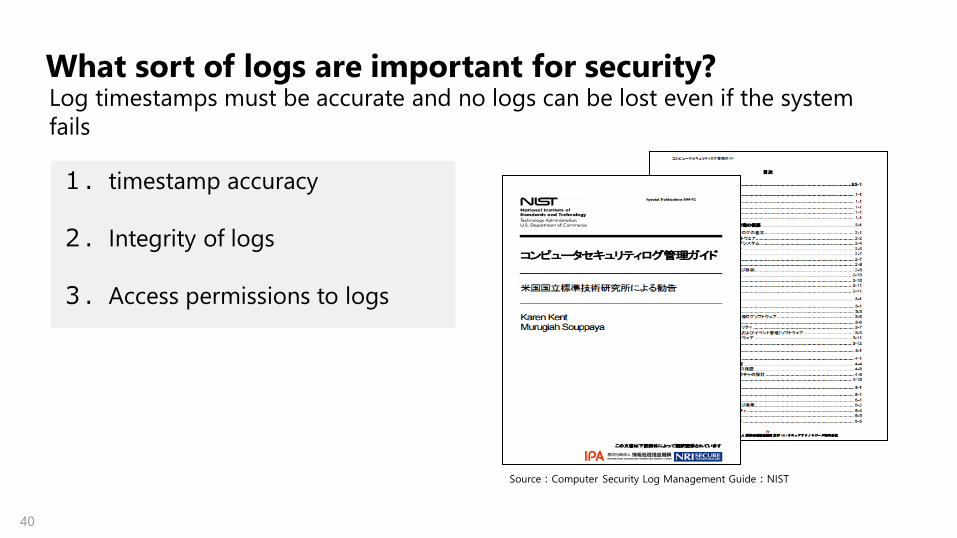
What sort of logs are important for security?
1.timestamp accuracy
2.Integrity of logs
3.Access permissions to logs
Source:Computer Security Log Management Guide:NIST
Log timestamps must be accurate and no logs can be lost even if the system
fails
41
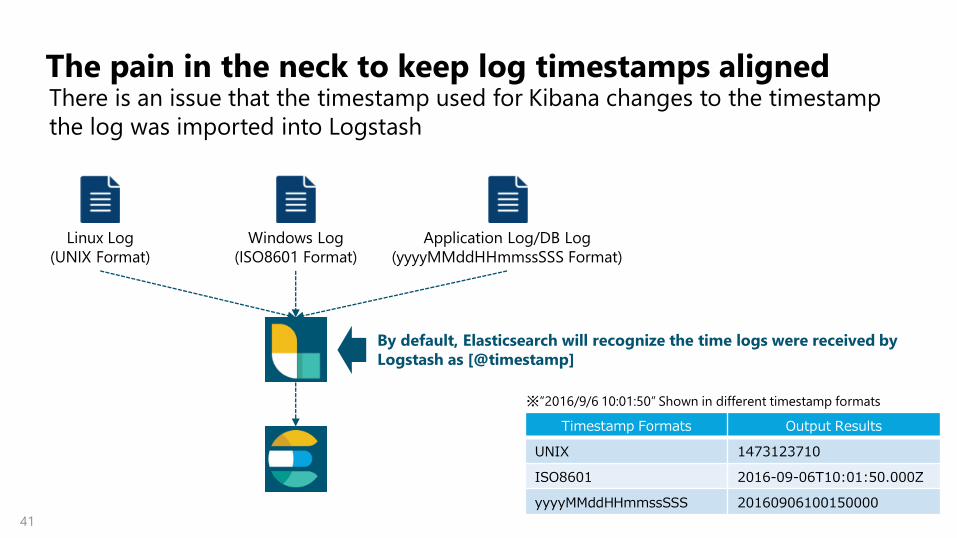
The pain in the neck to keep log timestamps aligned
Linux Log
(UNIX Format)
Windows Log
(ISO8601 Format)
Application Log/DB Log
(yyyyMMddHHmmssSSS Format)
By default, Elasticsearch will recognize the time logs were received by
Logstash as [@timestamp]
Timestamp Formats Output Results
UNIX 1473123710
ISO8601 2016-09-06T10:01:50.000Z
yyyyMMddHHmmssSSS 20160906100150000
※”2016/9/6 10:01:50” Shown in different timestamp formats
There is an issue that the timestamp used for Kibana changes to the timestamp
the log was imported into Logstash
42
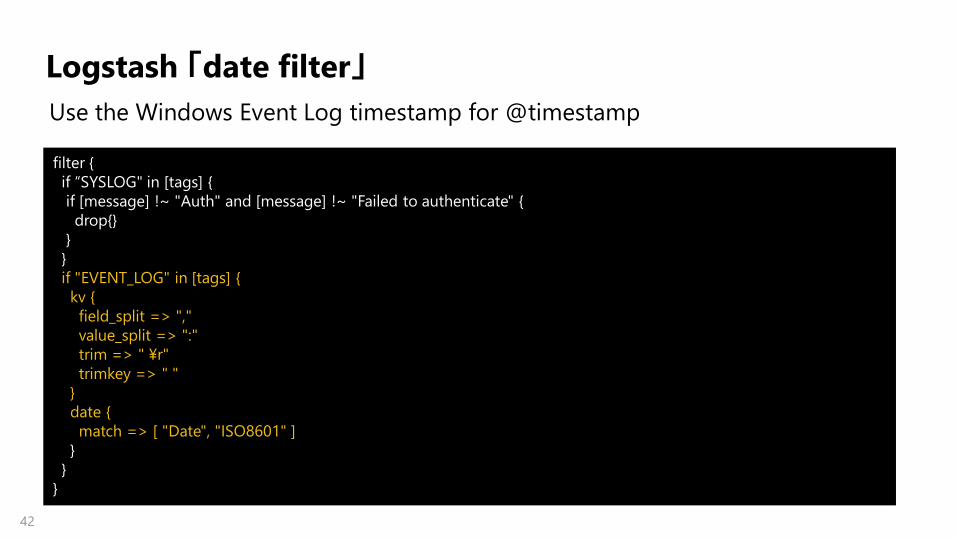
Logstash 「date filter」
filter {
if “SYSLOG" in [tags] {
if [message] !~ "Auth" and [message] !~ "Failed to authenticate" {
drop{}
}
}
if "EVENT_LOG" in [tags] {
kv {
field_split => ","
value_split => ":"
trim => " ¥r"
trimkey => " "
}
date {
match => [ "Date", "ISO8601" ]
}
}
}
Use the Windows Event Log timestamp for @timestamp
43
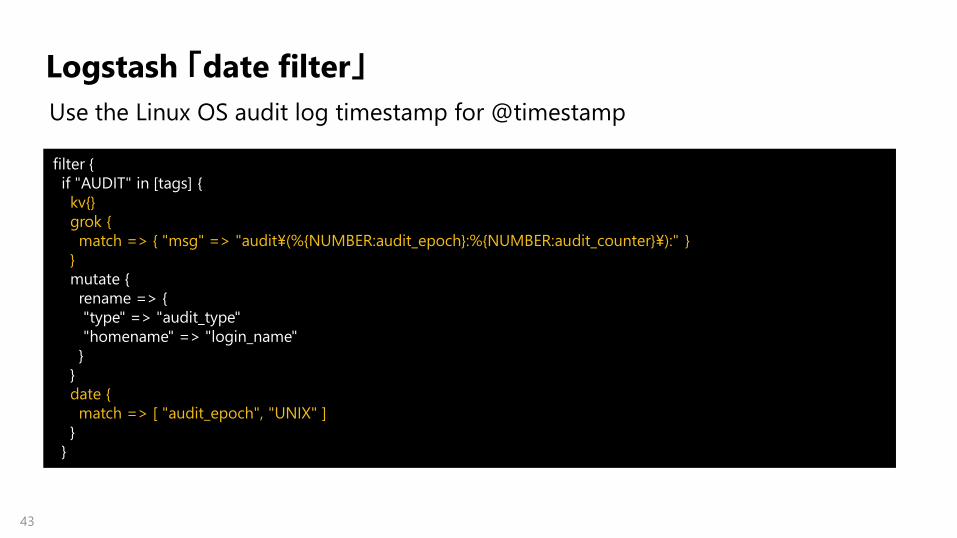
Logstash 「date filter」
filter {
if "AUDIT" in [tags] {
kv{}
grok {
match => { "msg" => "audit¥(%{NUMBER:audit_epoch}:%{NUMBER:audit_counter}¥):" }
}
mutate {
rename => {
"type" => "audit_type"
"homename" => "login_name"
}
}
date {
match => [ "audit_epoch", "UNIX" ]
}
}
Use the Linux OS audit log timestamp for @timestamp

44
Logstash 「date filter」
filter {
if "JDBC" in [tags] {
date {
match => [ "event_time","yyyyMMddHHmmssSSS"]
}
}
}
Use the application or database timestamp for @timestamp

45
The Limit to sql last start
DB(M)
DB(S)
Replication
Log
Management DB
【Normal】
This is an issue that occurs for Master-Slave modeled database audit logs
①
Every hour Logstash acquires logs for the past 60minutes
②
【logstash.conf】
input {
jdbc {
tags => "JDBC"
record_last_run => "true“
schedule => "00 0-23 * * *"
statement => “… and AV_TIME> :sql_last_start“
}
}
output{
elasticsearch{
host => ‘IP for Elasticsearch'
protocol => http
}
}
46
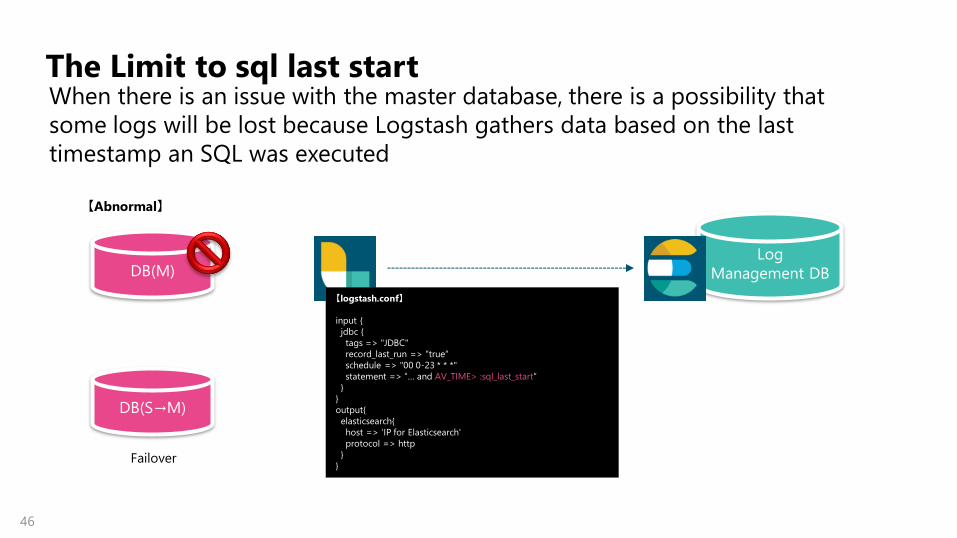
The Limit to sql last start
DB(M)
DB(S→M)
Failover
Log
Management DB
【Abnormal】
When there is an issue with the master database, there is a possibility that
some logs will be lost because Logstash gathers data based on the last
timestamp an SQL was executed
【logstash.conf】
input {
jdbc {
tags => "JDBC"
record_last_run => "true“
schedule => "00 0-23 * * *"
statement => “… and AV_TIME> :sql_last_start“
}
}
output{
elasticsearch{
host => ‘IP for Elasticsearch'
protocol => http
}
}

47
Points for log normalization when incorporating syslog
Instead of gathering the syslogs from devices directly to Logstash, receive them
from rsyslogd
Network Device A
(FortiGate)
Network Device B
(Cisco Catalyst)
Network Device C
(BluCoat ProxySG)
Network Device A
(FortiGate)
Network Device B
(Cisco Catalyst)
Network Device C
(BlueCoat ProxySG)
rsyslo
g
/var/log/forti/forti.log
/var/log/proxy/proxy.log
/var/log/cisco/cisco.log
input {
udp {
tags => “SYSLOG“
port => 514
} }
filter{
if “SYSLOG” in [tags] {
・・・
With this architecture,
logs cannot be separated into different filters
based on tags because all the logs for different
devices would have come through the same
input udp.
input {
file {
tags => “forti“
path => "/var/log/forti/forti.log"
start_position => "beginning"
} }
file {
tags => “cisco“
path => "/var/log/cisco/cisco.log"
start_position => "beginning"
} file {
tags => “proxy“
path => "/var/log/proxy/proxy.log"
start_position => "beginning"
}
filter{
if “forti” in [tags] {
<Normalization rules for FortiGate> }
if “cisco” in [tags] {
<Normalization rules for Catalyst>
}
if “proxy” in [tags] {
<Normalization rules for ProxySG> }
・・・
By receiving the logs from rsyslogd, logs will separated
according to IP, therefore making it possible to use tags
depending on which input file it came through. This way,
different normalization
filters can be applied to different logs
<Sample for rsyslog.conf>
:fromhost-ip, isequal, “IP Address” where-your-log-file-is
48
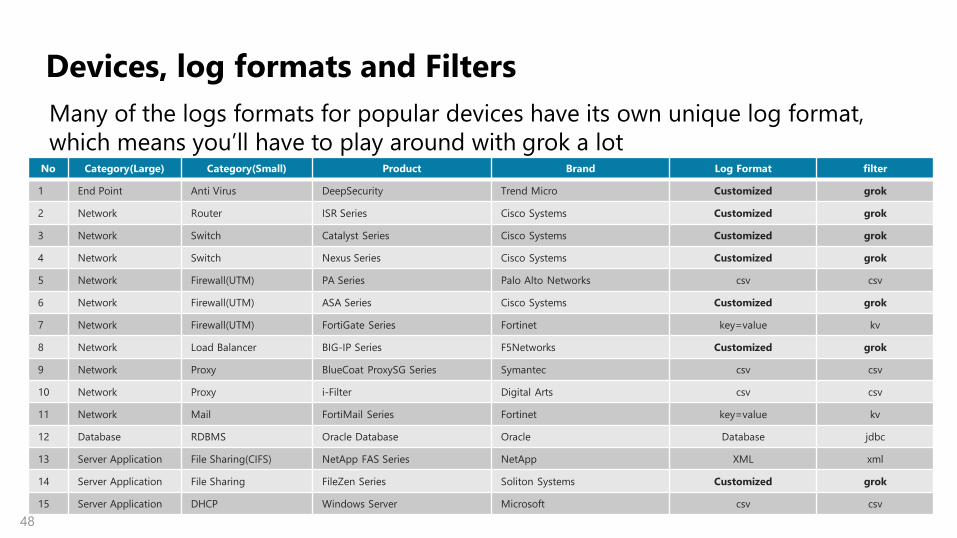
Devices, log formats and Filters
No Category(Large) Category(Small) Product Brand Log Format filter
1 End Point Anti Virus DeepSecurity Trend Micro Customized grok
2 Network Router ISR Series Cisco Systems Customized grok
3 Network Switch Catalyst Series Cisco Systems Customized grok
4 Network Switch Nexus Series Cisco Systems Customized grok
5 Network Firewall(UTM) PA Series Palo Alto Networks csv csv
6 Network Firewall(UTM) ASA Series Cisco Systems Customized grok
7 Network Firewall(UTM) FortiGate Series Fortinet key=value kv
8 Network Load Balancer BIG-IP Series F5Networks Customized grok
9 Network Proxy BlueCoat ProxySG Series Symantec csv csv
10 Network Proxy i-Filter Digital Arts csv csv
11 Network Mail FortiMail Series Fortinet key=value kv
12 Database RDBMS Oracle Database Oracle Database jdbc
13 Server Application File Sharing(CIFS) NetApp FAS Series NetApp XML xml
14 Server Application File Sharing FileZen Series Soliton Systems Customized grok
15 Server Application DHCP Windows Server Microsoft csv csv
Many of the logs formats for popular devices have its own unique log format,
which means you’ll have to play around with grok a lot
49
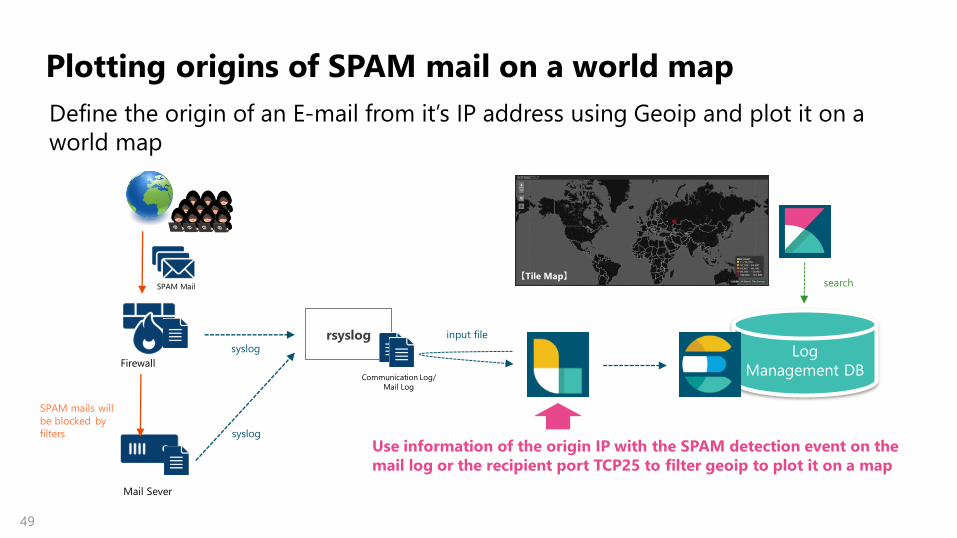
Plotting origins of SPAM mail on a world map
Define the origin of an E-mail from it’s IP address using Geoip and plot it on a
world map
Firewall
Mail Sever
Log
Management DB
rsyslog syslog
Communication Log/
Mail Log
input file
Use information of the origin IP with the SPAM detection event on the
mail log or the recipient port TCP25 to filter geoip to plot it on a map
SPAM Mail search
SPAM mails will
be blocked by
filters syslog
【Tile Map】
50
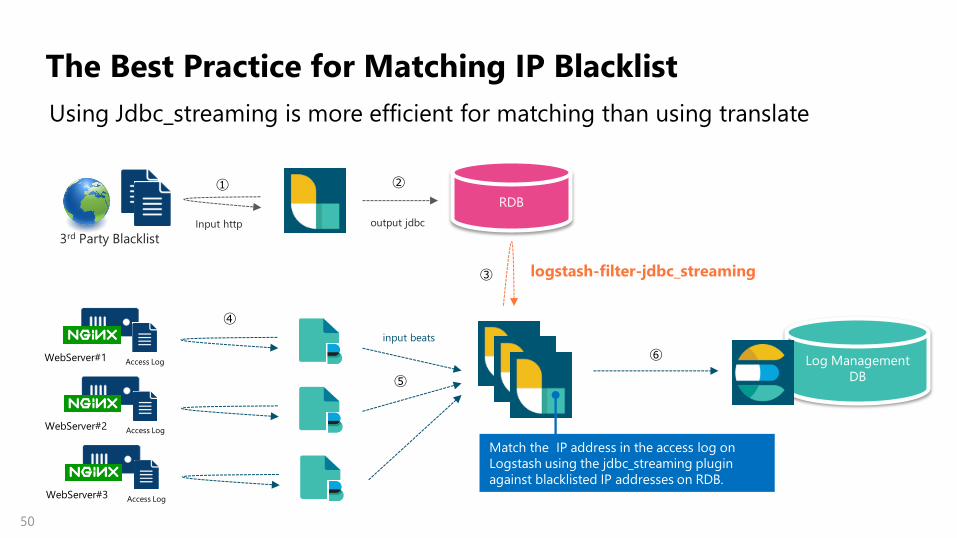
The Best Practice for Matching IP Blacklist
Using Jdbc_streaming is more efficient for matching than using translate
Log Management
DB
RDB
logstash-filter-jdbc_streaming
3rd Party Blacklist Input http output jdbc
input beats
WebServer#1 Access Log
WebServer#2 Access Log
WebServer#3 Access Log
Match the IP address in the access log on
Logstash using the jdbc_streaming plugin
against blacklisted IP addresses on RDB.
① ②
③
④
⑤
⑥

51
How to incorporate logs on AWS
Users Internet ELB EC2 RDS
VPC Flow Logs
S3 Bucket
Cloud Front
S3 Cloud Trail
Cloud Watch Logs
input s3
input file
Save logs
Save logs
Save logs
Audit Log Communication
Log
Save logs
Web Access DB Access
Save logs
Object Access
Elastic Stack
AWS Shield AWS WAF
Save logs Save logs
S3 Access Log
Audit
AWS Manager
Action
Log Audit
SQL Misconduct
Access
Log Audit
VPC Misconduct
Communication
Log Audit
CloudFront Access
Log Audit
ELB Access Log
Audit WAF Log Audit
DDoS Attack Log
Audit

52