Embed Size (px)
Citation preview
Squeezing the Mystery Out of Electropolishing Niobium
Charles Reece
Oct 6, 2010
Electropolishing of Nb cavities has been fruitfully employed for over 30 years. Most recently it has been procedurally applied to the 9-cell cavities for XFEL and ILC R&D.
Though no doubt EP has been demonstrated effective, basic understanding of its mechanisms has lagged behind. We continue to deepen our understanding of what “EP” does to niobium surfaces and apply that knowledge to optimize the process.
We want to understand the scale-specific details of surface leveling, believing that such understanding will yield confident process control and optimization.
SRF Thin Films & more Workshop 4-6 Oct 2010 2
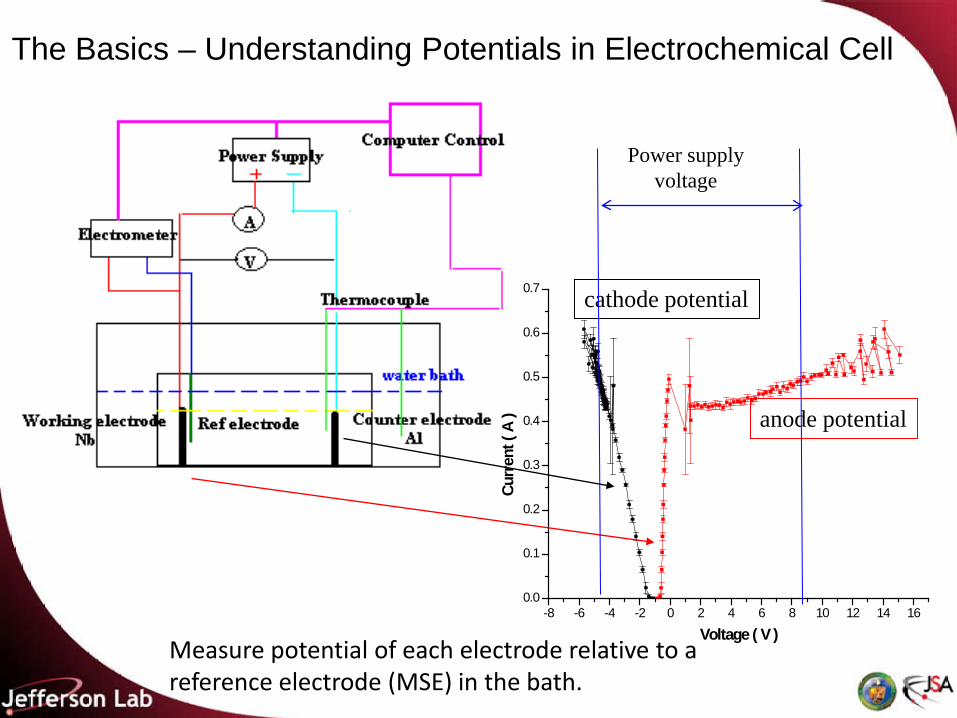
The Basics – Understanding Potentials in Electrochemical Cell
• Provide an improved technical basis for specific process design, e.g. 9-cell cavities.
-8 -6 -4 -2 0 2 4 6 8 10 12 14 160.0
0.1
0.2
0.3
0.4
0.5
0.6
0.7
Curr
ent (
A )
Voltage ( V )
cathode potential
anode potential
Measure potential of each electrode relative to a reference electrode (MSE) in the bath.
Power supply voltage

4
The Effect of Temperature on Cathode I-V Curve
Our studies show that the polarization resistance on the cathode decreases exponentially with temperature and is well behaved .
-8.0 -7.5 -7.0 -6.5 -6.0 -5.5 -5.0 -4.5 -4.0 -3.5 -3.0 -2.5 -2.0 -1.5 -1.00.0
0.5
1.0
1.5
2.0
2.5
Curr
ent (
A )
Voltage ( V )
Area Ratio of Nb/Al = 10 : 1 (Nb : 26.035 cm 2; Al : 2.6035 cm 2)Ref electrode & Thermal Couple nearby Nb ( < 5 mm ) 54.6 o C ( rise up to 60.9 o C)45.6 ( rise up to 47.7 o C)33.5 ( rise up to 34.1 o C)26.3 ( rise up to 26.6 o C)21.3 ( rise up to 21.7 o C)
-4.01 -1.38
0.4530.508
0.647 0.8110.981
0 10 20 30 40 50 60 70 801
10
100Equation: y = A1*exp(-x/t1) + y0Chi 2/DoF = 0.10763R 2 = 0.99531
y0 4.23282±1.66343A1 26.3770 ±3.27746t1 24.3274±6.86868
experimental result expontial fit interpolation
ohm
.cm
2
Temperature ( o C )
SRF Thin Films & more Workshop 4-6 Oct 2010
5
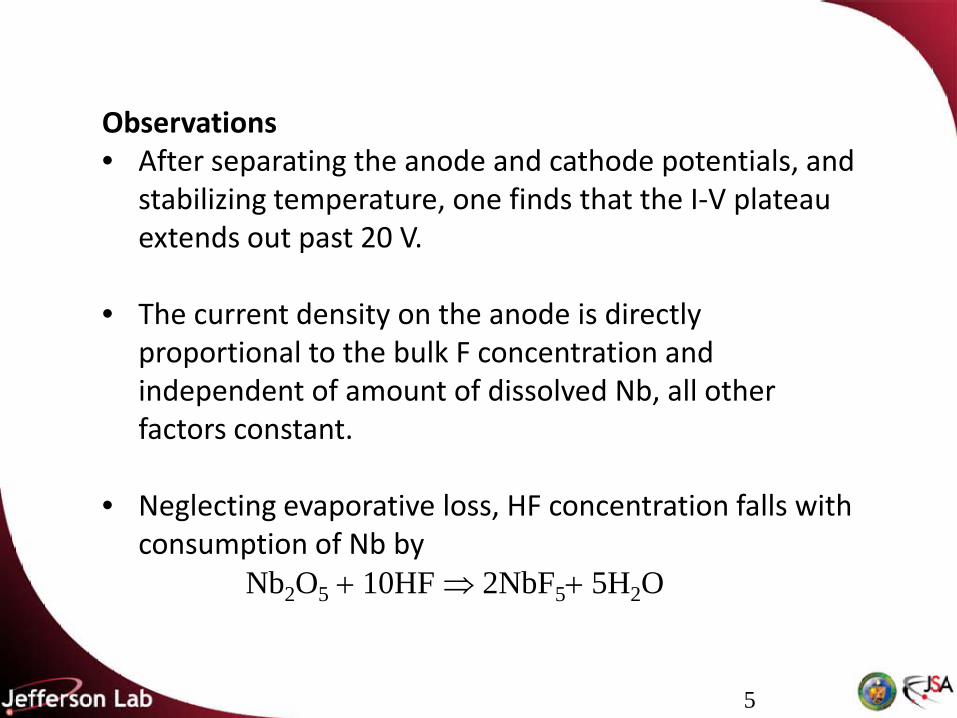
Observations• After separating the anode and cathode potentials, and
stabilizing temperature, one finds that the I-V plateau extends out past 20 V.
• The current density on the anode is directly proportional to the bulk F concentration and independent of amount of dissolved Nb, all other factors constant.
• Neglecting evaporative loss, HF concentration falls with consumption of Nb by
Nb2O5 + 10HF ⇒ 2NbF5+ 5H2O
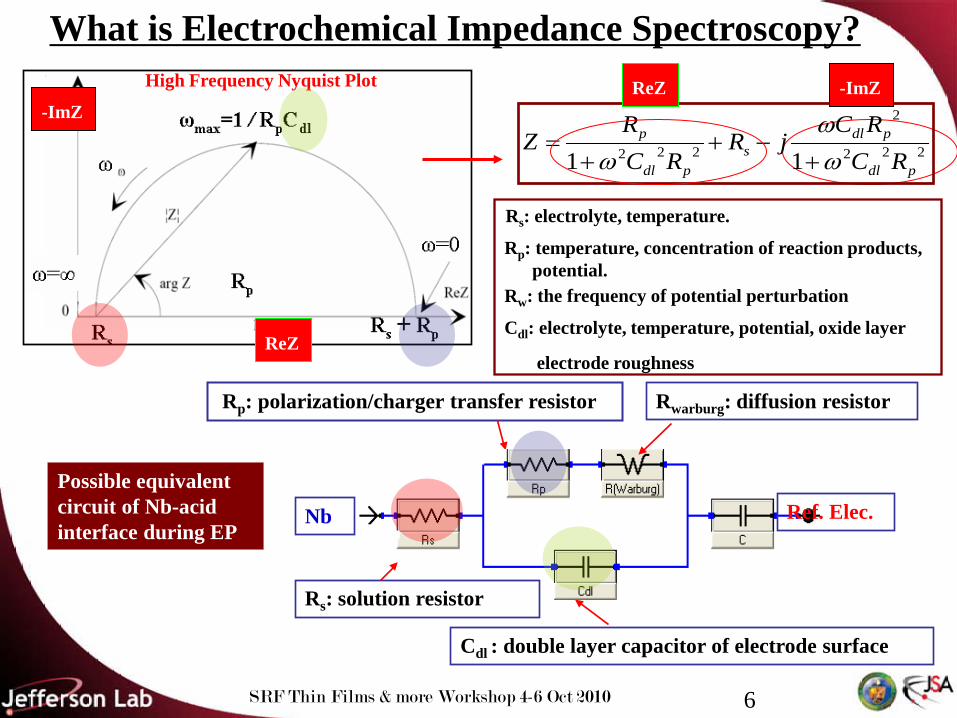
Rs: electrolyte, temperature.
What is Electrochemical Impedance Spectroscopy?
Rp: polarization/charger transfer resistor
Cdl : double layer capacitor of electrode surface
Rwarburg: diffusion resistor
Rs: solution resistor
Nb Ref. Elec.Possible equivalent circuit of Nb-acid interface during EP
High Frequency Nyquist Plot
222
2
222 11 pdl
pdls
pdl
p
RCRC
jRRC
RZ
ωω
ω +−+
+=
ReZ
-ImZReZ -ImZ
Rp: temperature, concentration of reaction products, potential.
Rw: the frequency of potential perturbation
Cdl: electrolyte, temperature, potential, oxide layer
electrode roughness
SRF Thin Films & more Workshop 4-6 Oct 2010 6
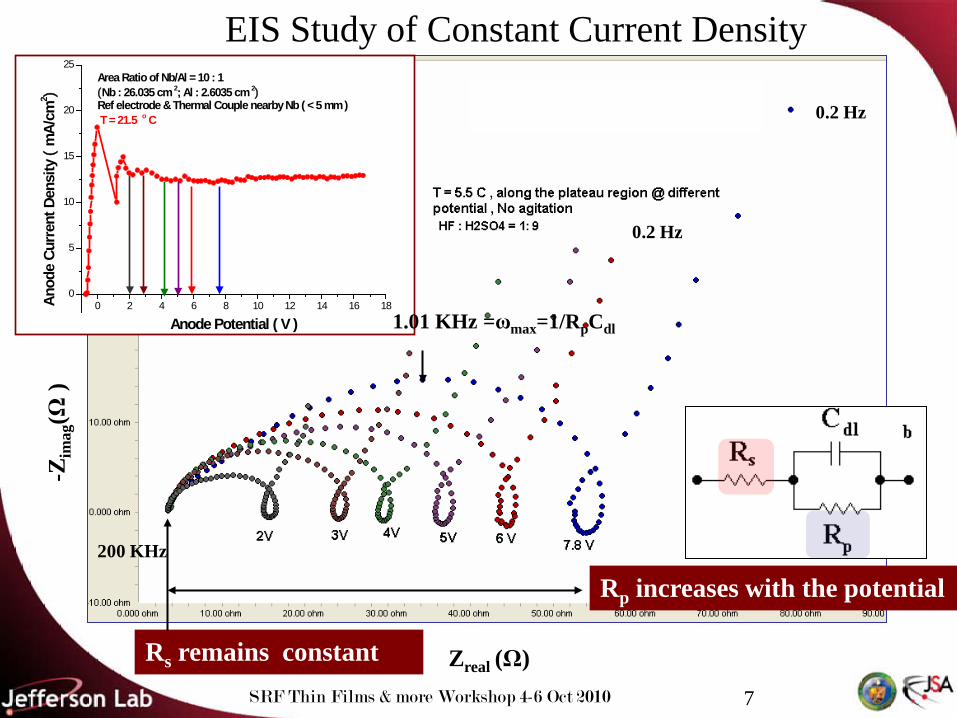
Zreal (Ω)Rs remains constant
-Zim
ag(Ω
)EIS Study of Constant Current Density
0 2 4 6 8 10 12 14 16 180
5
10
15
20
25Area Ratio of Nb/Al = 10 : 1 (Nb : 26.035 cm 2; Al : 2.6035 cm 2)Ref electrode & Thermal Couple nearby Nb ( < 5 mm ) T = 21.5 o C
Anod
e Cu
rren
t Den
sity
( m
A/cm
2 )
Anode Potential ( V )
Rp increases with the potential
0.2 Hz
200 KHz
1.01 KHz =ωmax=1/RpCdl
0.2 Hz
SRF Thin Films & more Workshop 4-6 Oct 2010 7
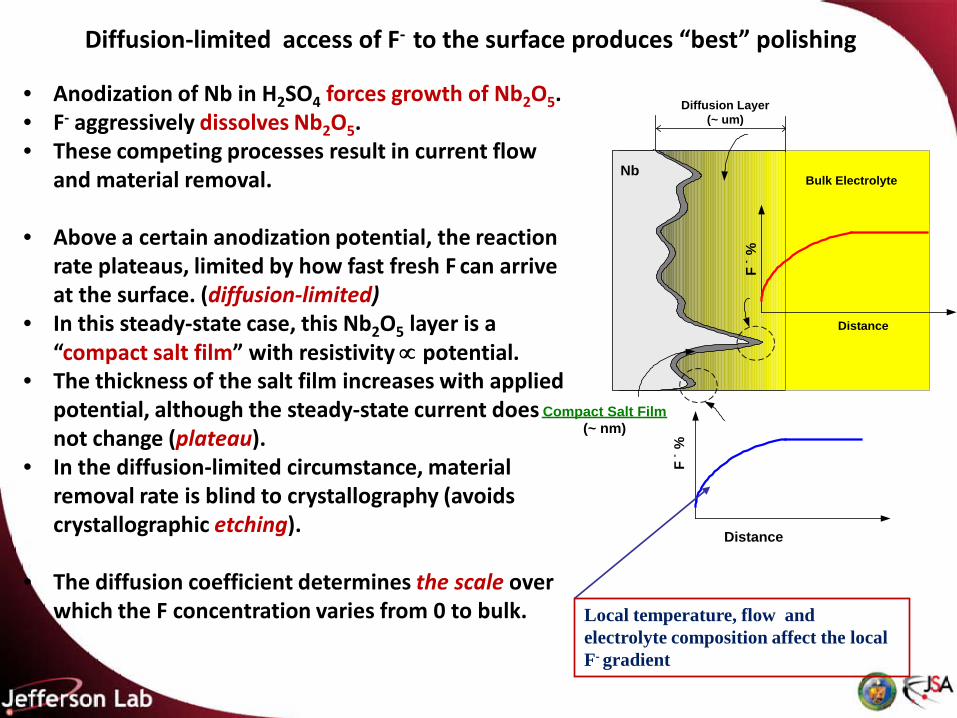
NbBulk Electrolyte
Diffusion Layer(~ um)
Compact Salt Film(~ nm)
F -
%
F -
%
Distance
Distance
Diffusion-limited access of F- to the surface produces “best” polishing
Local temperature, flow and electrolyte composition affect the local F- gradient
• Anodization of Nb in H2SO4 forces growth of Nb2O5.• F- aggressively dissolves Nb2O5.• These competing processes result in current flow
and material removal.
• Above a certain anodization potential, the reaction rate plateaus, limited by how fast fresh F can arrive at the surface. (diffusion-limited)
• In this steady-state case, this Nb2O5 layer is a “compact salt film” with resistivity ∝ potential.
• The thickness of the salt film increases with applied potential, although the steady-state current does not change (plateau).
• In the diffusion-limited circumstance, material removal rate is blind to crystallography (avoids crystallographic etching).
• The diffusion coefficient determines the scale over which the F concentration varies from 0 to bulk.
We have successfully characterized the • temperature-dependent viscosity of the EP fluid• diffusion constant of F- in the fluid
This allows us to calculate the scale of optimum leveling.
We have also identified that a parallel etching process is present at higher temperatures – this works against obtaining smoothest surfaces efficiently with material removal.
SRF Thin Films & more Workshop 4-6 Oct 2010 9
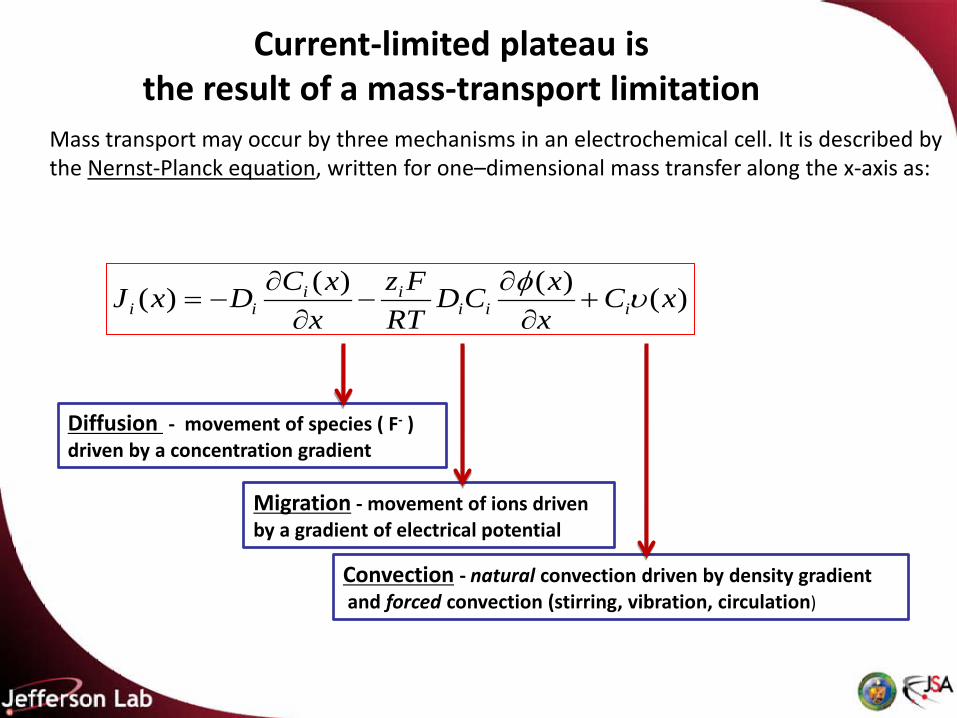
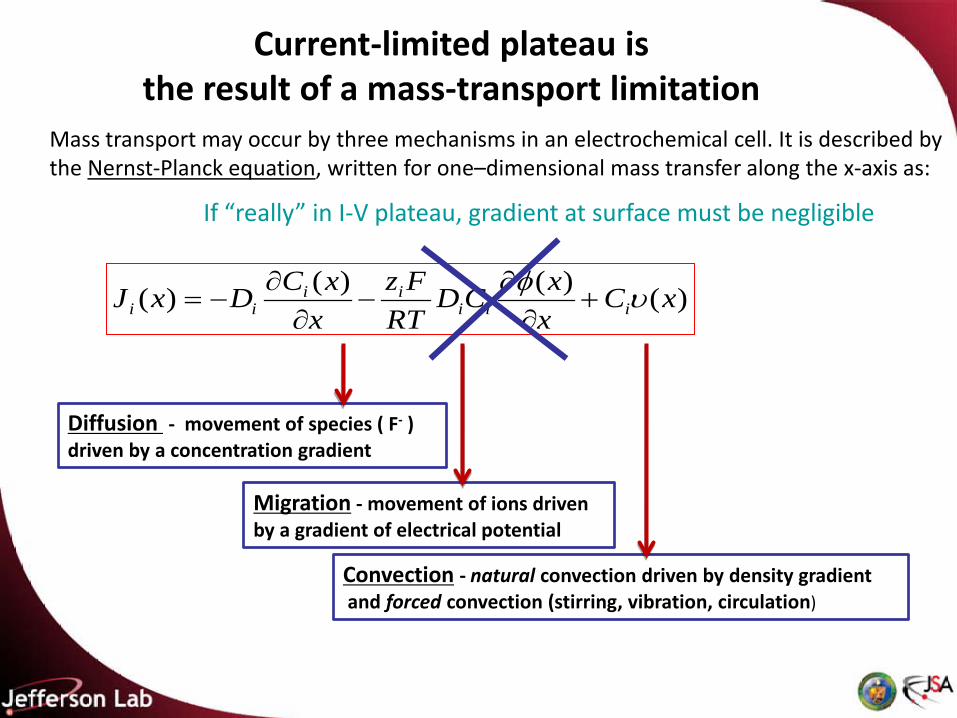
Mass transport may occur by three mechanisms in an electrochemical cell. It is described by the Nernst-Planck equation, written for one–dimensional mass transfer along the x-axis as:
)()()()( xCxxCD
RTFz
xxCDxJ iii
iiii υφ
+∂
∂−
∂∂
−=
Migration - movement of ions driven by a gradient of electrical potential
Convection - natural convection driven by density gradientand forced convection (stirring, vibration, circulation)
Diffusion - movement of species ( F- )driven by a concentration gradient
Current-limited plateau is the result of a mass-transport limitation
If “really” in I-V plateau, gradient at surface must be negligible
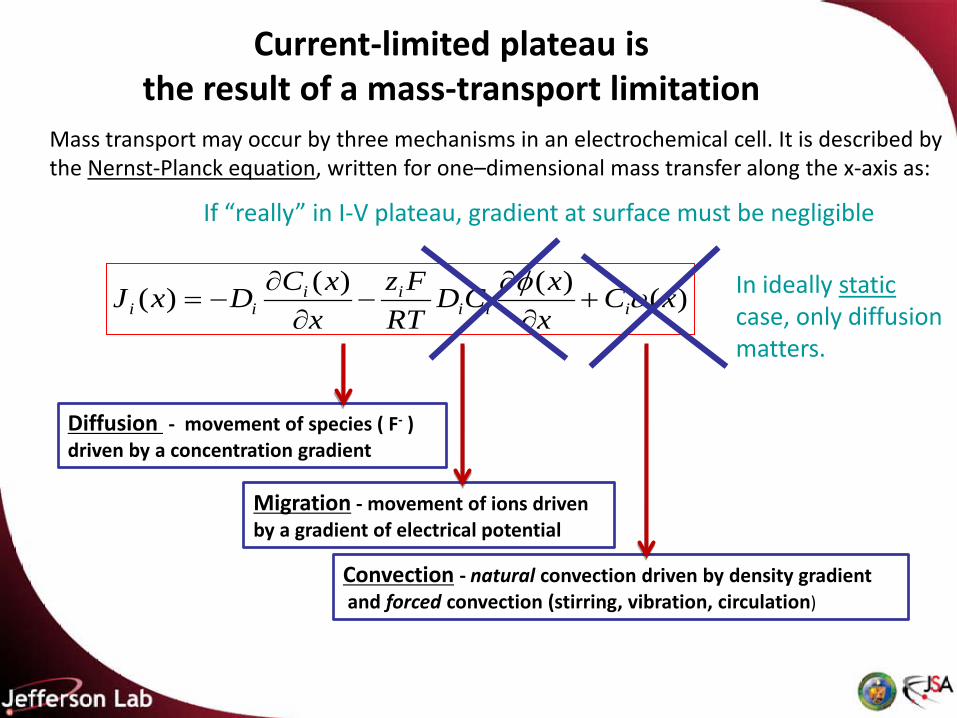
Mass transport may occur by three mechanisms in an electrochemical cell. It is described by the Nernst-Planck equation, written for one–dimensional mass transfer along the x-axis as:
)()()()( xCxxCD
RTFz
xxCDxJ iii
iiii υφ
+∂
∂−
∂∂
−=
Migration - movement of ions driven by a gradient of electrical potential
Convection - natural convection driven by density gradientand forced convection (stirring, vibration, circulation)
Diffusion - movement of species ( F- )driven by a concentration gradient
Current-limited plateau is the result of a mass-transport limitation
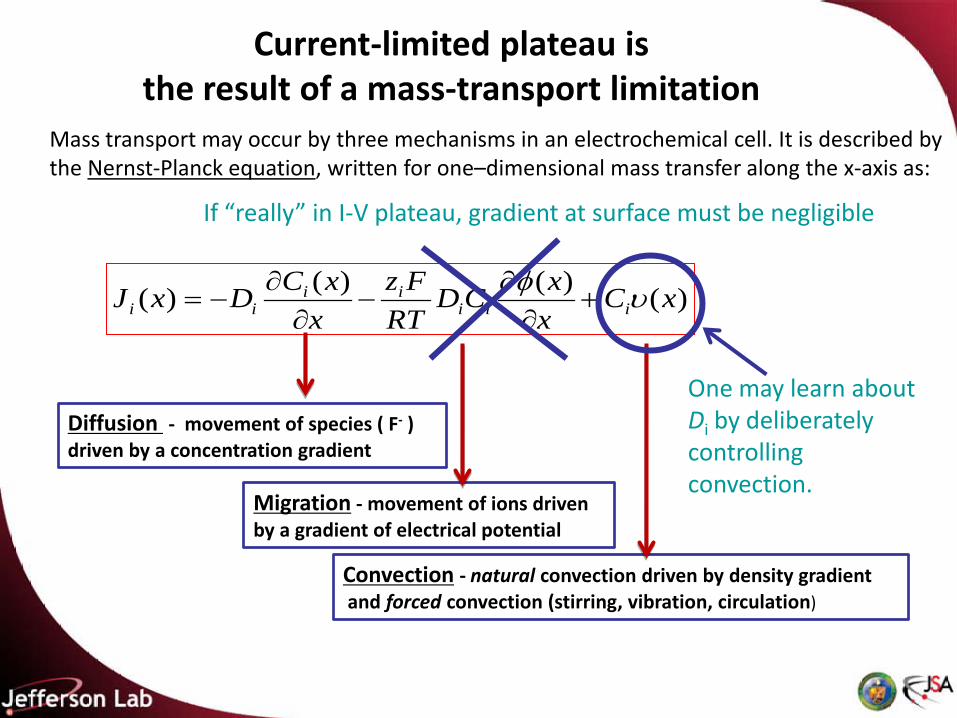
If “really” in I-V plateau, gradient at surface must be negligible
In ideally static case, only diffusion matters.
Mass transport may occur by three mechanisms in an electrochemical cell. It is described by the Nernst-Planck equation, written for one–dimensional mass transfer along the x-axis as:
)()()()( xCxxCD
RTFz
xxCDxJ iii
iiii υφ
+∂
∂−
∂∂
−=
Migration - movement of ions driven by a gradient of electrical potential
Convection - natural convection driven by density gradientand forced convection (stirring, vibration, circulation)
Diffusion - movement of species ( F- )driven by a concentration gradient
Current-limited plateau is the result of a mass-transport limitation
If “really” in I-V plateau, gradient at surface must be negligible
One may learn about Di by deliberately controlling convection.
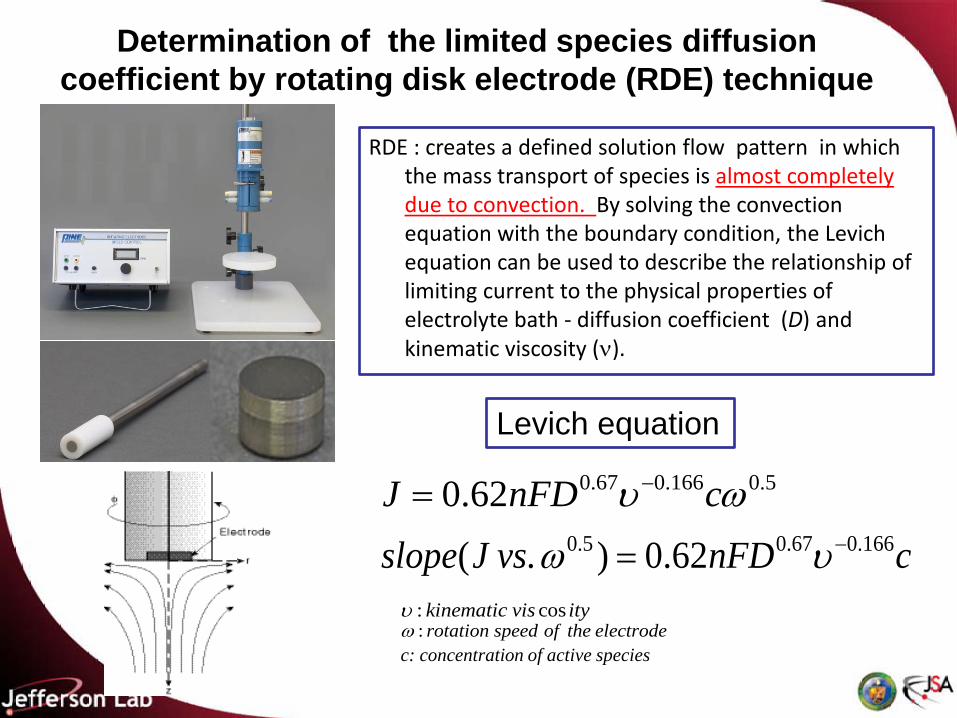
RDE : creates a defined solution flow pattern in which the mass transport of species is almost completely due to convection. By solving the convection equation with the boundary condition, the Levichequation can be used to describe the relationship of limiting current to the physical properties of electrolyte bath - diffusion coefficient (D) and kinematic viscosity (ν).
Levich equation
0.67 0.166 0.50.62J nFD cυ ω−=0.5 0.67 0.166( . ) 0.62slope J vs nFD cω υ−=
: coskinematic vis ityυ: rotation speed of the electrodeω
Determination of the limited species diffusion coefficient by rotating disk electrode (RDE) technique
c: concentration of active species
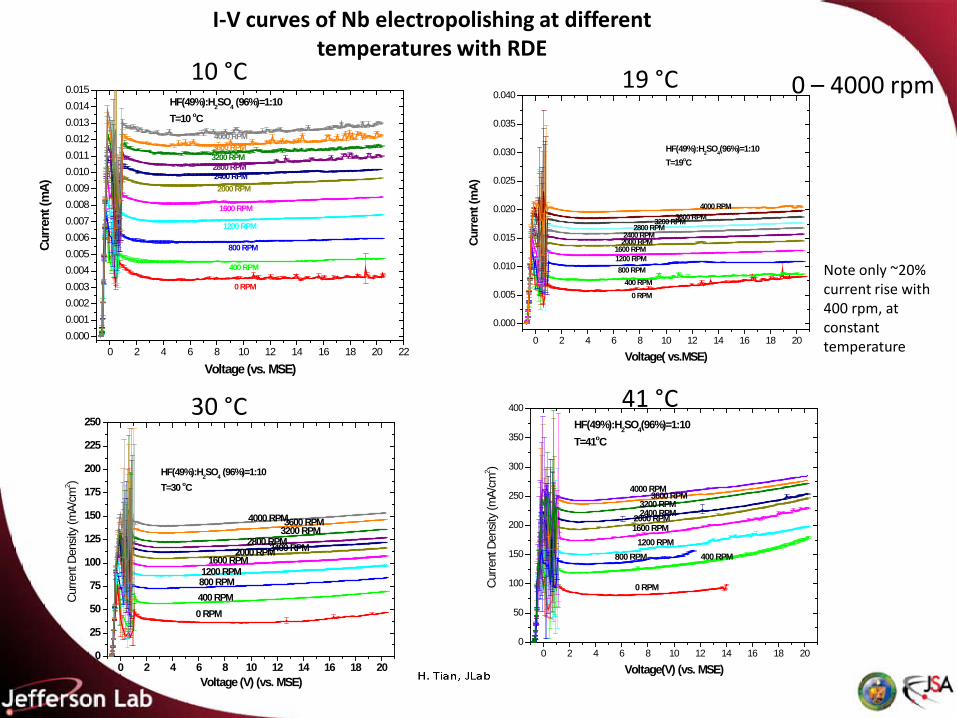
I-V curves of Nb electropolishing at different temperatures with RDE
0 2 4 6 8 10 12 14 16 18 20 220.0000.0010.0020.0030.0040.0050.0060.0070.0080.0090.0100.0110.0120.0130.0140.015
4000 RPM3600 RPM3200 RPM2800 RPM2400 RPM2000 RPM
1600 RPM
1200 RPM
800 RPM
400 RPM
Curr
ent (
mA)
Voltage (vs. MSE)
HF(49%):H2SO4 (96%)=1:10T=10 oC
0 RPM
0 2 4 6 8 10 12 14 16 18 20
0.000
0.005
0.010
0.015
0.020
0.025
0.030
0.035
0.040
4000 RPM3600 RPM3200 RPM
2800 RPM2400 RPM2000 RPM
1600 RPM1200 RPM
0 RPM
800 RPM
Curr
ent (
mA)
Voltage( vs.MSE)
HF(49%):H2SO4(96%)=1:10T=19oC
400 RPM
0 2 4 6 8 10 12 14 16 18 200
25
50
75
100
125
150
175
200
225
250
4000 RPM3600 RPM3200 RPM
2400 RPM2800 RPM2000 RPM
1600 RPM1200 RPM800 RPM400 RPM
HF(49%):H2SO4 (96%)=1:10T=30 oC
Curre
nt D
ensit
y (m
A/cm
2 )
Voltage (V) (vs. MSE)
0 RPM
0 2 4 6 8 10 12 14 16 18 200
50
100
150
200
250
300
350
400
2400 RPM
3600 RPM3200 RPM
4000 RPM
2000 RPM1600 RPM
1200 RPM800 RPM 400 RPM
Curre
nt D
ensit
y (m
A/cm
2 )
Voltage(V) (vs. MSE)
HF(49%):H2SO4(96%)=1:10T=41oC
0 RPM
10 °C 19 °C
30 °C 41 °C
0 – 4000 rpm
Note only ~20% current rise with 400 rpm, at constant temperature
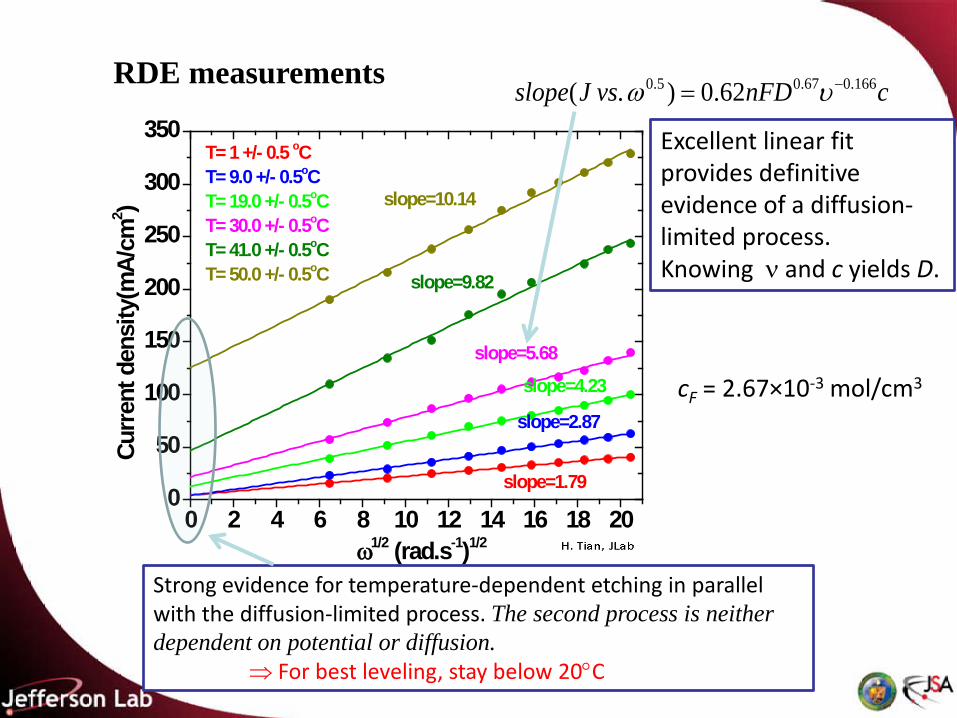
Strong evidence for temperature-dependent etching in parallel with the diffusion-limited process. The second process is neither dependent on potential or diffusion.
⇒ For best leveling, stay below 20°C
0 2 4 6 8 10 12 14 16 18 200
50
100
150
200
250
300
350
slope=10.14
slope=9.82
slope=5.68
slope=4.23
slope=2.87
slope=1.79
Curr
ent d
ensi
ty(m
A/cm
2 )
ω1/2 (rad.s-1)1/2
T= 1 +/- 0.5 oCT= 9.0 +/- 0.5oCT= 19.0 +/- 0.5oCT= 30.0 +/- 0.5oCT= 41.0 +/- 0.5oCT= 50.0 +/- 0.5oC
0.5 0.67 0.166( . ) 0.62slope J vs nFD cω υ−=
Excellent linear fit provides definitive evidence of a diffusion-limited process. Knowing ν and c yields D.
RDE measurements
cF = 2.67×10⁻³ mol/cm3
0.00
0.05
0.10
0.15
0.20
0.25
0.30
0 10 20 30 40 50
ν(c
m2/
s)
T (°C)
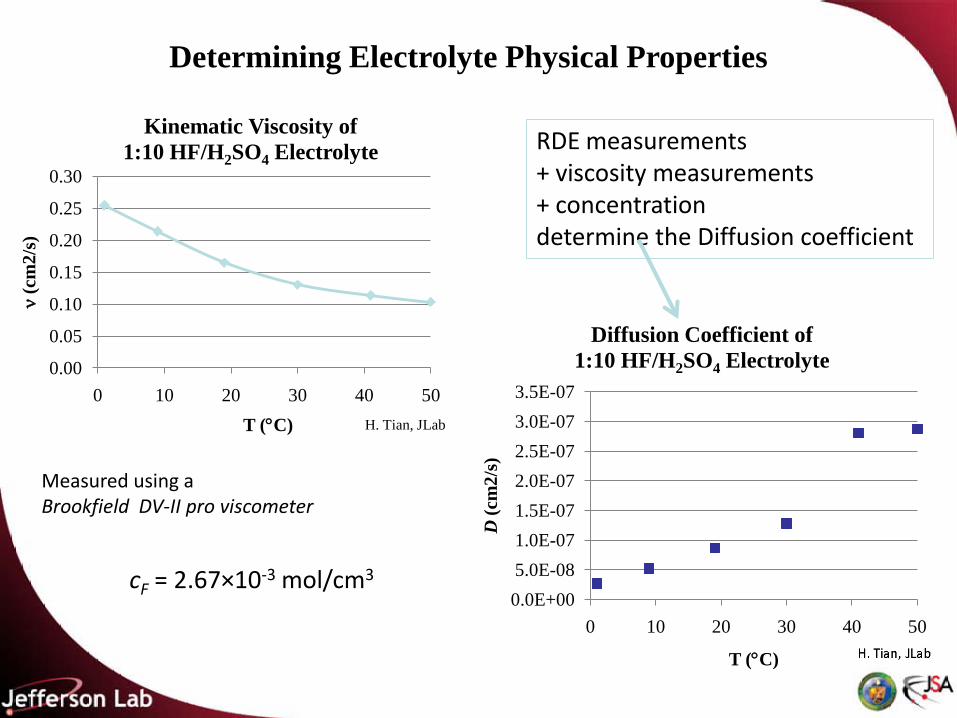
Kinematic Viscosity of 1:10 HF/H2SO4 Electrolyte
H. Tian, JLab
Measured using a Brookfield DV-II pro viscometer
0.0E+005.0E-081.0E-071.5E-072.0E-072.5E-073.0E-073.5E-07
0 10 20 30 40 50
D(c
m2/
s)
T (°C)
Diffusion Coefficient of 1:10 HF/H2SO4 Electrolyte
RDE measurements + viscosity measurements + concentration determine the Diffusion coefficient
cF = 2.67×10⁻³ mol/cm3
Determining Electrolyte Physical Properties
0 10 20 30 40 5068
10121416182022242628303234
Temperature (oC)
Diffu
sion
laye
r thi
ckne
ss (µ
m)
1δ 2δ
(0, ) 0F
C t− ≈
BulkF
C −
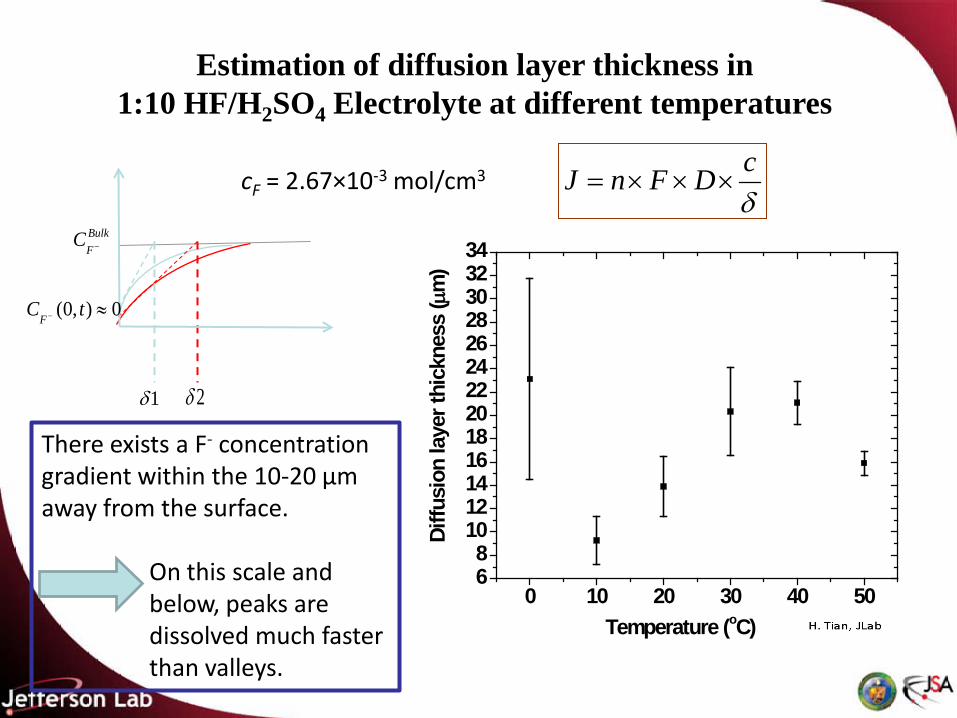
cJ n F Dδ
= × × ×
Estimation of diffusion layer thickness in 1:10 HF/H2SO4 Electrolyte at different temperatures
cF = 2.67×10⁻³ mol/cm3
There exists a F- concentration gradient within the 10-20 µm away from the surface.
On this scale and below, peaks are dissolved much faster than valleys.
10-2 10-1 100 10110-2
10-1
100
101
102
103
104
105
106
107
Spatial frequency (µm-1)
PS
D(n
m2 )
PSD of Fine CBP Nb Surface Before/ After EP
KEK fine CBP fine grain sample 2KEK fine CBP large grain sample 9KEK fine CBP single crystal sample 13KEK fine CBP large grain sample 9 after EPKEK fine CBP single crystal sample 13 after EPKEK fine CBP fine grain sample 2 after EP
RMS~200nm
AFM Measurement ( 50µm*50µm)
RMS~7nm
RMS~40nm
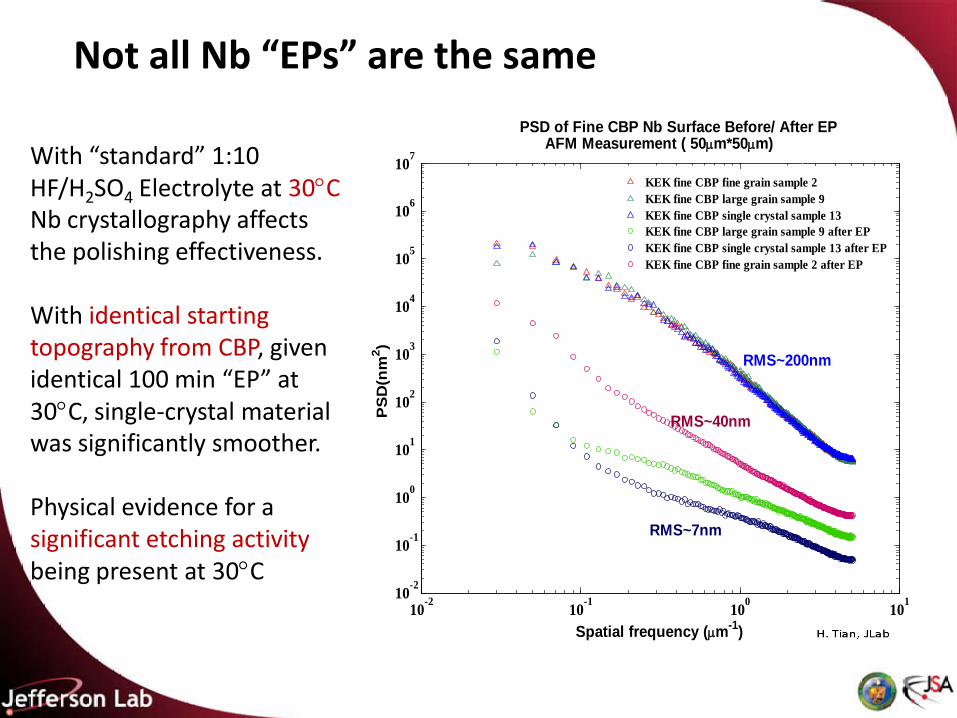
With “standard” 1:10 HF/H2SO4 Electrolyte at 30°CNb crystallography affects the polishing effectiveness.
With identical starting topography from CBP, given identical 100 min “EP” at 30°C, single-crystal material was significantly smoother.
Physical evidence for a significant etching activity being present at 30°C
Not all Nb “EPs” are the same
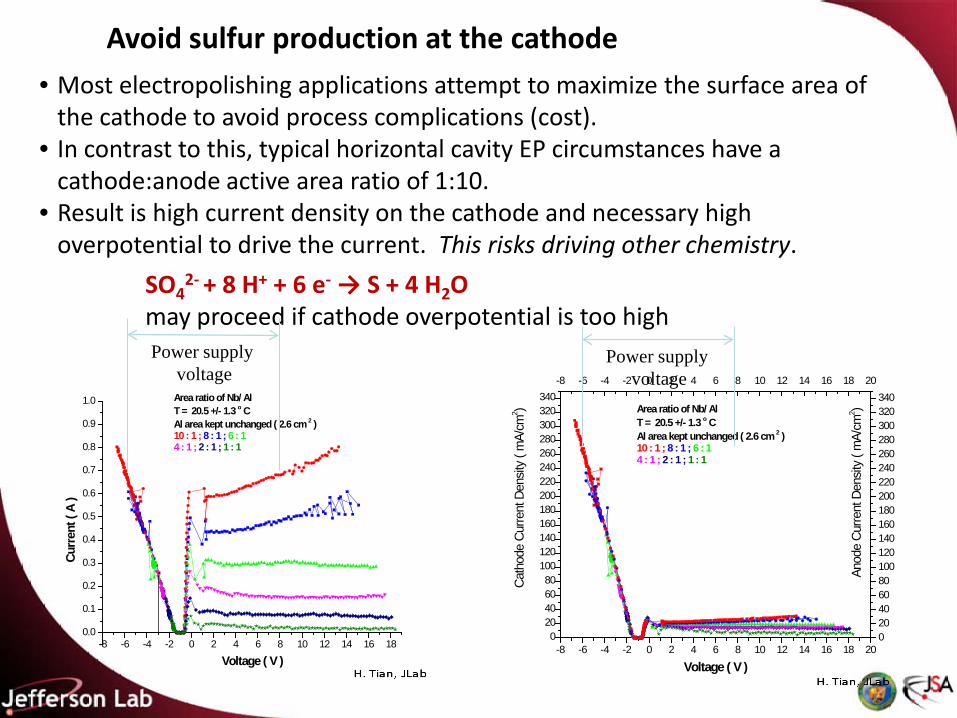
Avoid sulfur production at the cathode• Most electropolishing applications attempt to maximize the surface area of
the cathode to avoid process complications (cost).• In contrast to this, typical horizontal cavity EP circumstances have a
cathode:anode active area ratio of 1:10.• Result is high current density on the cathode and necessary high
overpotential to drive the current. This risks driving other chemistry.
SO42- + 8 H+ + 6 e- → S + 4 H2O
may proceed if cathode overpotential is too high
-8 -6 -4 -2 0 2 4 6 8 10 12 14 16 180.0
0.1
0.2
0.3
0.4
0.5
0.6
0.7
0.8
0.9
1.0
Curr
ent (
A )
Voltage ( V )
Area ratio of Nb/ AlT = 20.5 +/- 1.3 o C Al area kept unchanged ( 2.6 cm 2 )10 : 1 ; 8 : 1 ; 6 : 14 : 1 ; 2 : 1 ; 1 : 1
-8 -6 -4 -2 0 2 4 6 8 10 12 14 16 18 200
20406080
100120140160180200220240260280300320340
-8 -6 -4 -2 0 2 4 6 8 10 12 14 16 18 20
020406080100120140160180200220240260280300320340
Anod
e Cu
rrent
Den
sity
( mA/
cm2 )Area ratio of Nb/ Al
T = 20.5 +/- 1.3 o C Al area kept unchanged ( 2.6 cm 2 )10 : 1 ; 8 : 1 ; 6 : 14 : 1 ; 2 : 1 ; 1 : 1
Cath
ode
Curre
nt D
ensit
y ( m
A/cm
2 )
Voltage ( V )
Power supply voltage
Power supply voltage
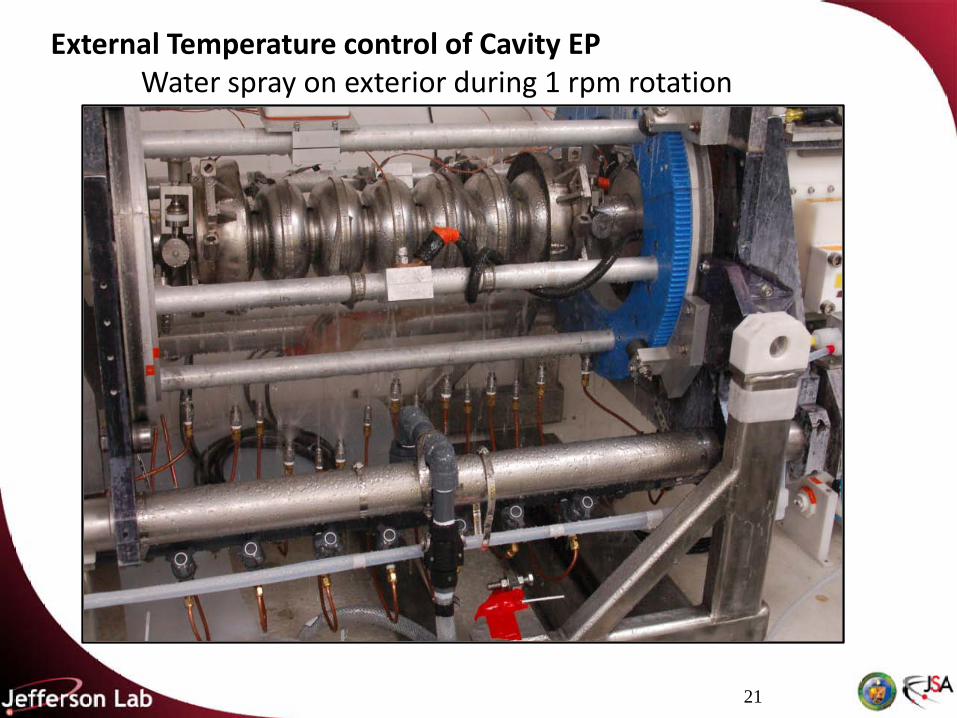
21
External Temperature control of Cavity EPWater spray on exterior during 1 rpm rotation
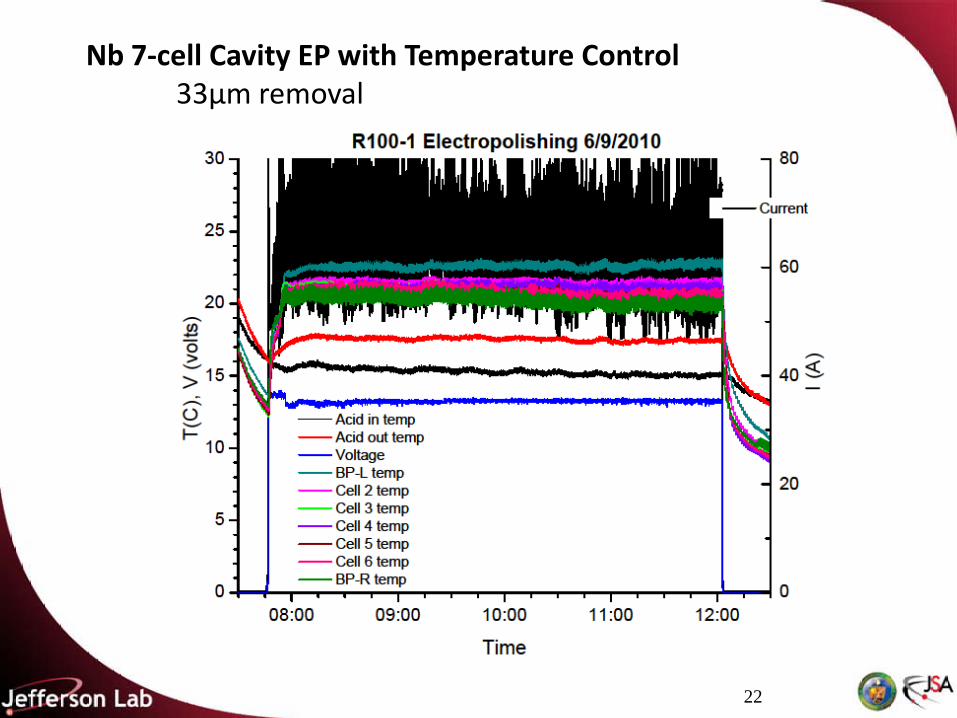
22
Nb 7-cell Cavity EP with Temperature Control33µm removal
23
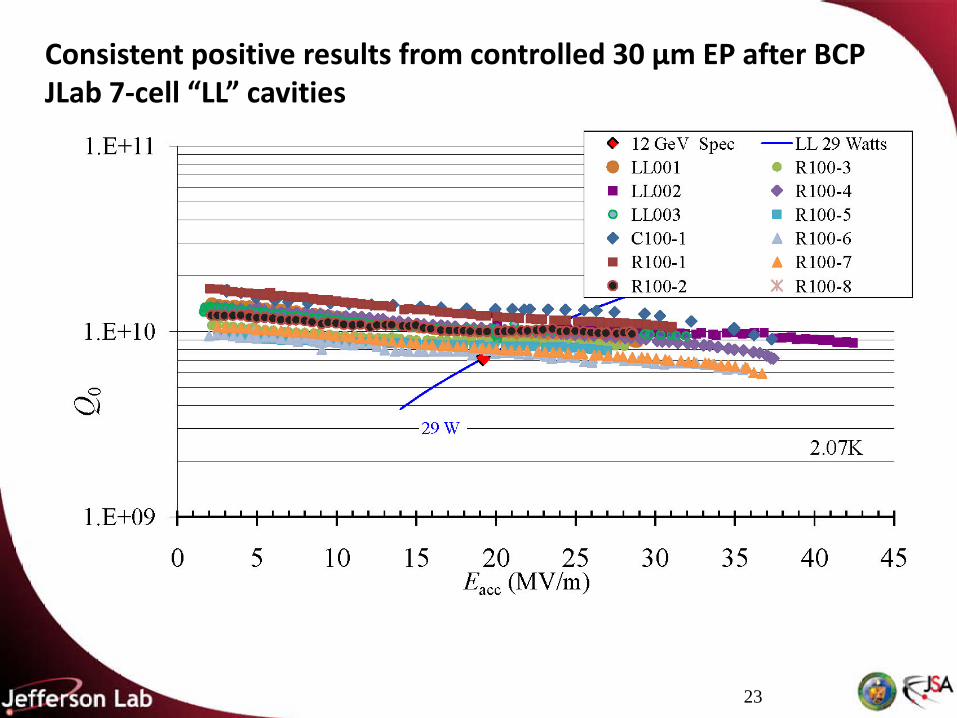
Consistent positive results from controlled 30 µm EP after BCPJLab 7-cell “LL” cavities
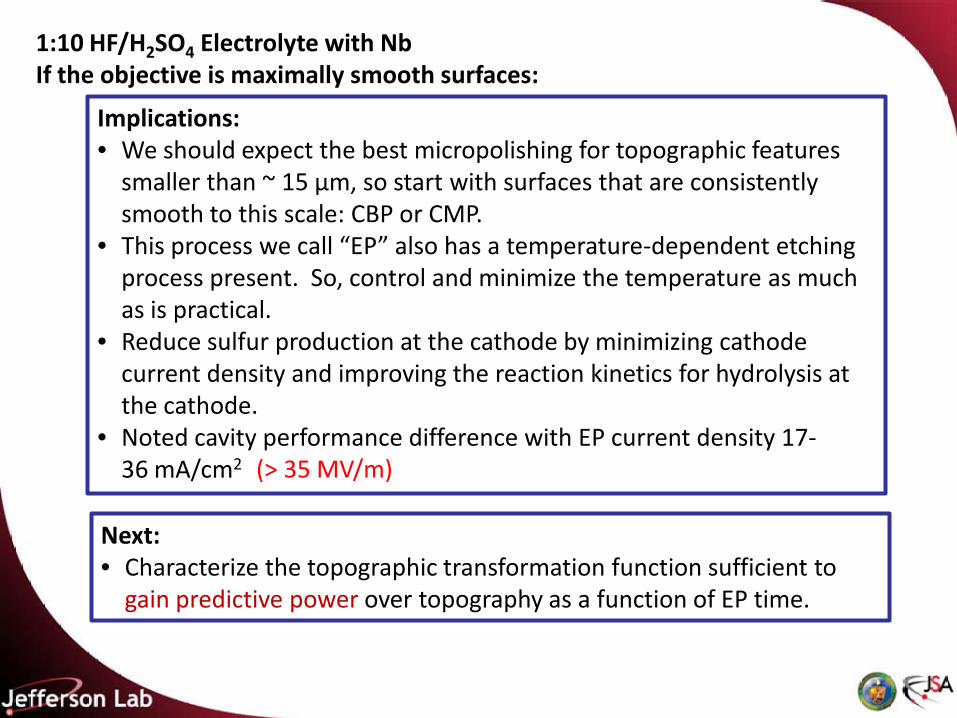
Implications:• We should expect the best micropolishing for topographic features
smaller than ~ 15 µm, so start with surfaces that are consistently smooth to this scale: CBP or CMP.
• This process we call “EP” also has a temperature-dependent etching process present. So, control and minimize the temperature as much as is practical.
• Reduce sulfur production at the cathode by minimizing cathode current density and improving the reaction kinetics for hydrolysis at the cathode.
• Noted cavity performance difference with EP current density 17-36 mA/cm2 (> 35 MV/m)
1:10 HF/H2SO4 Electrolyte with NbIf the objective is maximally smooth surfaces:
Next:• Characterize the topographic transformation function sufficient to
gain predictive power over topography as a function of EP time.
25
Conclusion
Basic process studies are yielding improved understanding of theelectropolishing of niobium. This understanding leads to betterprocess control and product reproducibility. It may also lead tonew efficient process designs from first-principles.
Application of light, controlled EP is expected to significantlyimprove the technical contingency of the 12 GeV Upgrade projectand lower future cryogenic operating costs.
ContributorsH. Tian JLab, (W&M)O. Trofimova JLabM. J. Kelley JLab, W&M, VTL. Zhao JLab, W&MS. Corcoran VTS. Brankovic U HoustonG. Ribeill JLab (DOE SULI)
Key References:
A. J. Bard and L. R. Faulkner, Electrochemical Methods, Wiley: New York, 1980.H. Tian, S. G. Corcoran, C. E. Reece and M. J. Kelley, J. Electrochem. Soc. 155(2008), p. D563.V.G. Levich, Physicochemical Hydrodynamics, Prentice-Hall, New York, 1962.F. Eozénou, S. Berry, C. Antoine, Y. Gasser, J.-P. Charrier and B. Malk., PhysRev-STAB 13, 083501 (2010).H. Tian and C. E. Reece, PhysRev-STAB 13, 083502 (2010).H. Tian, Ph.D. Dissertation, Dept. of Applied Science, College of William and Mary, (2008).C. Reece and H. Tian, Contribution to LINAC10 THP010 (Sept 2010)
“A Novel Approach to Characterizing the Surface Topography of Niobium Superconducting Radio Frequency (SRF) Accelerator Cavities,” H. Tian, C. E. Reece, and M. J. Kelley, Appli. Surf. Sci., (submitted) (2010).
Authored by Jefferson Science Associates, LLC under U.S. DOE Contract No. DE-AC05-06OR23177.


![Investigation of electropolishing characteristics of tungsten in ......of electropolishing tungsten has been studied by Wang et al. [21], and they discovered that electropolishing](https://img.pdfslide.us/doc/110x75/60eb316d7c2235457f18455e/investigation-of-electropolishing-characteristics-of-tungsten-in-of-electropolishing.jpg)