Embed Size (px)
Citation preview

PSBE2-08
Research Methods
End of the Line
1Tassos Sarampalis

The week’s reading
Chapters 8 and 9
2

Non-randomised Research+
Sampling Units
3

Quasi-Experimental Designs
• Non-equivalent groups and historical controls
• Interrupted time series
• Single-case experimental designs
• Cross-lagged correlational designs
4

Non-equivalent Groups
• Similar to real experiments• Typically involve pre- and post-treatment
measurements
• But:Without random assignment -> Groups are not equivalent
5

Historical Controls
also known as literature controls
• Easier• Fewer ethical worries
But:Caution because of selection and report bias
6

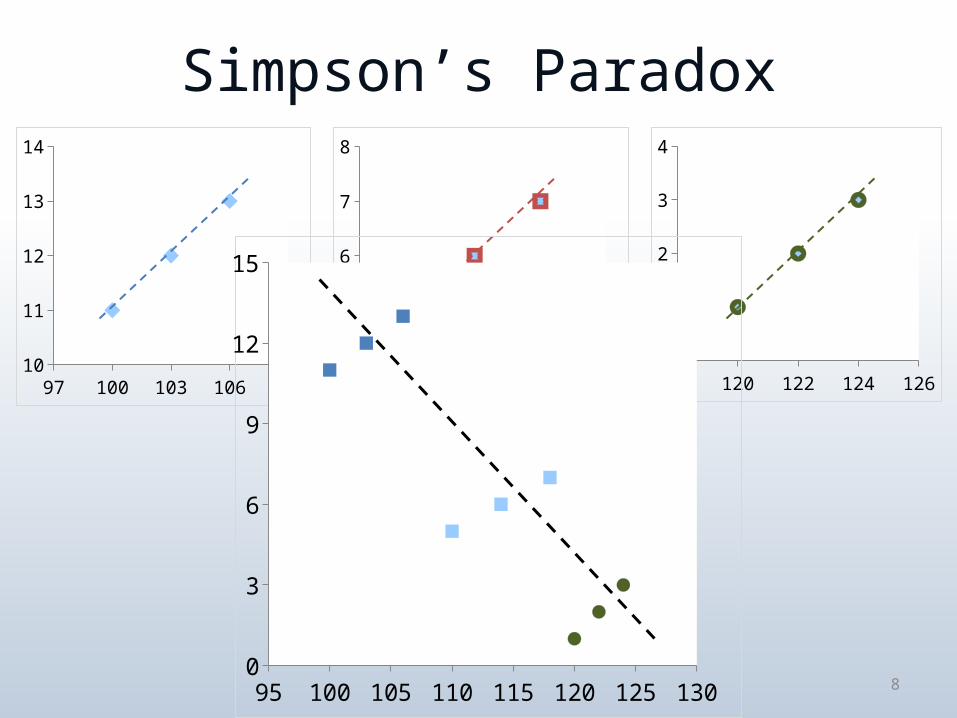
Simpson’s Paradox
97 100 103 106 10910
11
12
13
14
7
107 110 113 116 119 1224
5
6
7
8
118 120 122 124 1260
1
2
3
4
Simpson’s Paradox
97 100 103 106 10910
11
12
13
14
8
107 110 113 116 119 1224
5
6
7
8
118 120 122 124 1260
1
2
3
4
95 100 105 110 115 120 125 1300
3
6
9
12
15
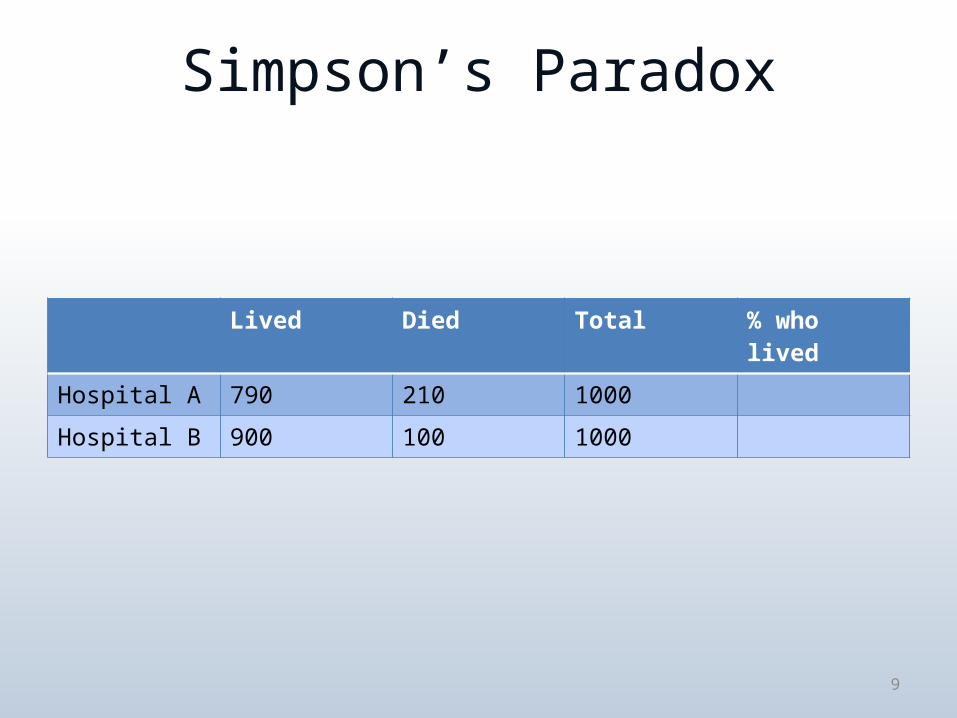
Simpson’s Paradox
Lived Died Total % who lived
Hospital A 790 210 1000
Hospital B 900 100 1000
9

Simpson’s Paradox
Lived Died Total % who lived
Hospital A 790 210 1000 79%
Hospital B 900 100 1000 90%
10

Simpson’s ParadoxLived Died Total % who lived
Hospital A 790 210 1000 79%
Hospital B 900 100 1000 90%
11
Lived Died Total % who lived
Hospital A 580 10 590
Hospital B 860 30 890
Lived Died Total % who lived
Hospital A 210 200 410
Hospital B 40 70 110
Fair Condition and Better
Poor Condition and Worse

Simpson’s ParadoxLived Died Total % who lived
Hospital A 790 210 1000 79%
Hospital B 900 100 1000 90%
12
Lived Died Total % who lived
Hospital A 580 10 590 98.3%
Hospital B 860 30 890 96.6%
Lived Died Total % who lived
Hospital A 210 200 410 51.2%
Hospital B 40 70 110 36.3%
Fair Condition and Better
Poor Condition and Worse

Interrupted Time Series
• A series of discreet measurements
• A clear definition of the beginning and ending of the treatment
13

Interrupted Time Series
14

Interrupted Time Series
15

Autocorrelation
• Regular
• Seasonal
16
N
N+
1
0 Time lag
Aut
ocor
rela
tion
Coe
ff.

Single-Case Experimental Designs
• Repeated observations, but on a single case (or small number of cases)
17

Cross-Lagged Designs
18
A1 A2
B1 B2
time
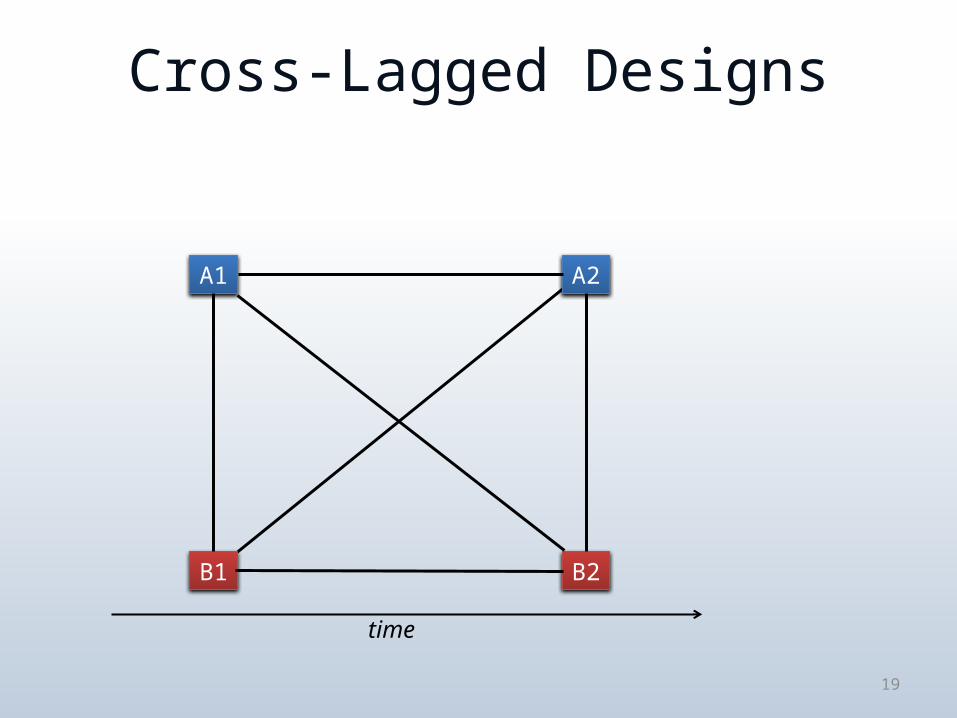
Cross-Lagged Designs
19
A1 A2
B1 B2
time

Cross-Lagged Designs
20
A1 A2
B1 B2
time
Test-Retest Correlations

Cross-Lagged Designs
21
A1 A2
B1 B2
time
Test-Retest Correlations
Synchronous Correlations
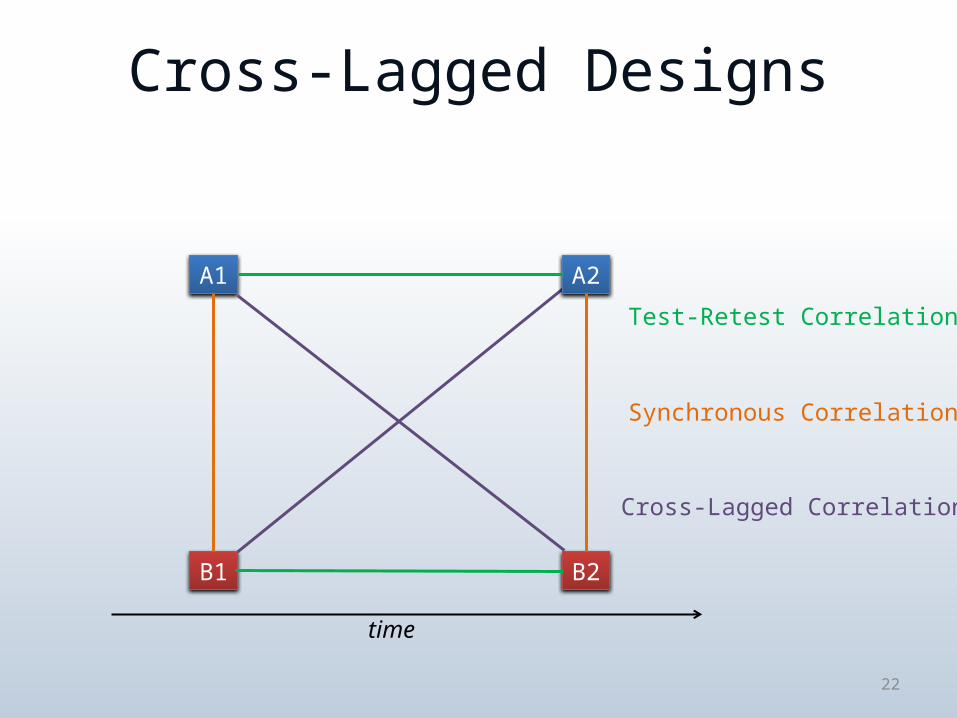
Cross-Lagged Designs
22
A1 A2
B1 B2
time
Test-Retest Correlations
Synchronous Correlations
Cross-Lagged Correlations

Cross-Lagged Designs
23
A1 A2
B1 B2
time
Test-Retest Correlations
Synchronous Correlations
Cross-Lagged Correlations

Sampling
24

Simple Random Sampling
Simple = from the undivided populationRandom = every sampling unit is equally
likely to be selected
With ReplacementWithout Replacement
25

Stratified Random Sampling
Stratified = First divide population into strataRandom = In each stratum, each unit is
equally likely to be selected
Advantage:Reduced sampling error (improved accuracy)
26

QUESTIONS
27

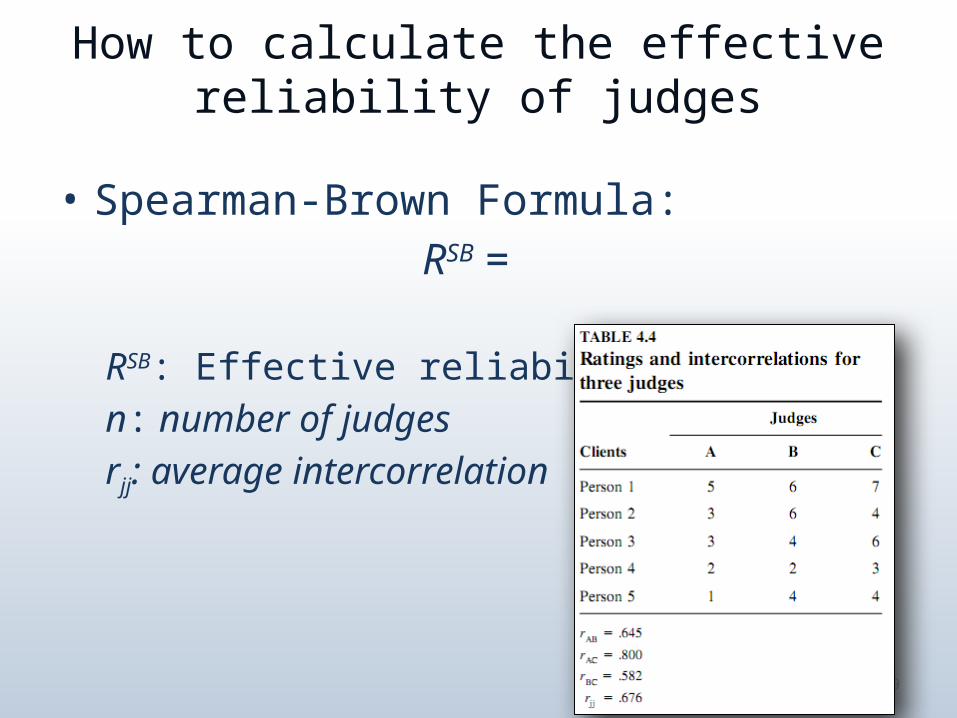
How to calculate the effective reliability of judges
• Spearman-Brown Formula:RSB =
RSB: Effective reliabilityn: number of judgesrjj: average intercorrelation
28
How to calculate the effective reliability of judges
• Spearman-Brown Formula:RSB =
RSB: Effective reliabilityn: number of judgesrjj: average intercorrelation
29

How to calculate the effective reliability of judges
• Spearman-Brown Formula:RSB =
RSB: Effective reliabilityn: number of judgesrjj: average intercorrelation
30
RSB =

How to calculate the effective reliability of judges
• Spearman-Brown Formula:RSB =
RSB: Effective reliabilityn: number of judgesrjj: average intercorrelation
31
RSB =

How to calculate the effective reliability of judges
32

Effective cost of judges
33

OTHER QUESTIONS?
34

35

Thank you
36