Embed Size (px)
Citation preview
PROFILING PHPA DIVE INTO YOUR APPLICATION
/ Dennis de Greef @dennisdegreef
WordPress Meetup Nijmegen Maart 2015
WHAT IS PROFILING?
WIKIPEDIAprofiling is a form of dynamic program analysis that measures,
for example, the space (memory) or time complexity of aprogram, the usage of particular instructions, or the frequency
and duration of function calls. Most commonly, profilinginformation serves to aid program optimization.
SO... DYNAMIC PROGRAM ANALYSIS?

YEAH...LETS FIRST LOOK AT IT'S COUNTERPART...
STATIC ANALYSIS
WIKIPEDIAStatic program analysis is the analysis of computer software that
is performed without actually executing programs
The term is usually applied to the analysis performed by anautomated tool, with human analysis being called program
understanding, program comprehension or code review.
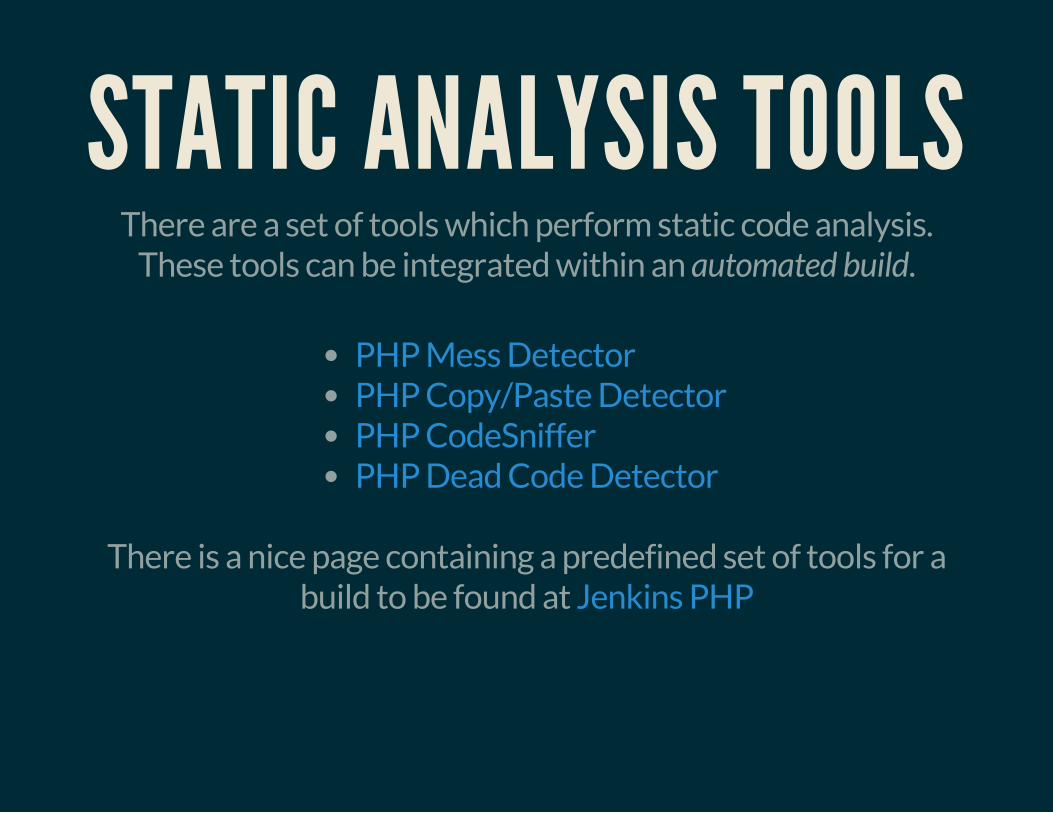
STATIC ANALYSIS TOOLSThere are a set of tools which perform static code analysis.
These tools can be integrated within an automated build.
PHP Mess DetectorPHP Copy/Paste DetectorPHP CodeSnifferPHP Dead Code Detector
There is a nice page containing a predefined set of tools for abuild to be found at Jenkins PHP

BUT...
THESE TOOLS ONLY ANALYSE HOW YOURCODE IS STRUCTURED, NOT HOW IT BEHAVES.
DYNAMIC ANALYSIS
WIKIPEDIAThe analysis of computer software that is performed by
executing programs on a real or virtual processor.
For dynamic program analysis to be effective, the target program must be executed with sufficient test inputs
to produce interesting behavior.
Use of software testing measures such as code coverage helpsensure that an adequate slice of the program's set of possible
behaviors has been observed.
CALLSTACKA callstack is the order in which statements are exectuted.
An example commonly known, is an exception trace. This traceshows all the statements executed before an exception is
thrown.

CALLGRAPHA callgraph is a visual representation of a callstack.
In large applications this graph can give you better insight onhow an application is wired.

PROFILING DATAUsually, the data gathered with a profiler can be represented in
stacks or graphs.They can include information regarding memory- and cpu-usage.

WHY?
REASONSDebugging CPU performanceDebugging memory performanceDebugging IO performanceSee which function is called how many timesGain insight of the black box that is the application

REASONSWe live in a digital age where we want everything instantly.According to a , 51 percent of onlineshoppers in the U.S claimed if a site is too slow they will notcomplete a purchase.Nowadays, search engine indexing also accounts for page load.
case study from Radware
The psychology of web performanceSEO 101: How important is site speed in 2014?
Case study from Radware
WARNING!
Premature optimization is the root of all evil-- Donald Knuth
Only perform optimization when there is a need to.

CAUSE OF ISSUES

COMMON ISSUESNetwork slowdownDatastore slowdownExternal resources (API, Filesystems, Network sockets, etc)
ACTIVE VS PASSIVE
Profiling PHP Part 1 (Davey Shafik)

ACTIVE PROFILERUsed during developmentGather more information than passive profilers (like variables/values)Performance impact is biggerShould _NOT_ be used in productionExample: Xdebug

PASSIVE PROFILERMinimal impact on performanceGathers less but sufficient information to diagnose issues(Only records function calls and cpu + mem)Examples: / , , XHProf UProfiler New Relic Blackfire.io
XDEBUG
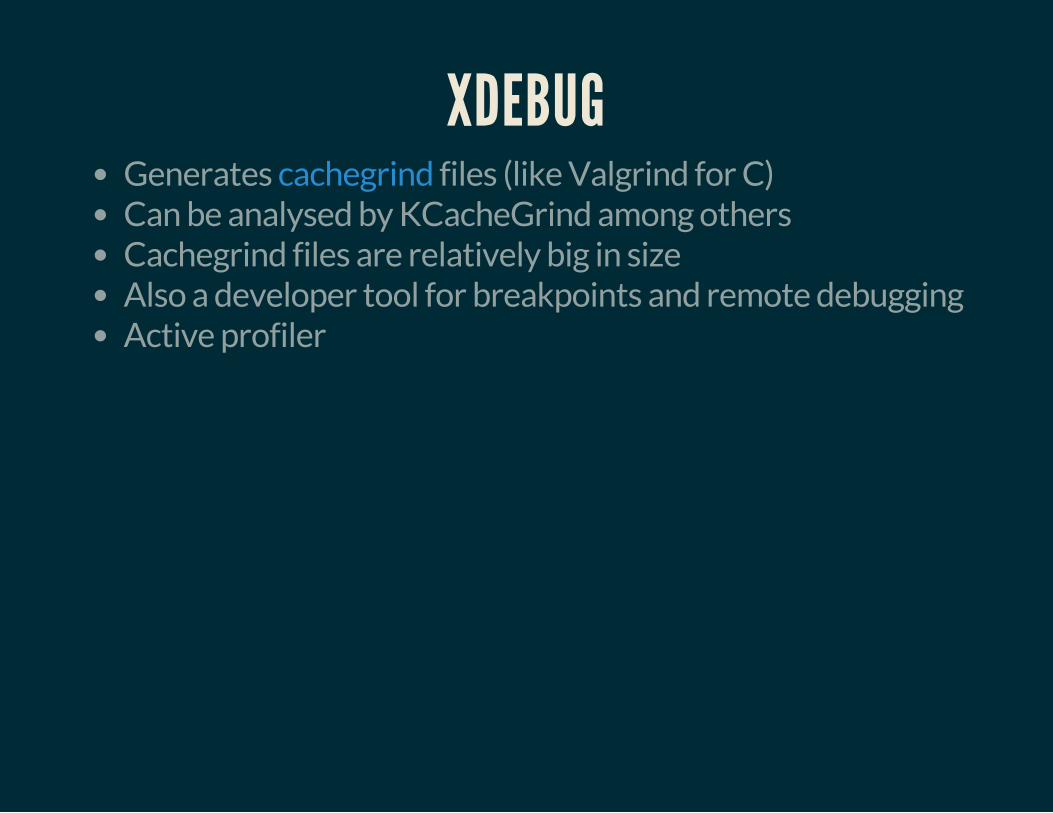
XDEBUGGenerates files (like Valgrind for C)Can be analysed by KCacheGrind among othersCachegrind files are relatively big in sizeAlso a developer tool for breakpoints and remote debuggingActive profiler
cachegrind
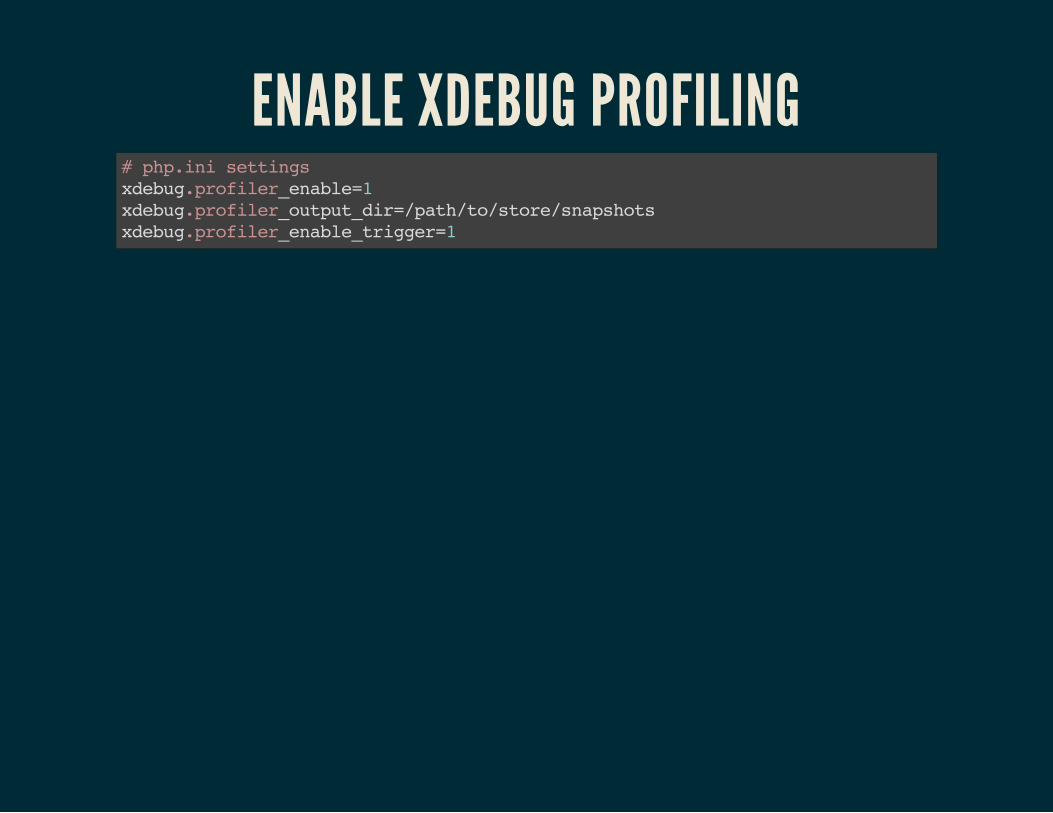
ENABLE XDEBUG PROFILING# php.ini settingsxdebug.profiler_enable=1xdebug.profiler_output_dir=/path/to/store/snapshotsxdebug.profiler_enable_trigger=1
XDEBUG WITH KCACHEGRIND
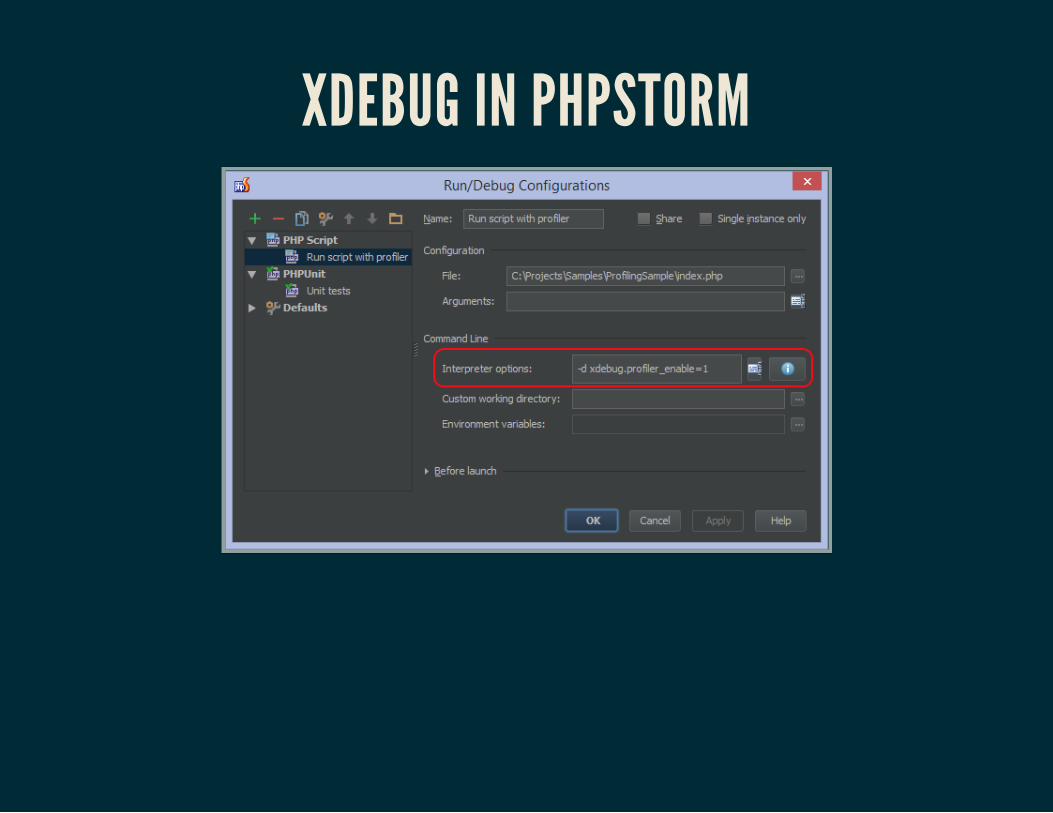
XDEBUG IN PHPSTORM

XDEBUG IN PHPSTORM

XDEBUG IN PHPSTORM

XDEBUG IN PHPSTORM

XHPROF
XHPROFDeveloped by Facebook and released as open-source in 2009PECL extensionLightweight for being a passive profilerIncludes webgui for reviewing and comparing profiling data

# Linux (using apt or yum)apt-get install -y php5-xhprof
# OSX (using homebrew)brew install php56-xhprof
# For Windows, use PECL or download a .dll somewhere, or compile for your own
INSTALLATION

WORDPRESS EXAMPLE// index.php
xhprof_enable(XHPROF_FLAGS_CPU + XHPROF_FLAGS_MEMORY);
/** Loads the WordPress Environment and Template */require( dirname( __FILE__ ) . '/wp-blog-header.php' );
$xhprof_data = xhprof_disable();
include_once 'xhprof_lib/utils/xhprof_lib.php';include_once 'xhprof_lib/utils/xhprof_runs.php';
$xhprof_runs = new XHProfRuns_Default();
$run_id = $xhprof_runs->save_run($xhprof_data, "xhprof_foo");
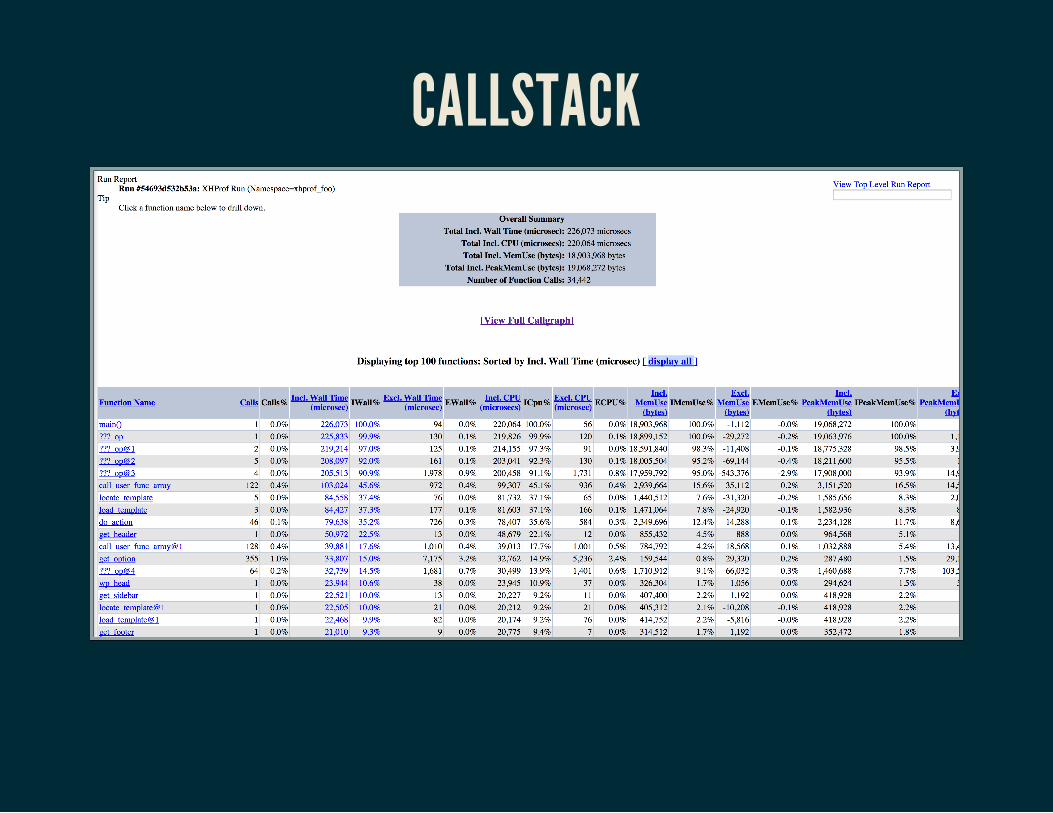
CALLSTACK

CALLGRAPH

CALLGRAPH
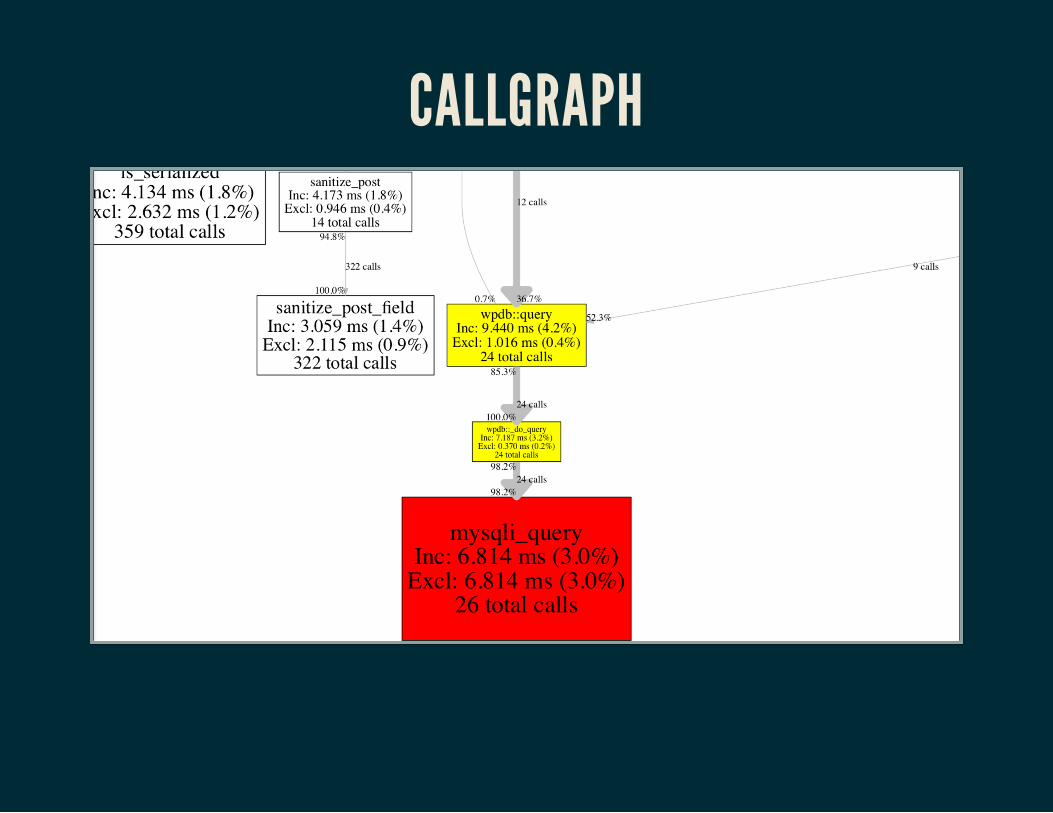
CALLGRAPH
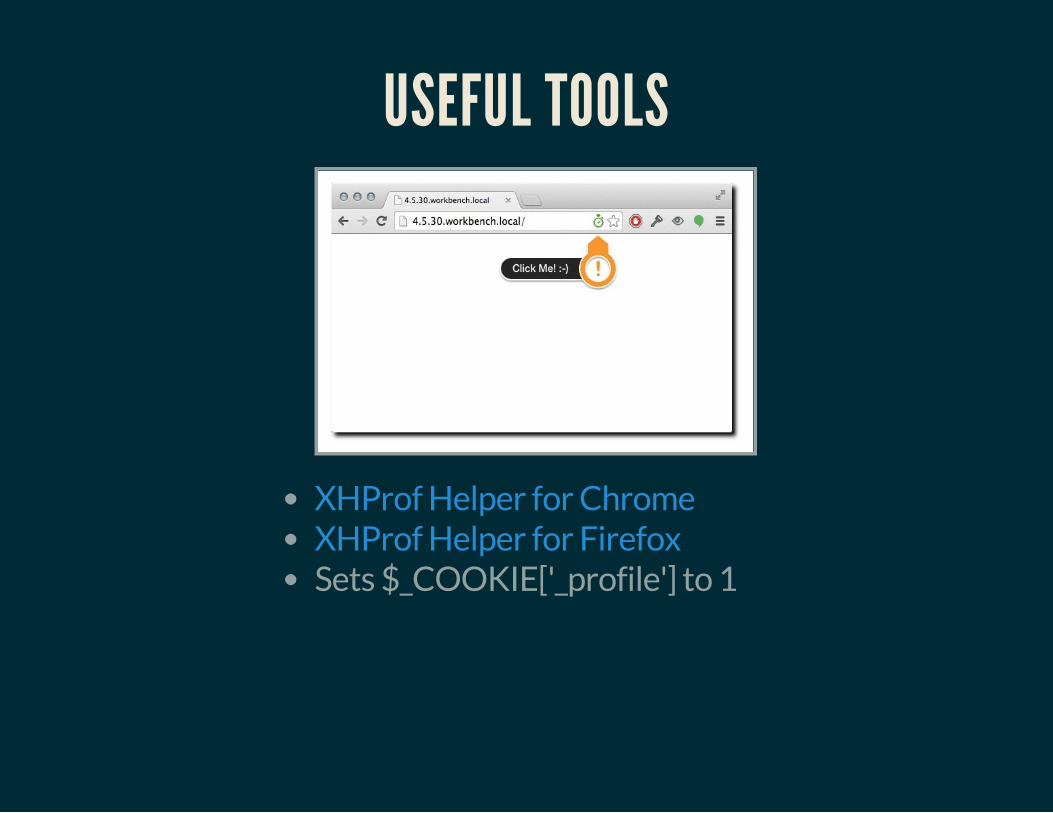
USEFUL TOOLS
Sets $_COOKIE['_profile'] to 1
XHProf Helper for ChromeXHProf Helper for Firefox
XHGUIWeb frontend for profile dataRequires MongoDBShows callstacksShows callgraphsCan compare different runs
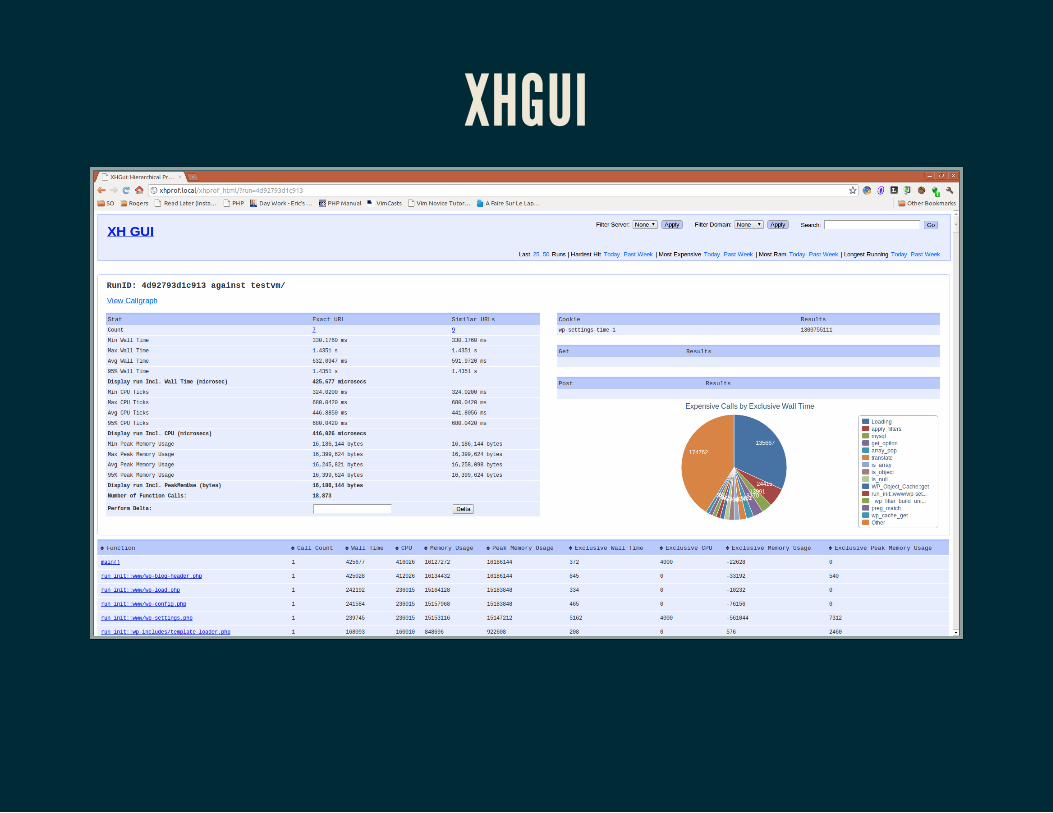
XHGUI
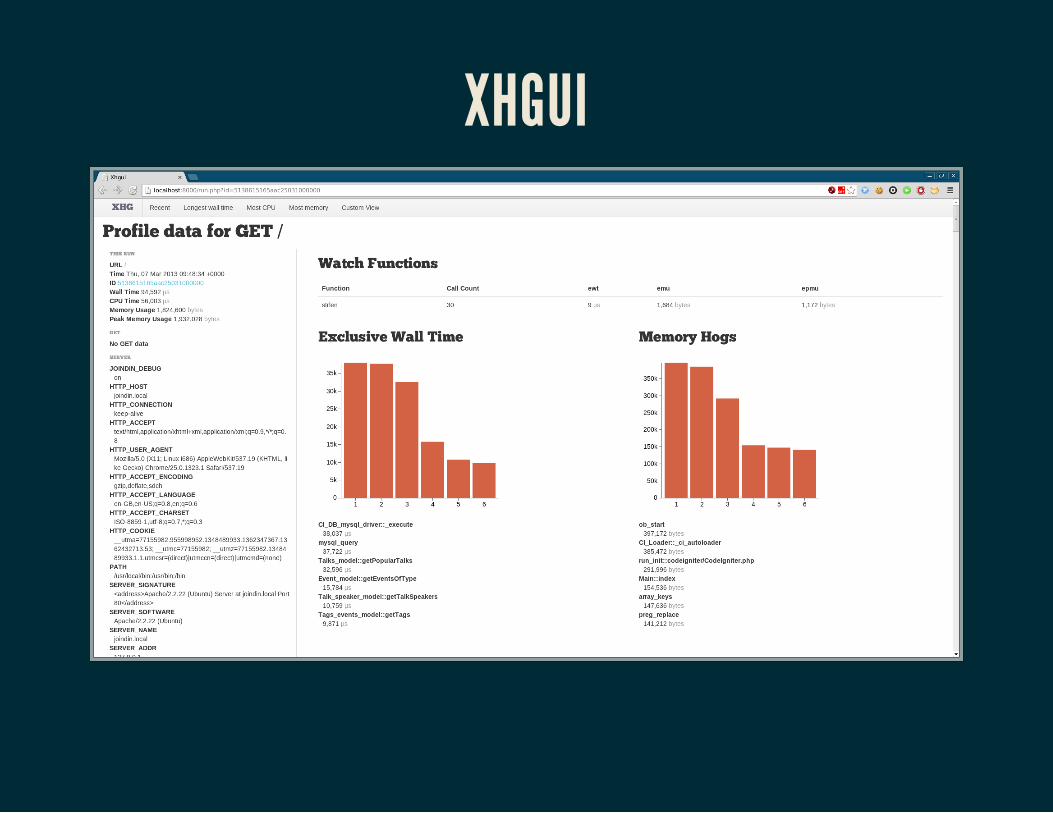
XHGUI
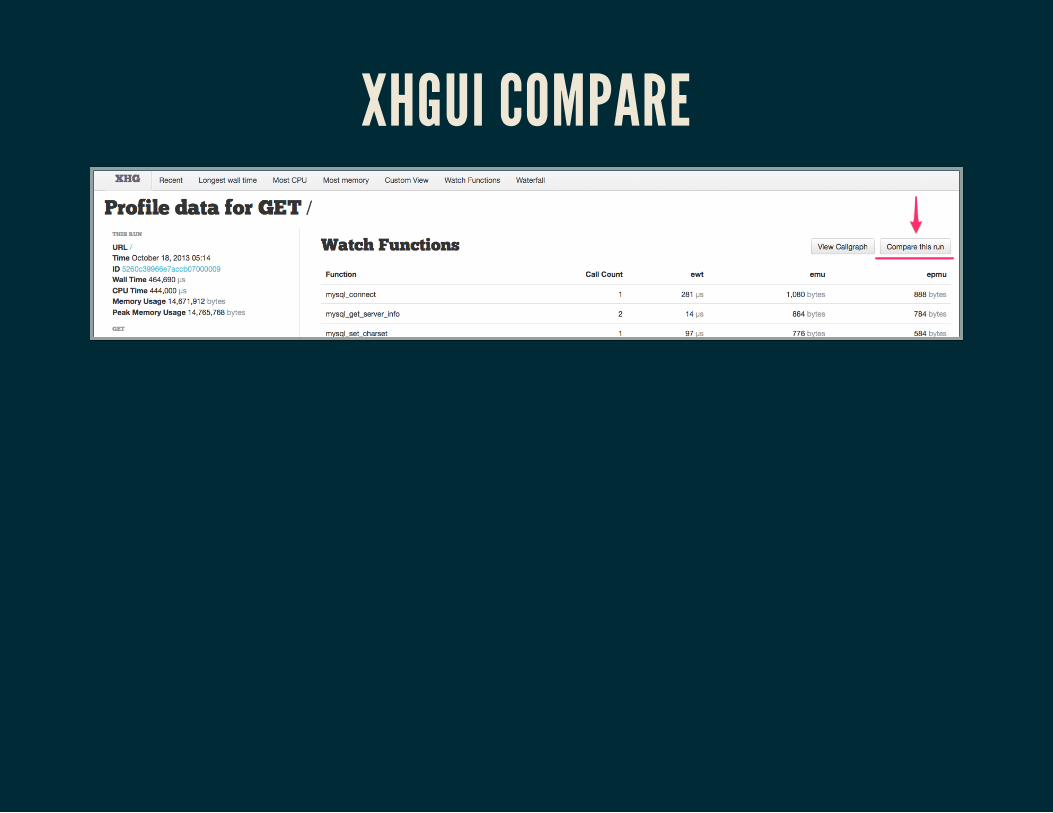
XHGUI COMPARE
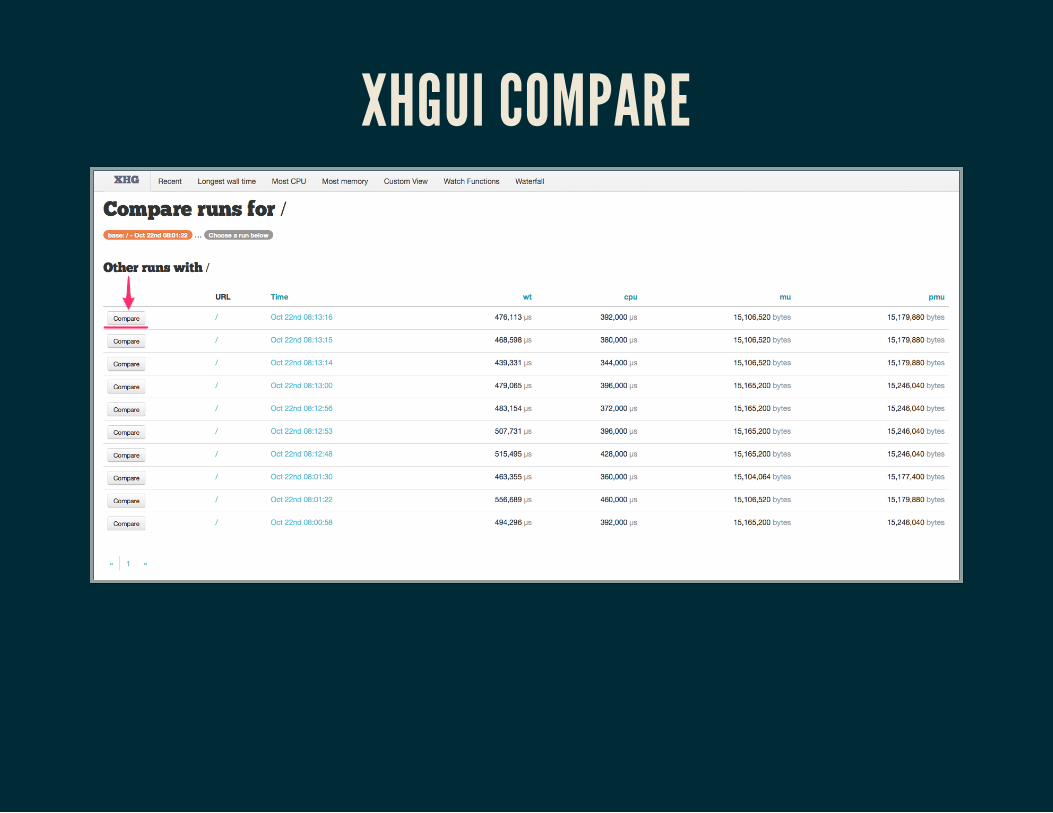
XHGUI COMPARE
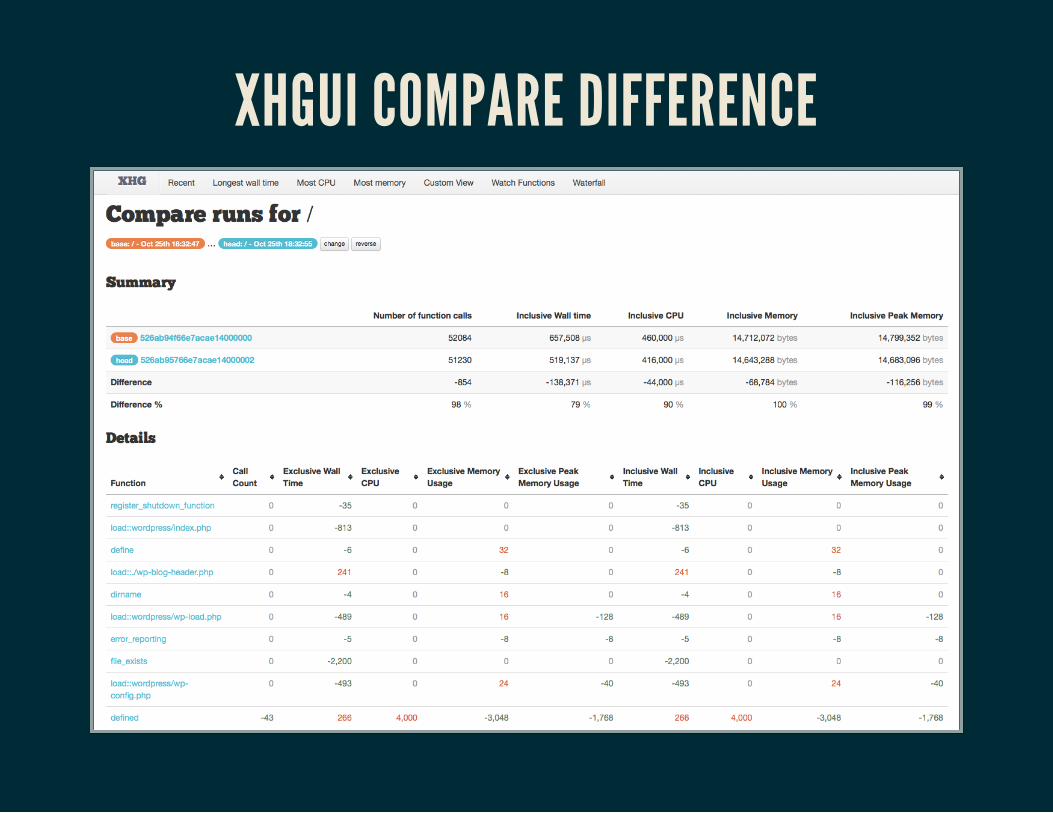
XHGUI COMPARE DIFFERENCE
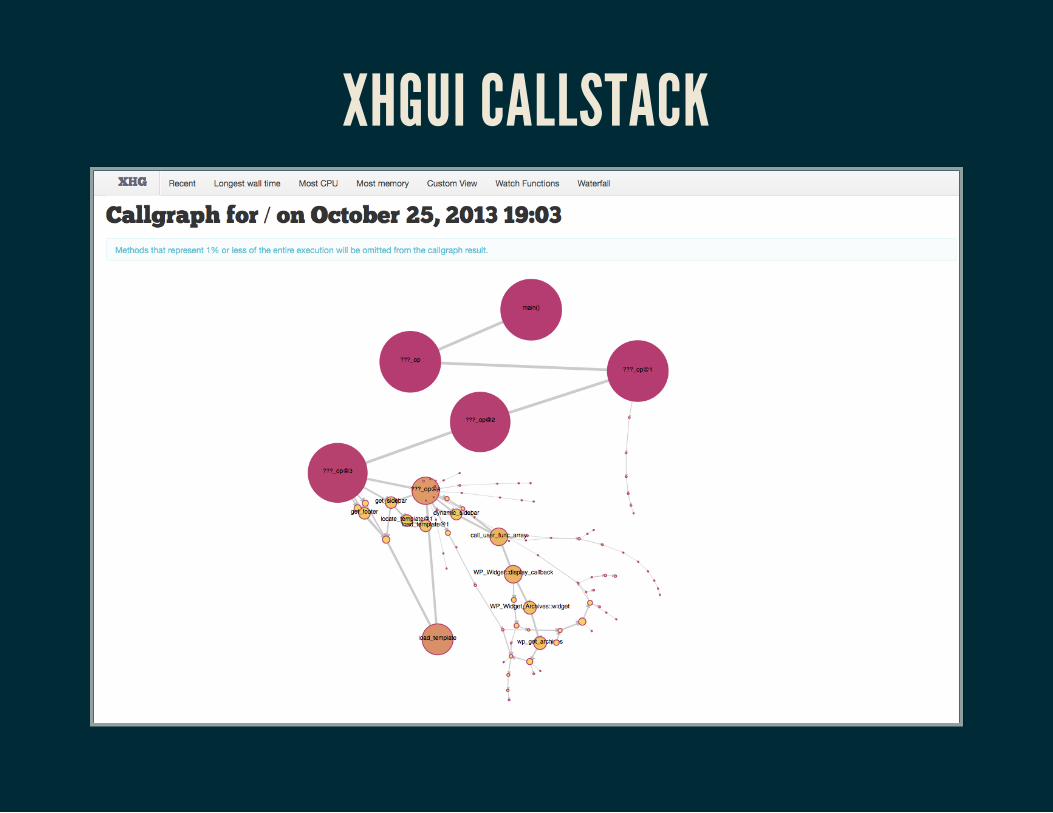
XHGUI CALLSTACK

LINK0(LINK ZERO)
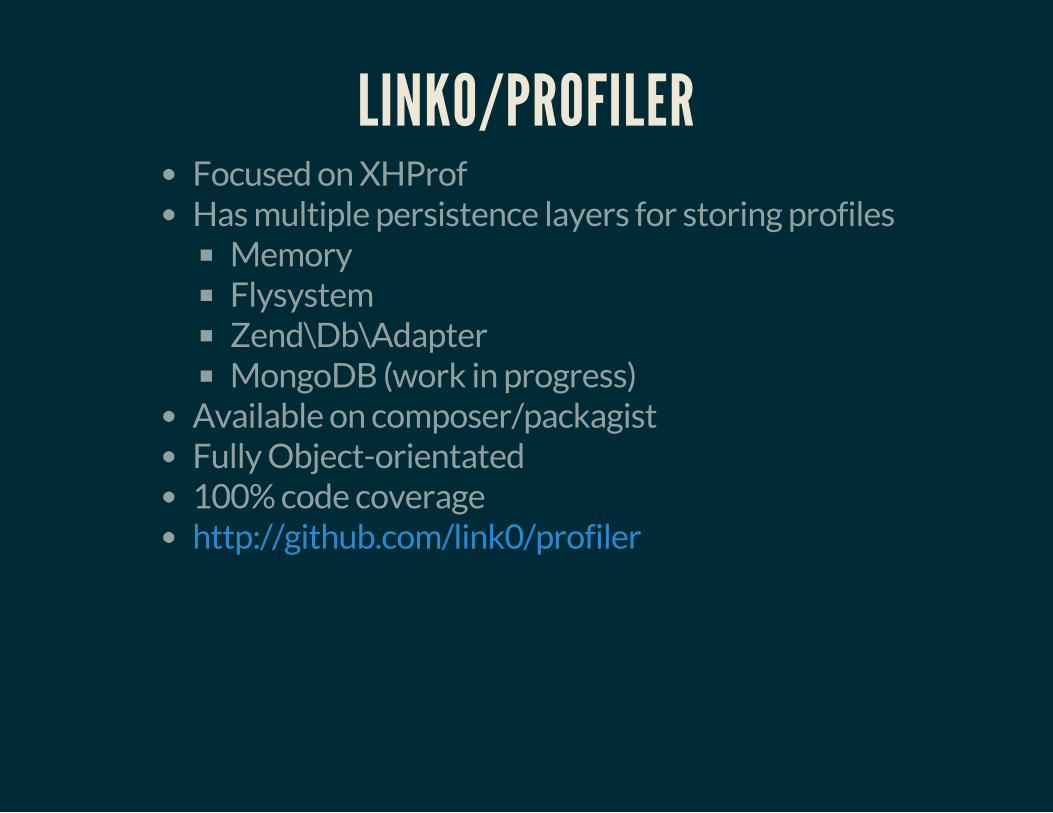
LINK0/PROFILERFocused on XHProfHas multiple persistence layers for storing profiles
MemoryFlysystemZend\Db\AdapterMongoDB (work in progress)
Available on composer/packagistFully Object-orientated100% code coveragehttp://github.com/link0/profiler
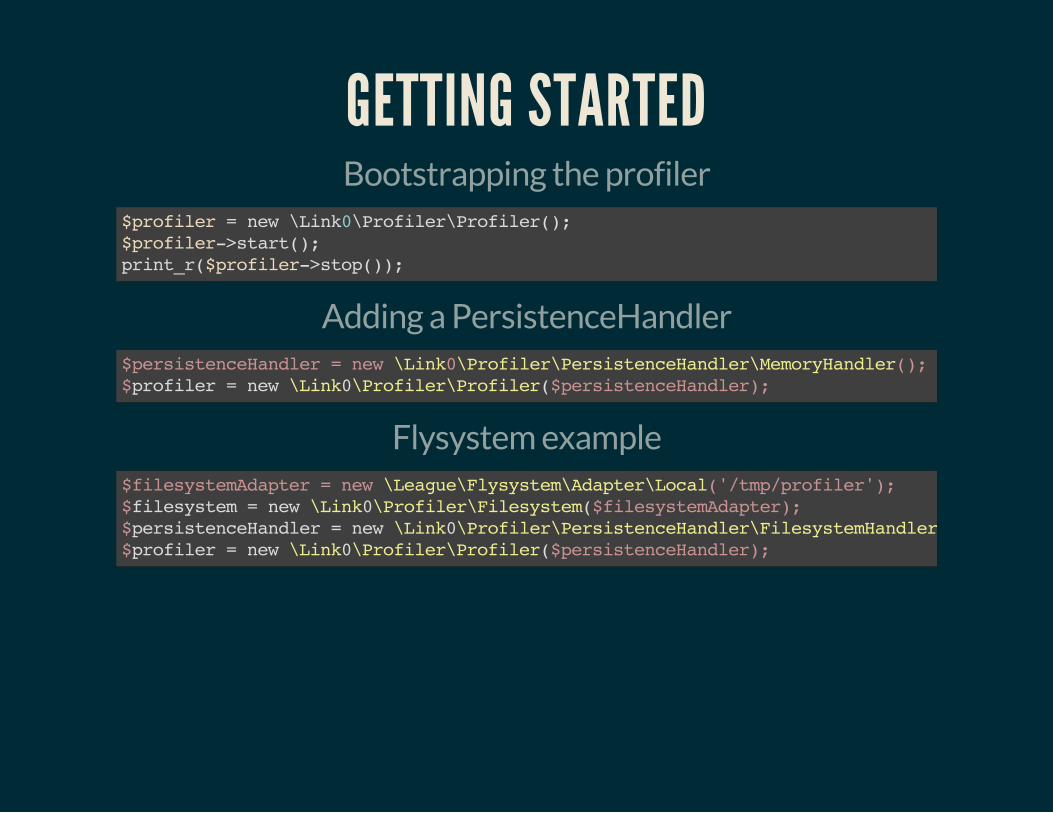
GETTING STARTEDBootstrapping the profiler
$profiler = new \Link0\Profiler\Profiler();$profiler->start();print_r($profiler->stop());
Adding a PersistenceHandler
profiler = new \Link0\Profiler\Profiler($persistenceHandler = new \Link0\Profiler\PersistenceHandler\MemoryHandler();$ $persistenceHandler);
Flysystem example
filesystem = new \Link0\Profiler\Filesystem(persistenceHandler = new \Link0\Profiler\PersistenceHandler\FilesystemHandlerprofiler = new \Link0\Profiler\Profiler(
$filesystemAdapter = new \League\Flysystem\Adapter\Local('/tmp/profiler');$ $filesystemAdapter);$$ $persistenceHandler);

DEMO TIME!OH NOES! IN A TALK?

FUTURE?*EXCITING SOUNDS*
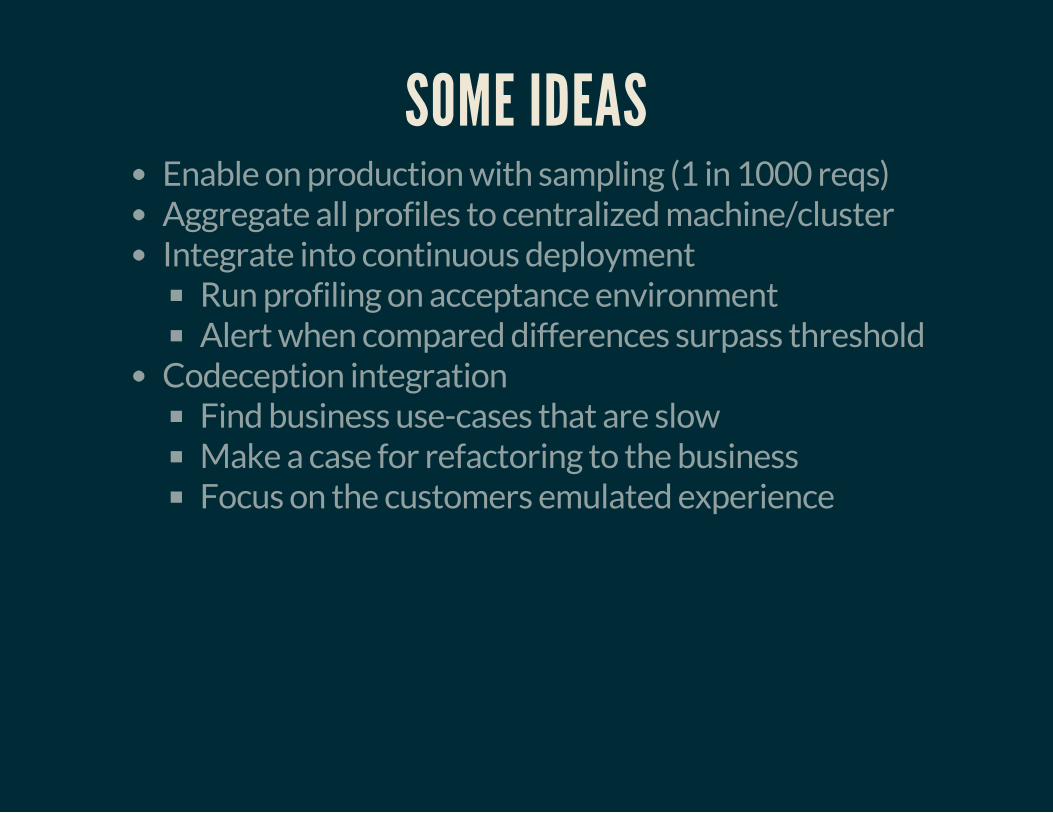
SOME IDEASEnable on production with sampling (1 in 1000 reqs)Aggregate all profiles to centralized machine/clusterIntegrate into continuous deployment
Run profiling on acceptance environmentAlert when compared differences surpass threshold
Codeception integrationFind business use-cases that are slowMake a case for refactoring to the businessFocus on the customers emulated experience

QUESTIONS? I <3 FEEDBACKJoind.in: GitHub: Twitter: IRC: link0 on Freenode
https://joind.in/talk/view/13644http://github.com/dennisdegreef@dennisdegreef
SLIDES ARE ALSO ON JOIND.IN
USEFUL LINKSProfiling PHP with PhpStorm and XdebugProfiling PHP with PhpStorm and Zend DebuggerXDebug Profiler documentationXHProf PHP documentationProfiling with XHProf and XHGuihttp://github.com/link0/profiler