Embed Size (px)
Citation preview
POWER LINE EFFICIENCY ANALYSIS
Presented by Wade ReynoldsJames Madison University – ISAT 493 Senior CapstoneSponsored by Shenandoah Valley Electric Cooperative
INTRODUCTION
In 2010, nearly 8 GWh were lost from transmission and distribution in Virginia alone
Equivalent to enough energy to power 1.3 million homes
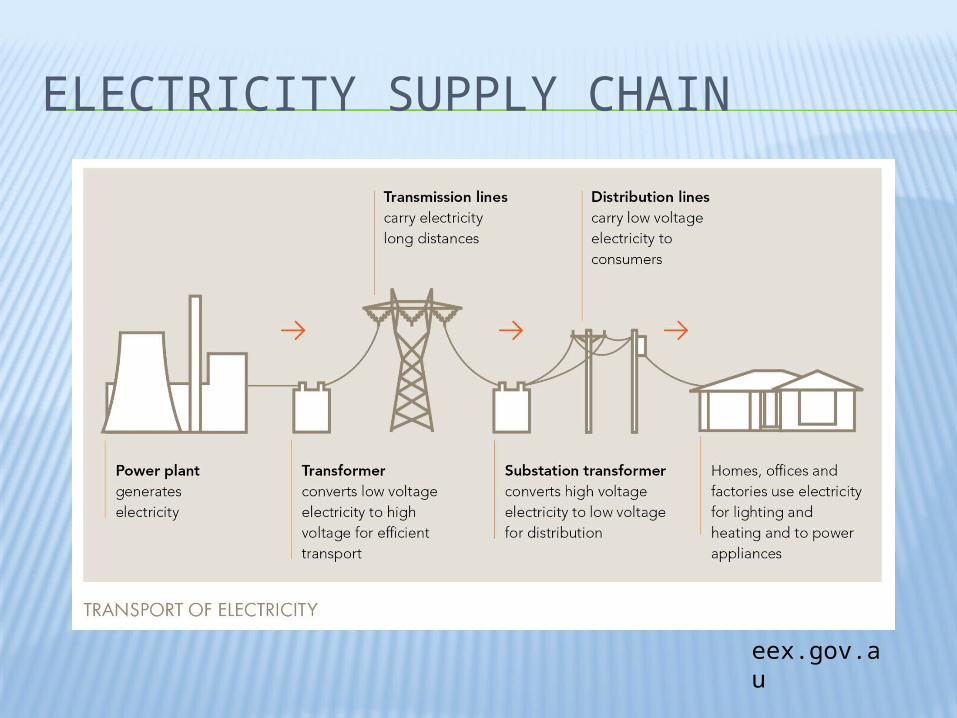
ELECTRICITY SUPPLY CHAIN
eex.gov.au
IMPORTANT EQUATIONS
Power = Current x Voltage Power Loss = Current2 x Resistance
PURPOSE
Determine power loss across system and find technological solutions that can be implemented to improve efficiency and reduce loss
BACKGROUND
The Rural Electrification Act of 1936 provided federal assistance for rural electrification
RECs are private, non-profit utilities owned by the customers they serve
Two types of RECs: Generation and Distribution
SVEC is a Distribution cooperative that serves nearly 90,000 customers across western Virginia
RESEARCH QUESTIONS
What are the sources of loss in the system?
Are technologies currently available to replace SVEC’s current technology and improve efficiency?
Are these technologies cost-effective? What will improved efficiency mean to
SVEC and its customers?
METHODOLOGY
SCADA software was used to find the current and voltage at five strategic points across the system
Focus is on losses due to inefficiency in conductors and transformers
All formulas and methods used are consistent with industry standards and relative to the desired level of accuracy we wish to achieve
CLOVER HILL SYSTEM
Clover Hill Line extends 10.6 miles from the Dayton Substation
Conductor type = 1/0 Raven ACSR A single substation transformer and
1,415 distribution transformers located along the line Substation transformer rated at 100 MVA
capacity Each distribution transformer rated at ~10
kVA capacity
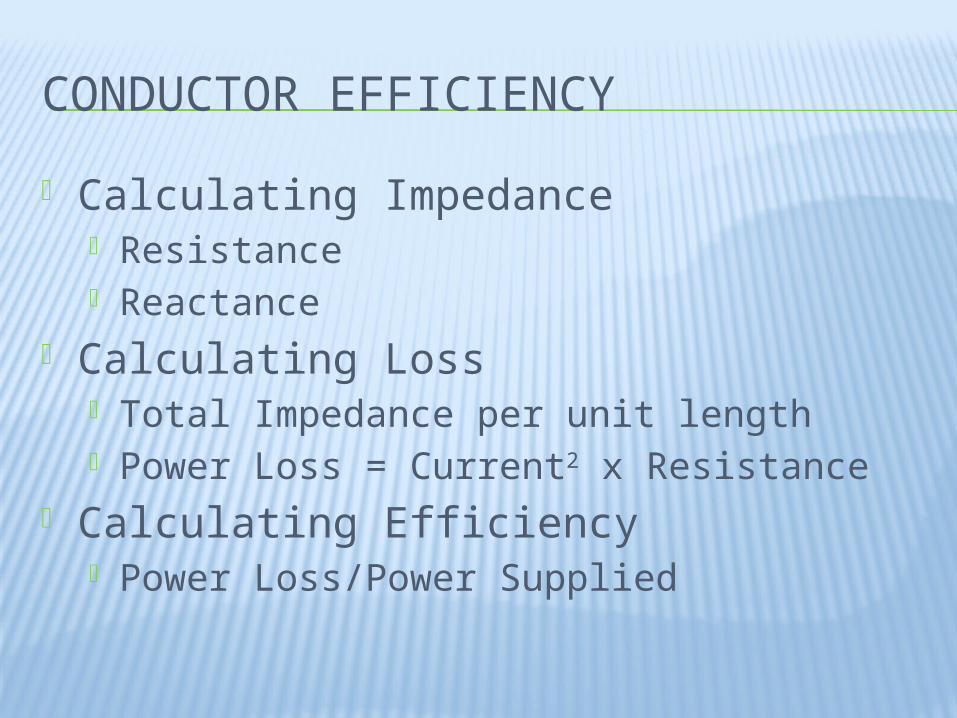
CONDUCTOR EFFICIENCY
Calculating Impedance Resistance Reactance
Calculating Loss Total Impedance per unit length Power Loss = Current2 x Resistance
Calculating Efficiency Power Loss/Power Supplied
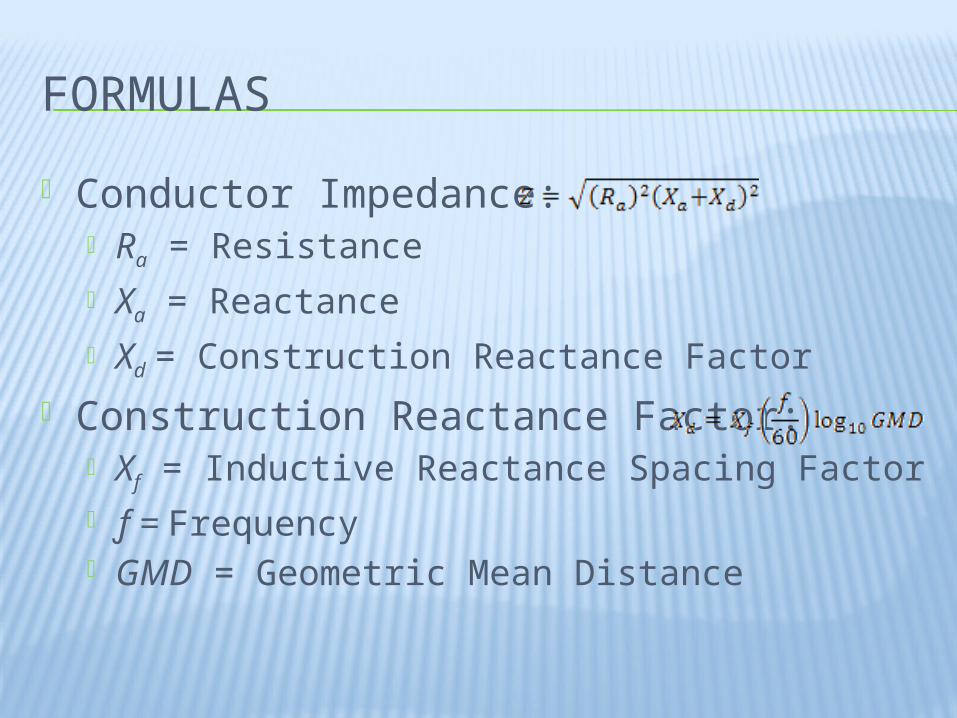
FORMULAS
Conductor Impedance: Ra = Resistance Xa = Reactance Xd = Construction Reactance Factor
Construction Reactance Factor: Xf = Inductive Reactance Spacing Factor ƒ = Frequency GMD = Geometric Mean Distance
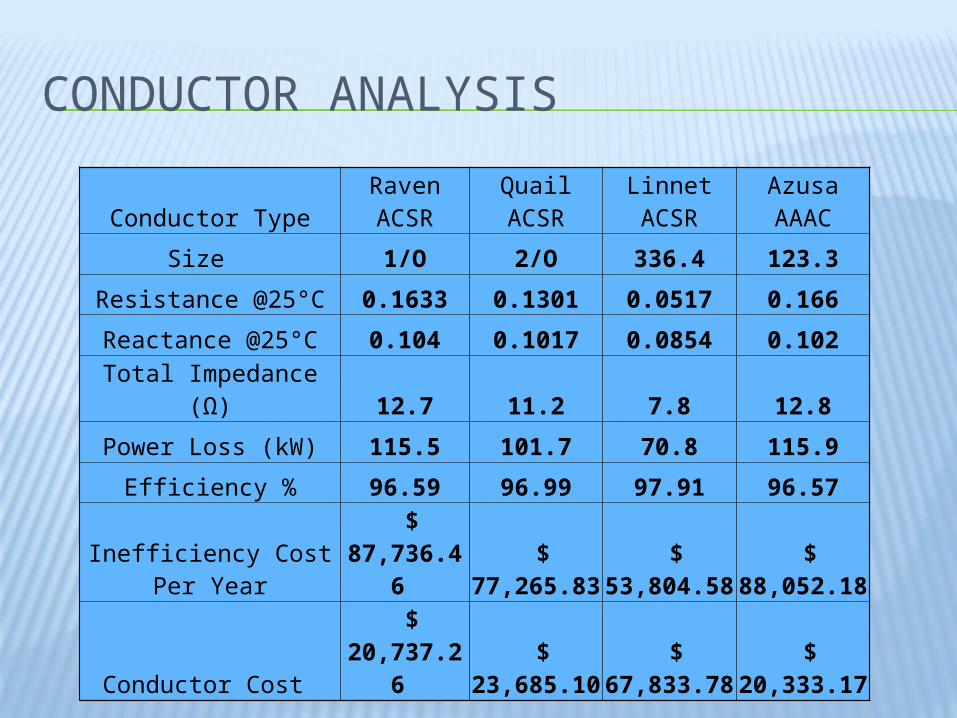
CONDUCTOR ANALYSIS
Conductor Type Raven ACSR Quail ACSR Linnet ACSR Azusa AAAC
Size 1/O 2/O 336.4 123.3
Resistance @25°C 0.1633 0.1301 0.0517 0.166
Reactance @25°C 0.104 0.1017 0.0854 0.102
Total Impedance (Ω) 12.7 11.2 7.8 12.8
Power Loss (kW) 115.5 101.7 70.8 115.9
Efficiency % 96.59 96.99 97.91 96.57
Inefficiency Cost Per Year $ 87,736.46 $ 77,265.83 $ 53,804.58 $ 88,052.18
Conductor Cost $ 20,737.26 $ 23,685.10 $ 67,833.78 $ 20,333.17
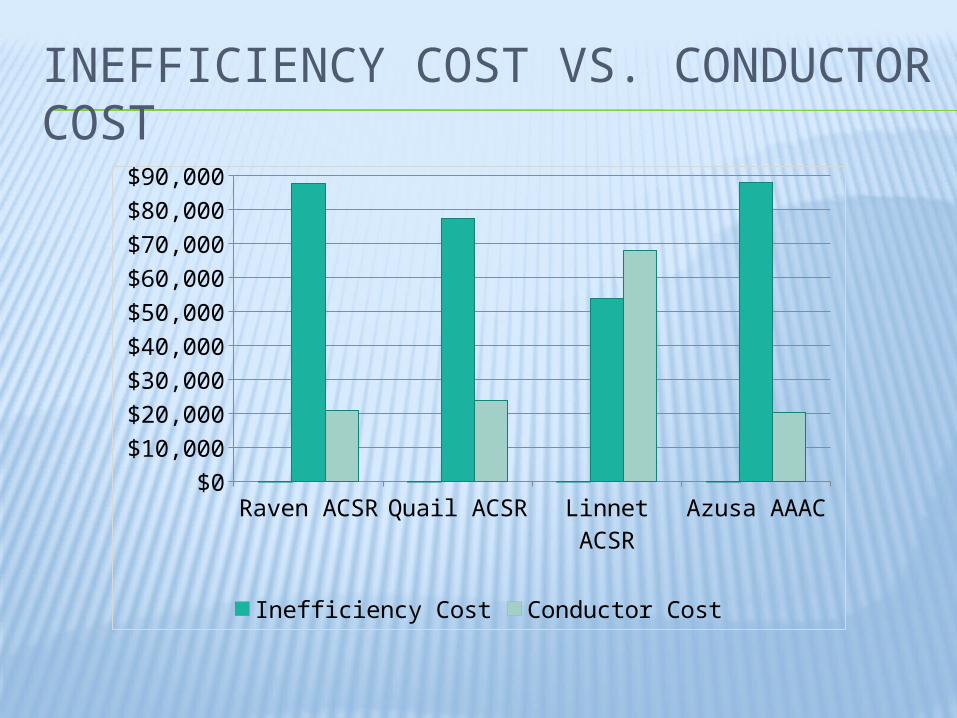
INEFFICIENCY COST VS. CONDUCTOR COST
Raven ACSR
Quail ACSR Linnet ACSR
Azusa AAAC
$0
$10,000
$20,000
$30,000
$40,000
$50,000
$60,000
$70,000
$80,000
$90,000
Inefficiency Cost Conductor Cost
TRANSFORMER EFFICIENCY
Transformers incur two types of losses No-Load Load
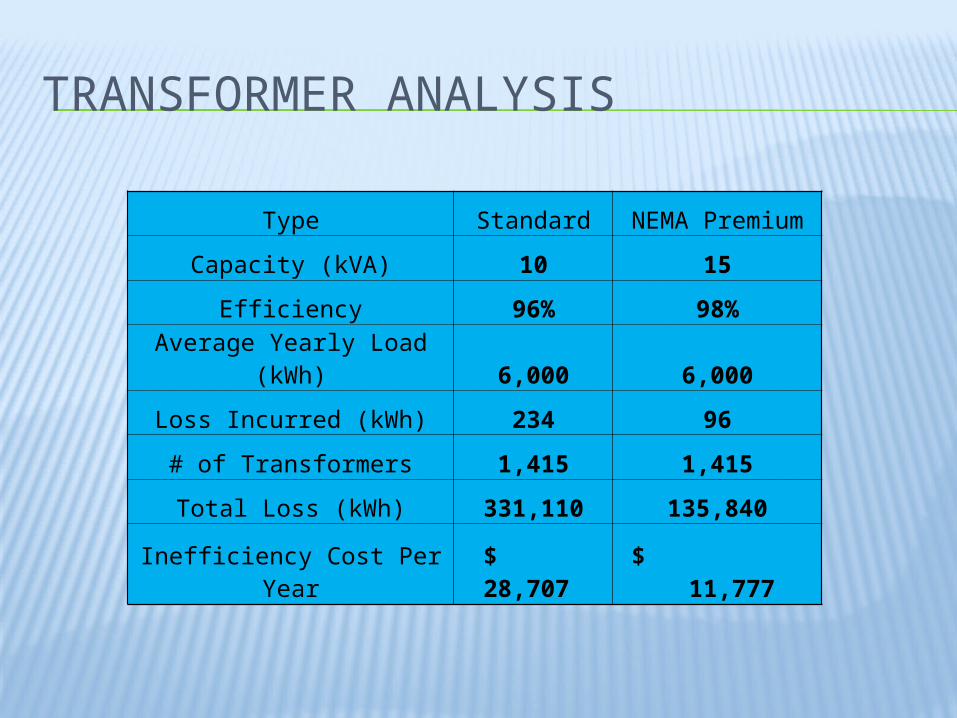
TRANSFORMER ANALYSIS
Type Standard NEMA Premium
Capacity (kVA) 10 15
Efficiency 96% 98%
Average Yearly Load (kWh) 6,000 6,000
Loss Incurred (kWh) 234 96
# of Transformers 1,415 1,415
Total Loss (kWh) 331,110 135,840
Inefficiency Cost Per Year $ 28,707 $ 11,777
RESULTS AND FINDINGS
Linnet conductor will have a payback period of less than 2 years
NEMA Premium transformers will save nearly $17,000 annually in power losses
TECHNOLOGY SOLUTIONS
High-Efficiency Conductors ACCC cut line loss by 30-40% under equal
load NEMA Premium Efficient Transformers
Meet or exceed DOEs efficiency requirements
Smart-Grid Devices Two-way communication provides real-time
information to ensure system is operating at optimal levels
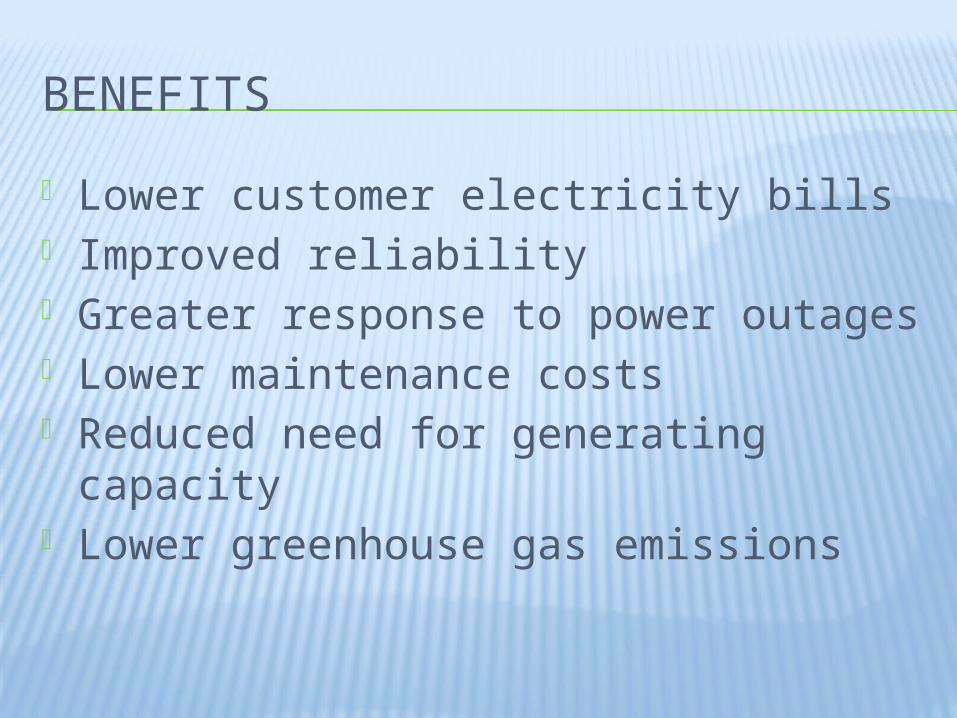
BENEFITS
Lower customer electricity bills Improved reliability Greater response to power outages Lower maintenance costs Reduced need for generating capacity Lower greenhouse gas emissions
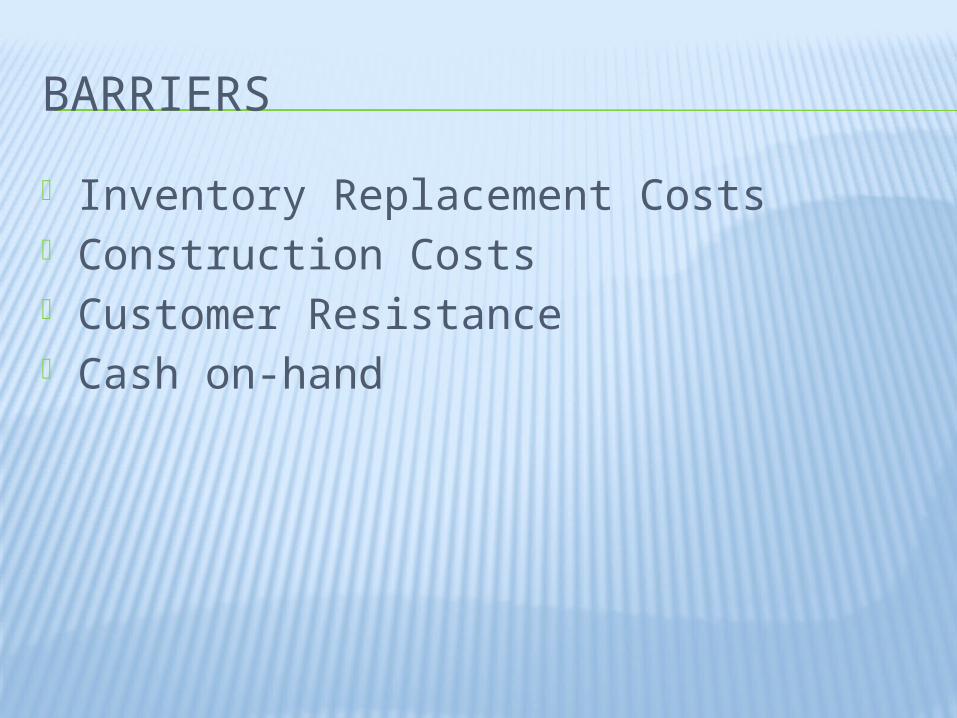
BARRIERS
Inventory Replacement Costs Construction Costs Customer Resistance Cash on-hand
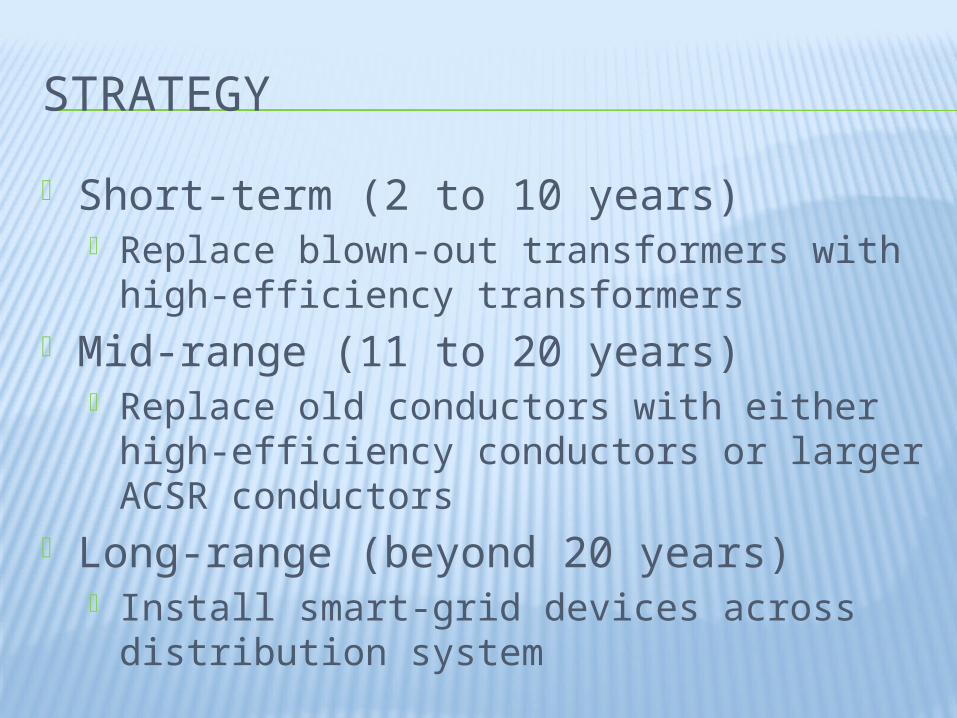
STRATEGY
Short-term (2 to 10 years) Replace blown-out transformers with high-
efficiency transformers Mid-range (11 to 20 years)
Replace old conductors with either high-efficiency conductors or larger ACSR conductors
Long-range (beyond 20 years) Install smart-grid devices across
distribution system
QUESTIONS?