Embed Size (px)
Citation preview

Diagnosing PostgreSQL
Tuesday, October 22, 13

What the hell do I know?
Tuesday, October 22, 13

Everything you need to know about making PG
perform well.
Tuesday, October 22, 13
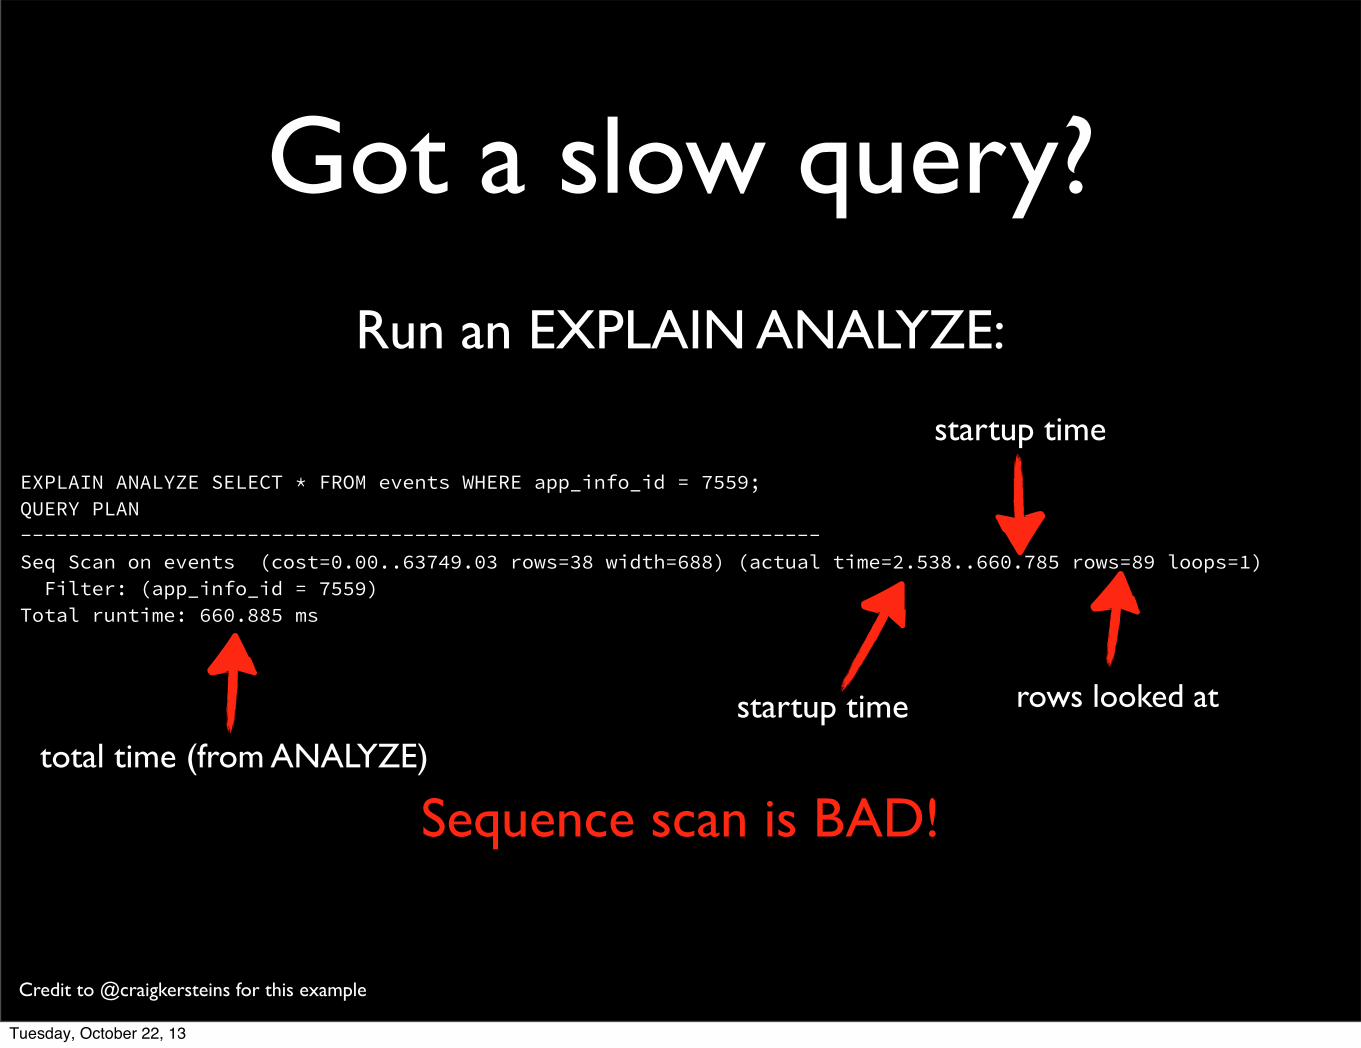
Got a slow query?Run an EXPLAIN ANALYZE:
EXPLAIN ANALYZE SELECT * FROM events WHERE app_info_id = 7559; QUERY PLAN-------------------------------------------------------------------Seq Scan on events (cost=0.00..63749.03 rows=38 width=688) (actual time=2.538..660.785 rows=89 loops=1) Filter: (app_info_id = 7559)Total runtime: 660.885 ms
Sequence scan is BAD!
Credit to @craigkersteins for this example
startup time
startup time
rows looked at
total time (from ANALYZE)
Tuesday, October 22, 13

Need extra help?
• http://explain.depesz.com/s/Aa3
Tuesday, October 22, 13
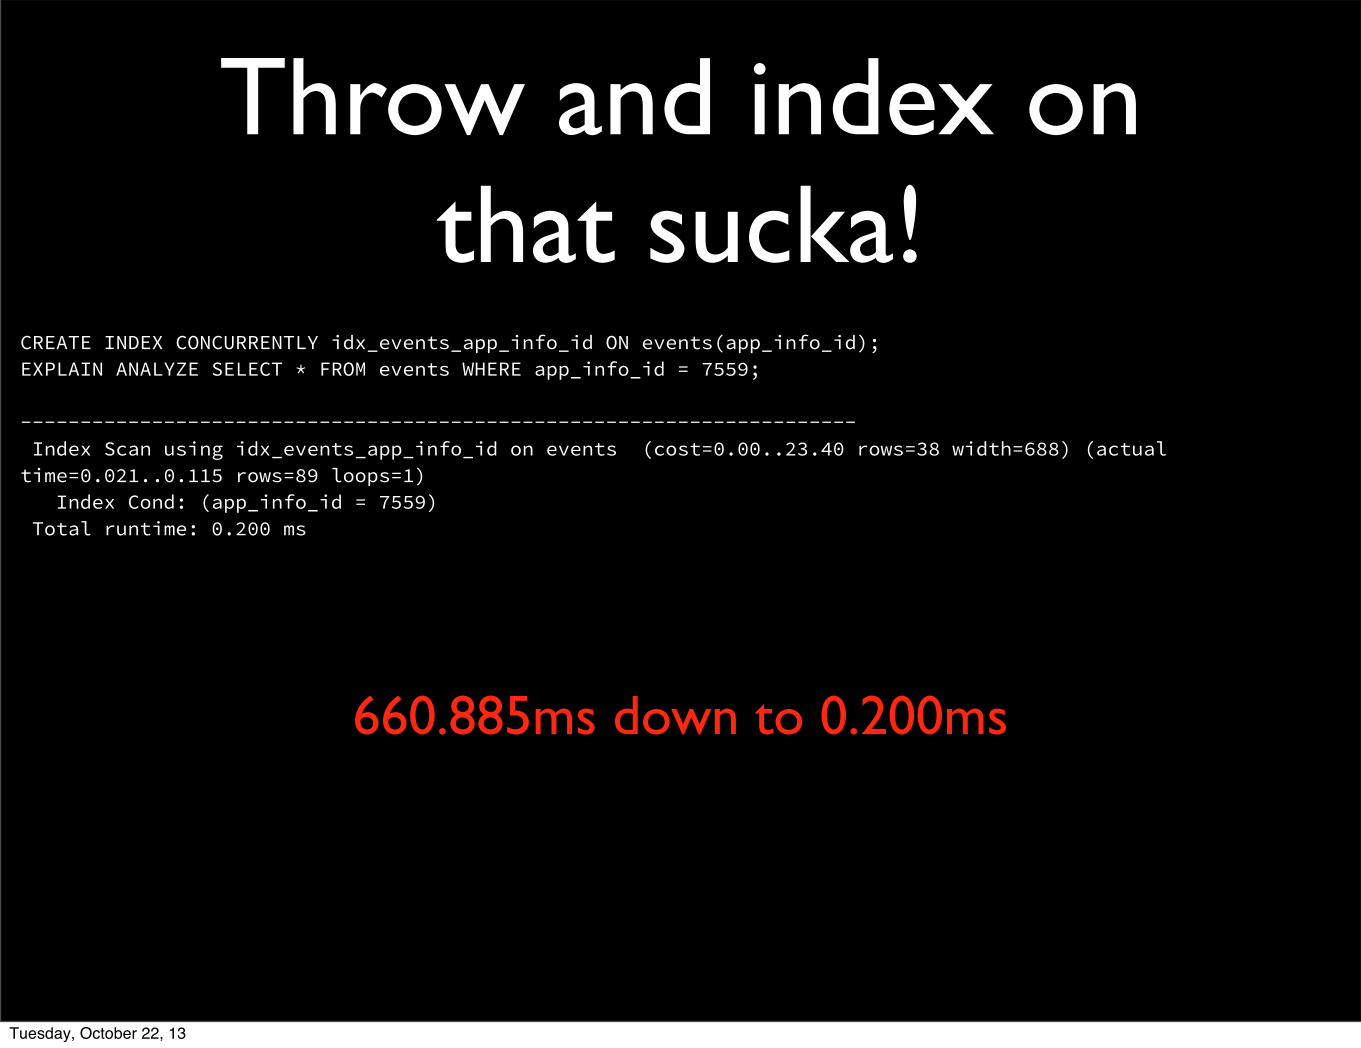
Throw and index on that sucka!
CREATE INDEX CONCURRENTLY idx_events_app_info_id ON events(app_info_id);EXPLAIN ANALYZE SELECT * FROM events WHERE app_info_id = 7559;
---------------------------------------------------------------------- Index Scan using idx_events_app_info_id on events (cost=0.00..23.40 rows=38 width=688) (actual time=0.021..0.115 rows=89 loops=1) Index Cond: (app_info_id = 7559) Total runtime: 0.200 ms
660.885ms down to 0.200ms
Tuesday, October 22, 13
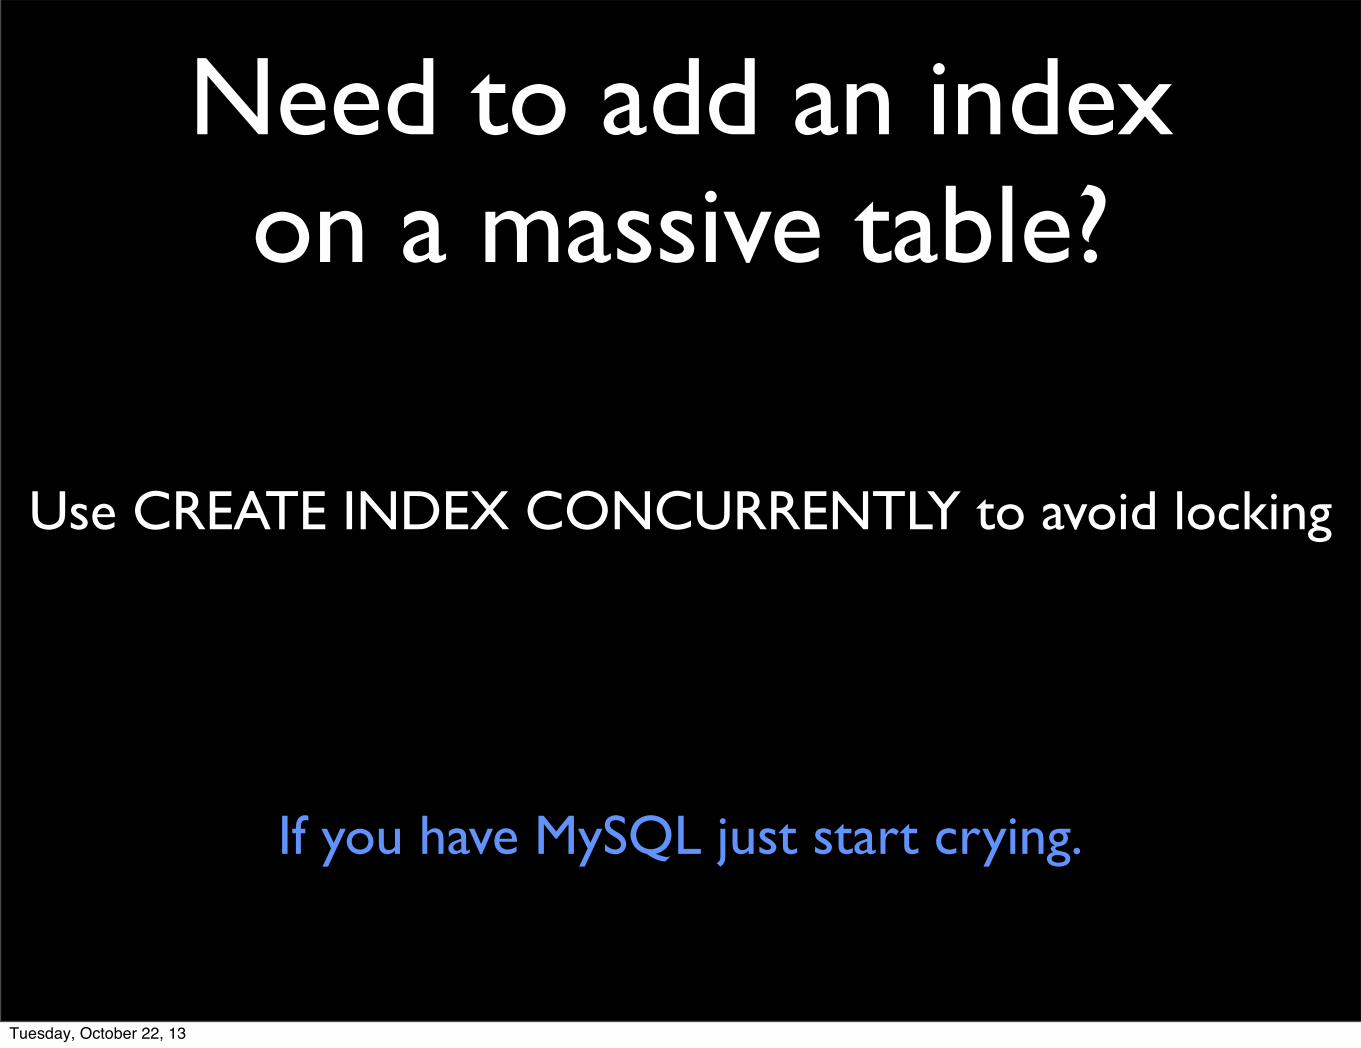
Need to add an index on a massive table?
Use CREATE INDEX CONCURRENTLY to avoid locking
If you have MySQL just start crying.
Tuesday, October 22, 13
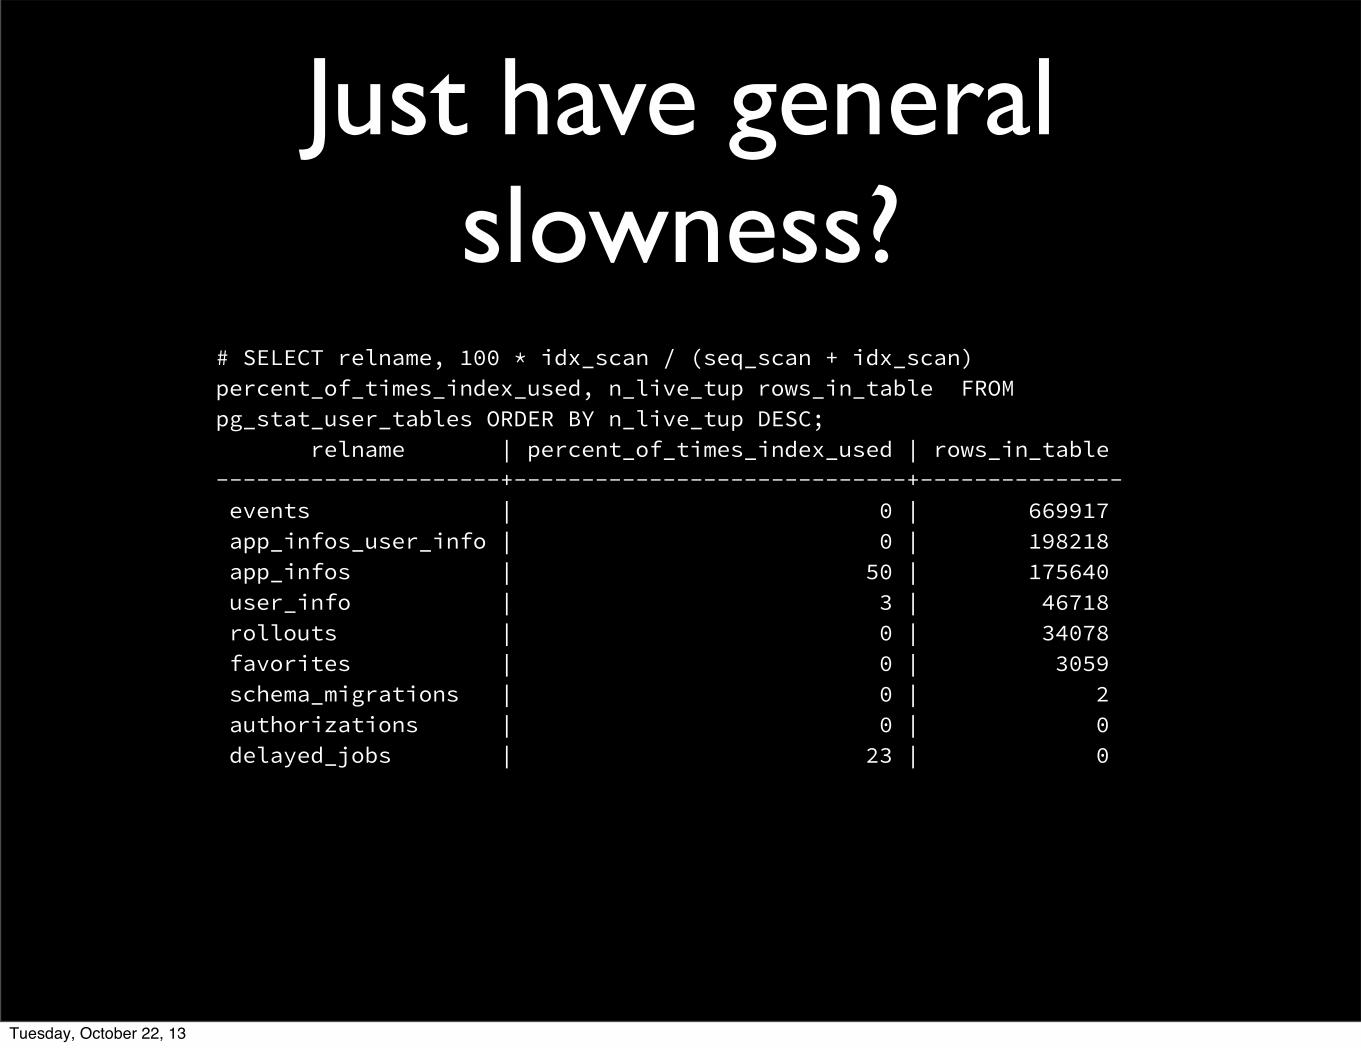
Just have general slowness?
# SELECT relname, 100 * idx_scan / (seq_scan + idx_scan) percent_of_times_index_used, n_live_tup rows_in_table FROM pg_stat_user_tables ORDER BY n_live_tup DESC; relname | percent_of_times_index_used | rows_in_table ---------------------+-----------------------------+--------------- events | 0 | 669917 app_infos_user_info | 0 | 198218 app_infos | 50 | 175640 user_info | 3 | 46718 rollouts | 0 | 34078 favorites | 0 | 3059 schema_migrations | 0 | 2 authorizations | 0 | 0 delayed_jobs | 23 | 0
Tuesday, October 22, 13
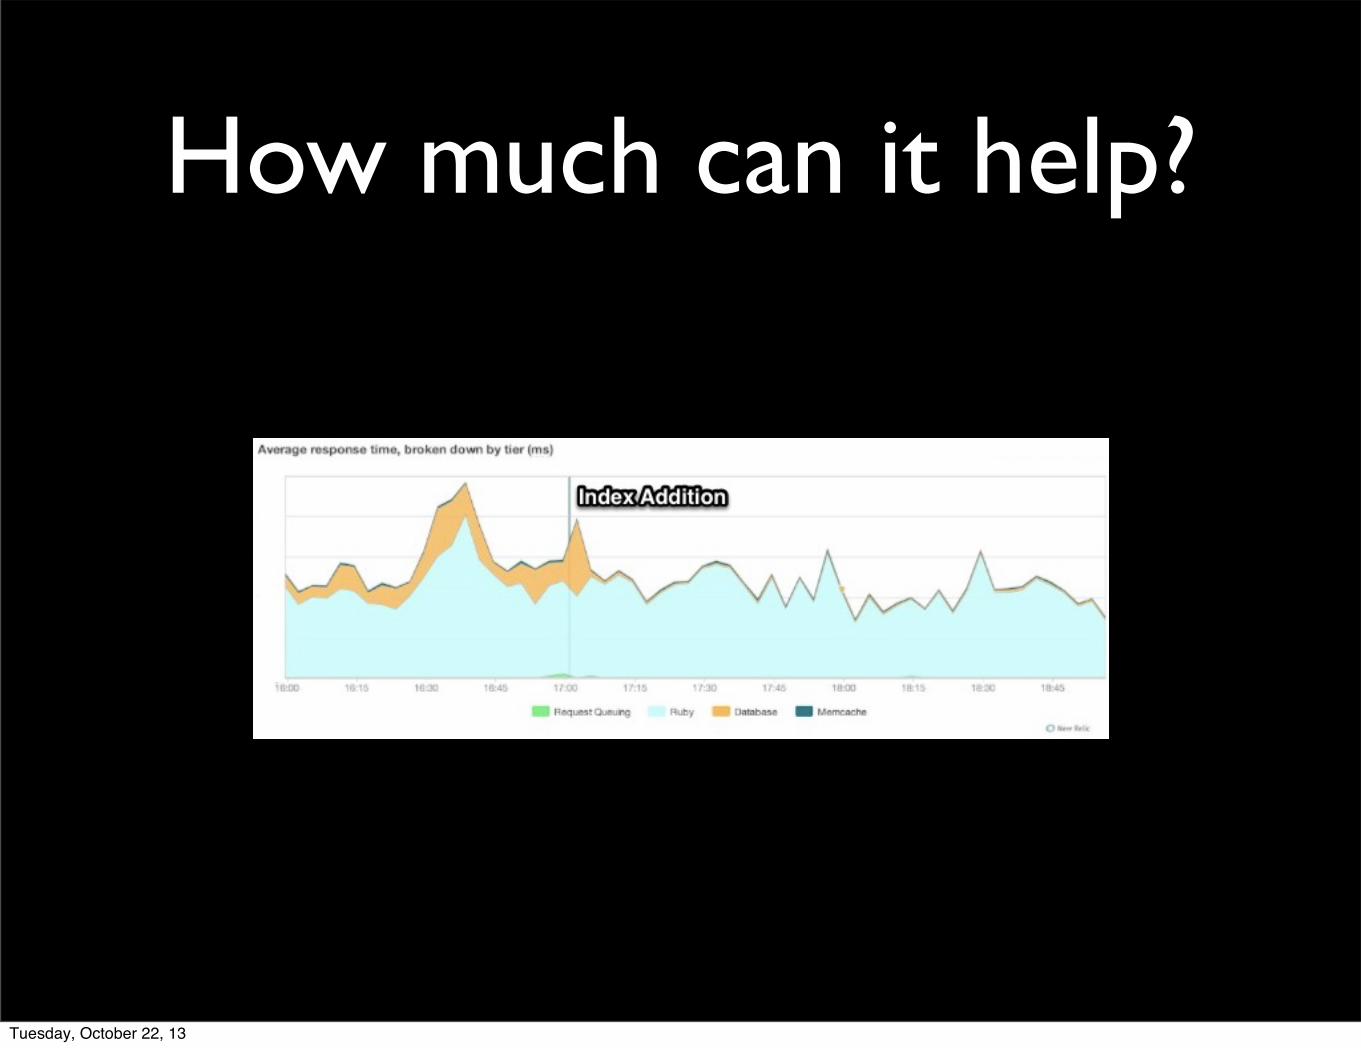
How much can it help?
Tuesday, October 22, 13

Don’t just add indexes because it seems like a good idea!!
Tuesday, October 22, 13

INSERT/UPDATE/DELETE requires rebuilding that index
Tuesday, October 22, 13

It’s possible you are using 2 indexes to solve the same problem,
requiring both to be in cache.
Tuesday, October 22, 13

Keep your indexes small!
Tuesday, October 22, 13

Only need to index part of the data?
CREATE INDEX access_log_client_ip_ix ON access_log (client_ip) WHERE NOT (client_ip > inet '192.168.100.0' AND client_ip < inet '192.168.100.255');
Tuesday, October 22, 13

Golden rules on PG performance
• Use indexes when you see seq scan
• Keep index size in check
• Make sure you don’t have duplicate indexes
Tuesday, October 22, 13

MOST IMPORTANT RULE EVER
Tuesday, October 22, 13

You do NOT understand the query planner.
Tuesday, October 22, 13

Use EXPLAIN/ANALYZE to test your theories.
Try alternative index types/strategies/data types.Tuesday, October 22, 13

I don’t like remembering these queries!
And hopefully you’re using Heroku Postgres.
Tuesday, October 22, 13

Heroku PG Extras
https://github.com/heroku/heroku-pg-extras/
Tuesday, October 22, 13
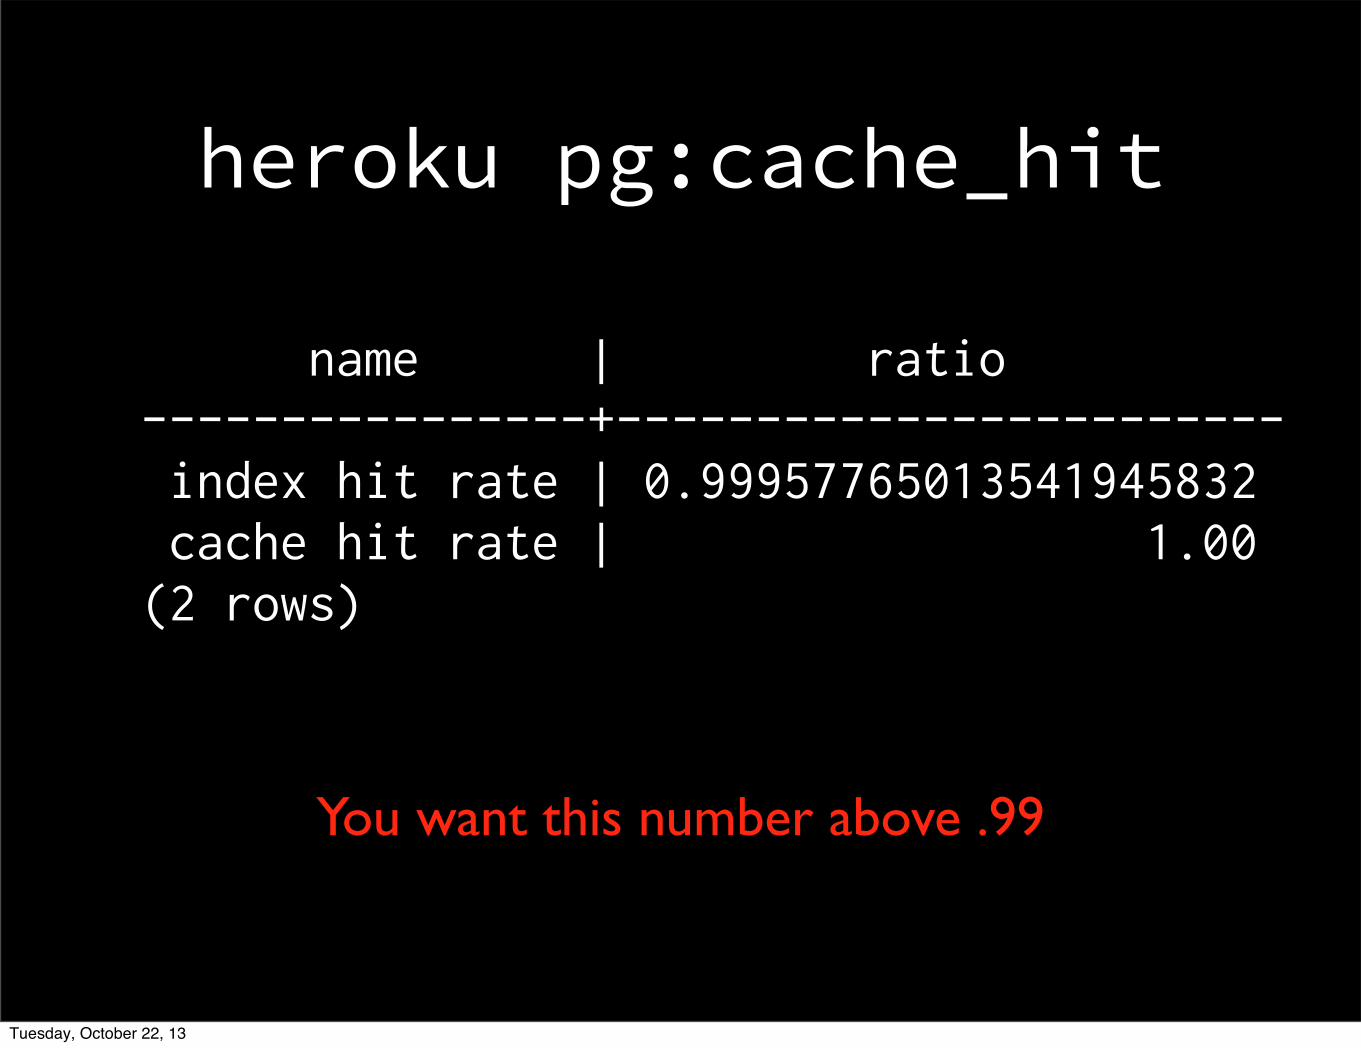
heroku pg:cache_hit
name | ratio----------------+------------------------ index hit rate | 0.99957765013541945832 cache hit rate | 1.00(2 rows)
You want this number above .99
Tuesday, October 22, 13
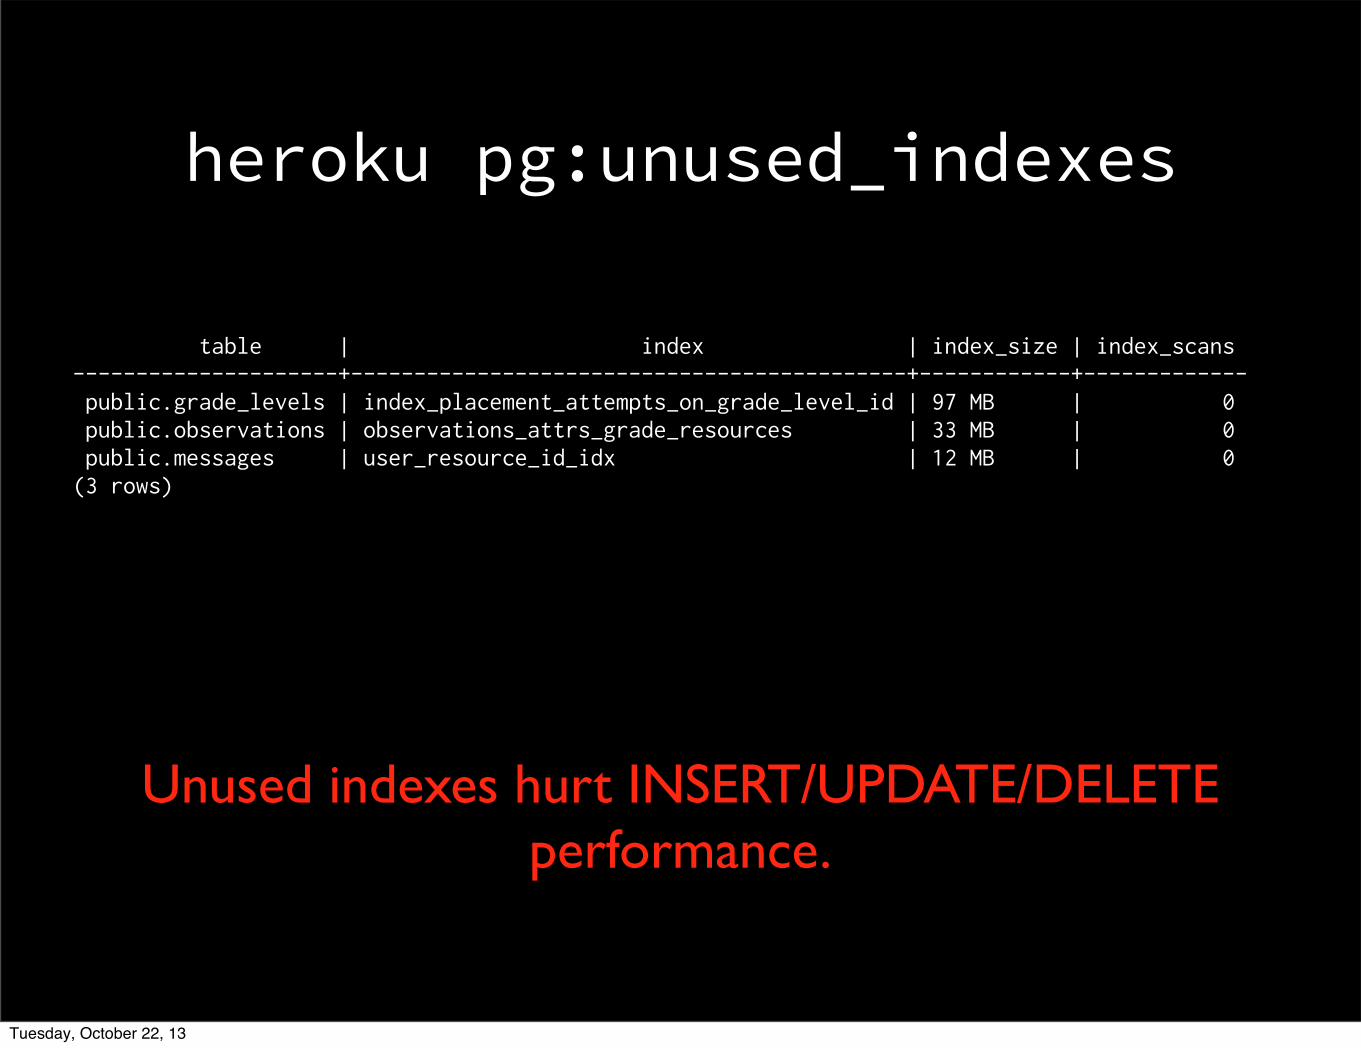
heroku pg:unused_indexes
table | index | index_size | index_scans---------------------+--------------------------------------------+------------+------------- public.grade_levels | index_placement_attempts_on_grade_level_id | 97 MB | 0 public.observations | observations_attrs_grade_resources | 33 MB | 0 public.messages | user_resource_id_idx | 12 MB | 0(3 rows)
Unused indexes hurt INSERT/UPDATE/DELETE performance.
Tuesday, October 22, 13
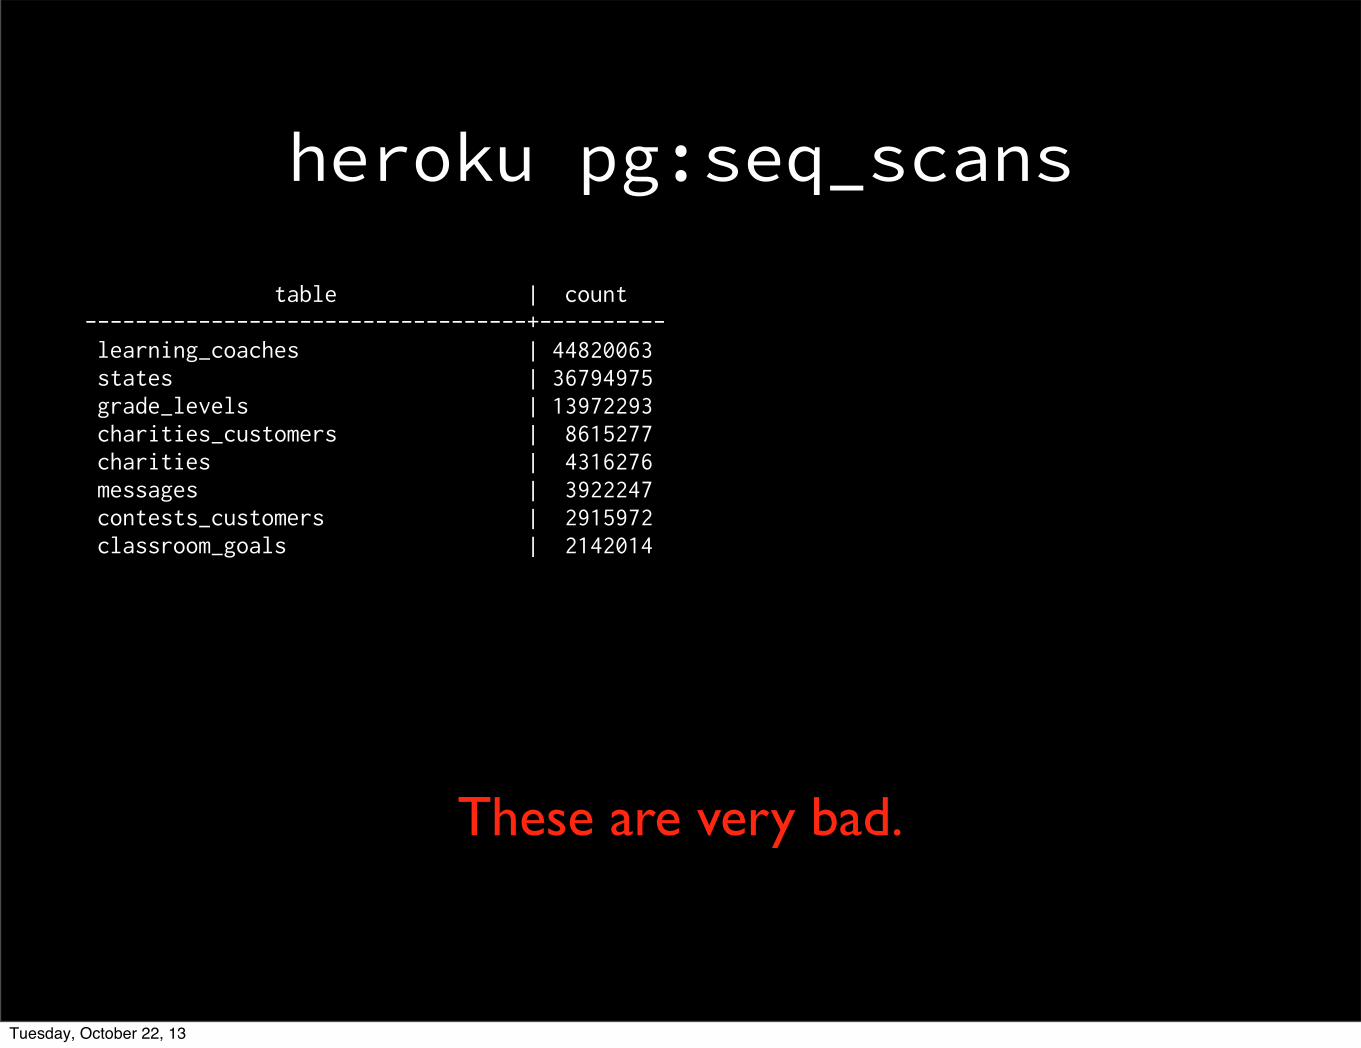
heroku pg:seq_scans
table | count-----------------------------------+---------- learning_coaches | 44820063 states | 36794975 grade_levels | 13972293 charities_customers | 8615277 charities | 4316276 messages | 3922247 contests_customers | 2915972 classroom_goals | 2142014
These are very bad.
Tuesday, October 22, 13
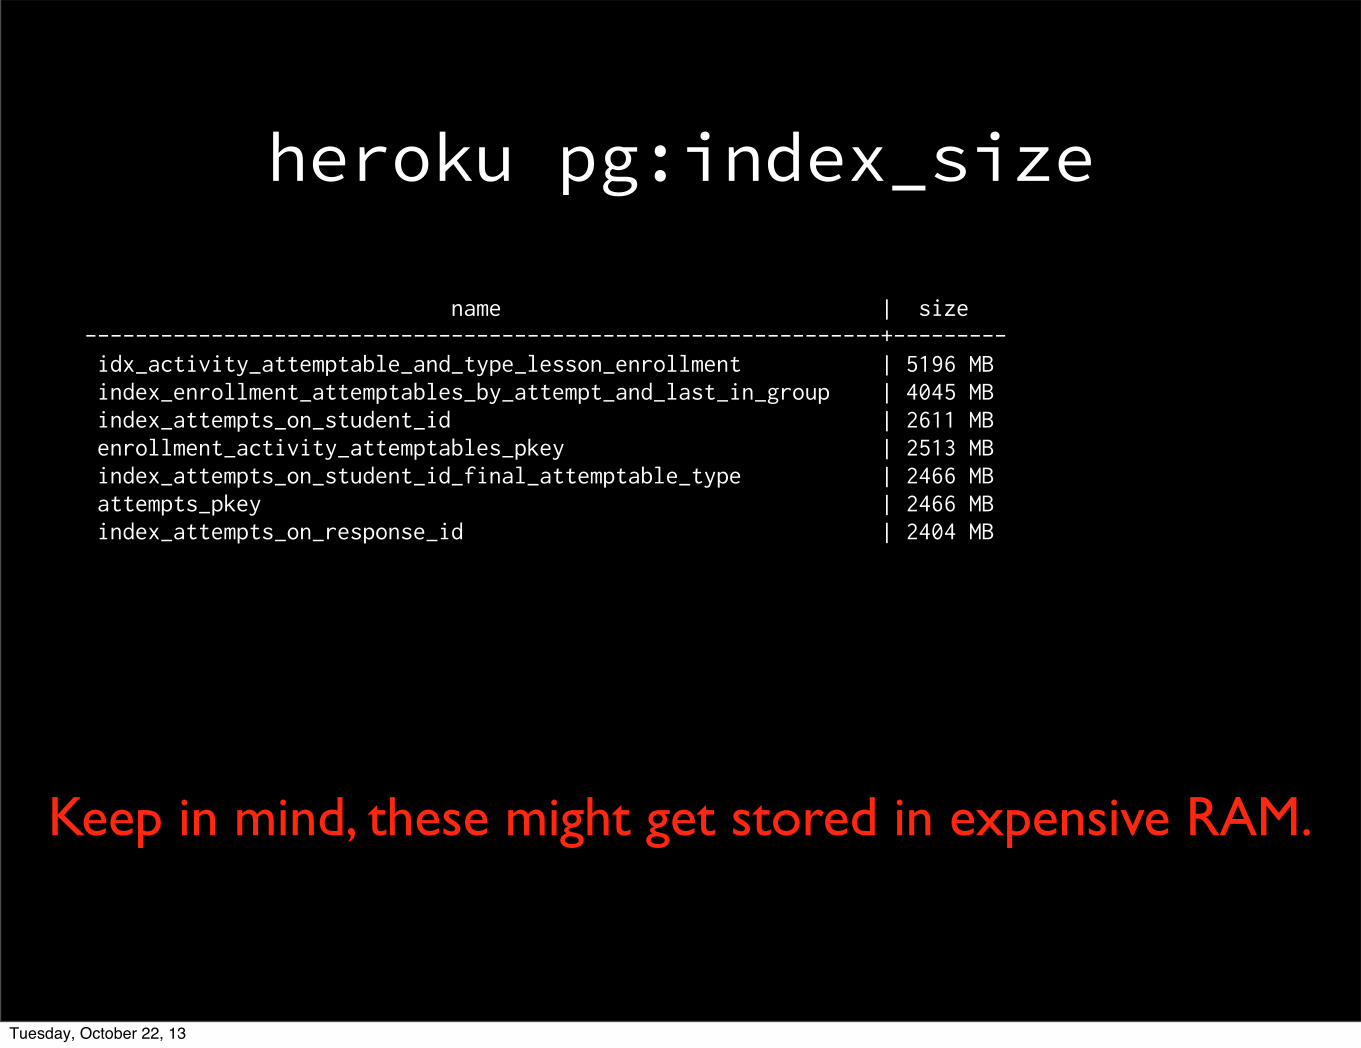
heroku pg:index_size
name | size---------------------------------------------------------------+--------- idx_activity_attemptable_and_type_lesson_enrollment | 5196 MB index_enrollment_attemptables_by_attempt_and_last_in_group | 4045 MB index_attempts_on_student_id | 2611 MB enrollment_activity_attemptables_pkey | 2513 MB index_attempts_on_student_id_final_attemptable_type | 2466 MB attempts_pkey | 2466 MB index_attempts_on_response_id | 2404 MB
Keep in mind, these might get stored in expensive RAM.
Tuesday, October 22, 13