Embed Size (px)
DESCRIPTION
Using MySQL without Maatkit is like taking a photo without removing the camera's lens cap. Professional MySQL experts use this toolkit to help keep complex MySQL installations running smoothly and efficiently. This session will show you practical ways to use Maatkit every day.
Citation preview

Percona Toolkit: MySQL Guru in a Box
Bill Karwin, Percona Inc.

www.percona.com
Me•Software developer, consultant
•SQL maven
•C, Java, Perl, PHP, Ruby
•Consultant/Trainer at Percona
•Author of SQL Antipatterns: Avoiding the Pitfalls of Database Programming
Bill Karwin
www.percona.com
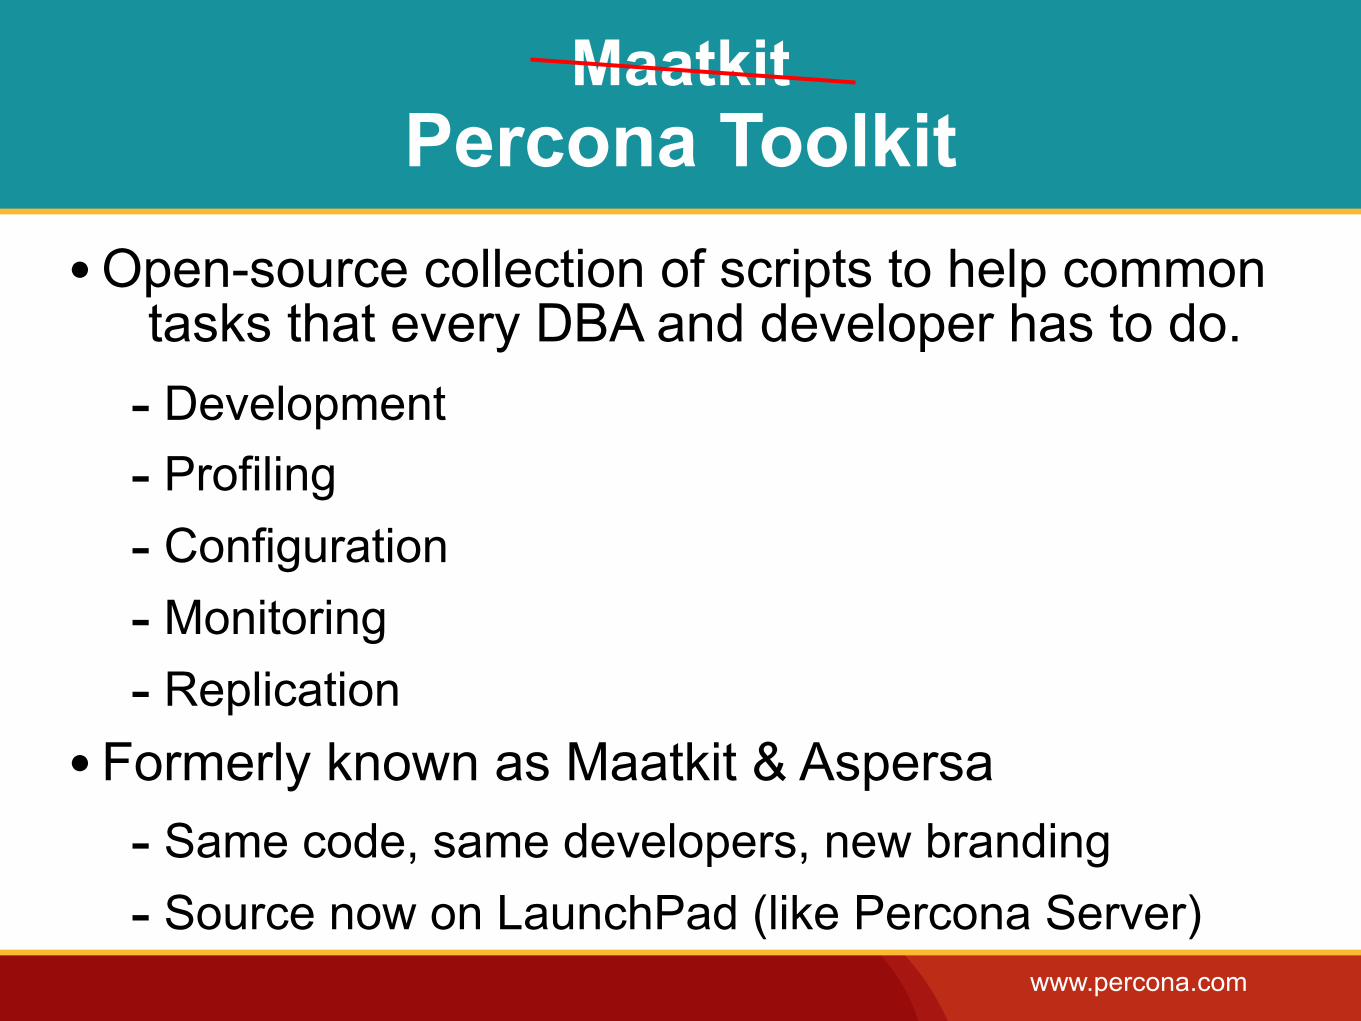
Maatkit Percona Toolkit
•Open-source collection of scripts to help common tasks that every DBA and developer has to do.
- Development- Profiling- Configuration- Monitoring- Replication
• Formerly known as Maatkit & Aspersa- Same code, same developers, new branding- Source now on LaunchPad (like Percona Server)
www.percona.com
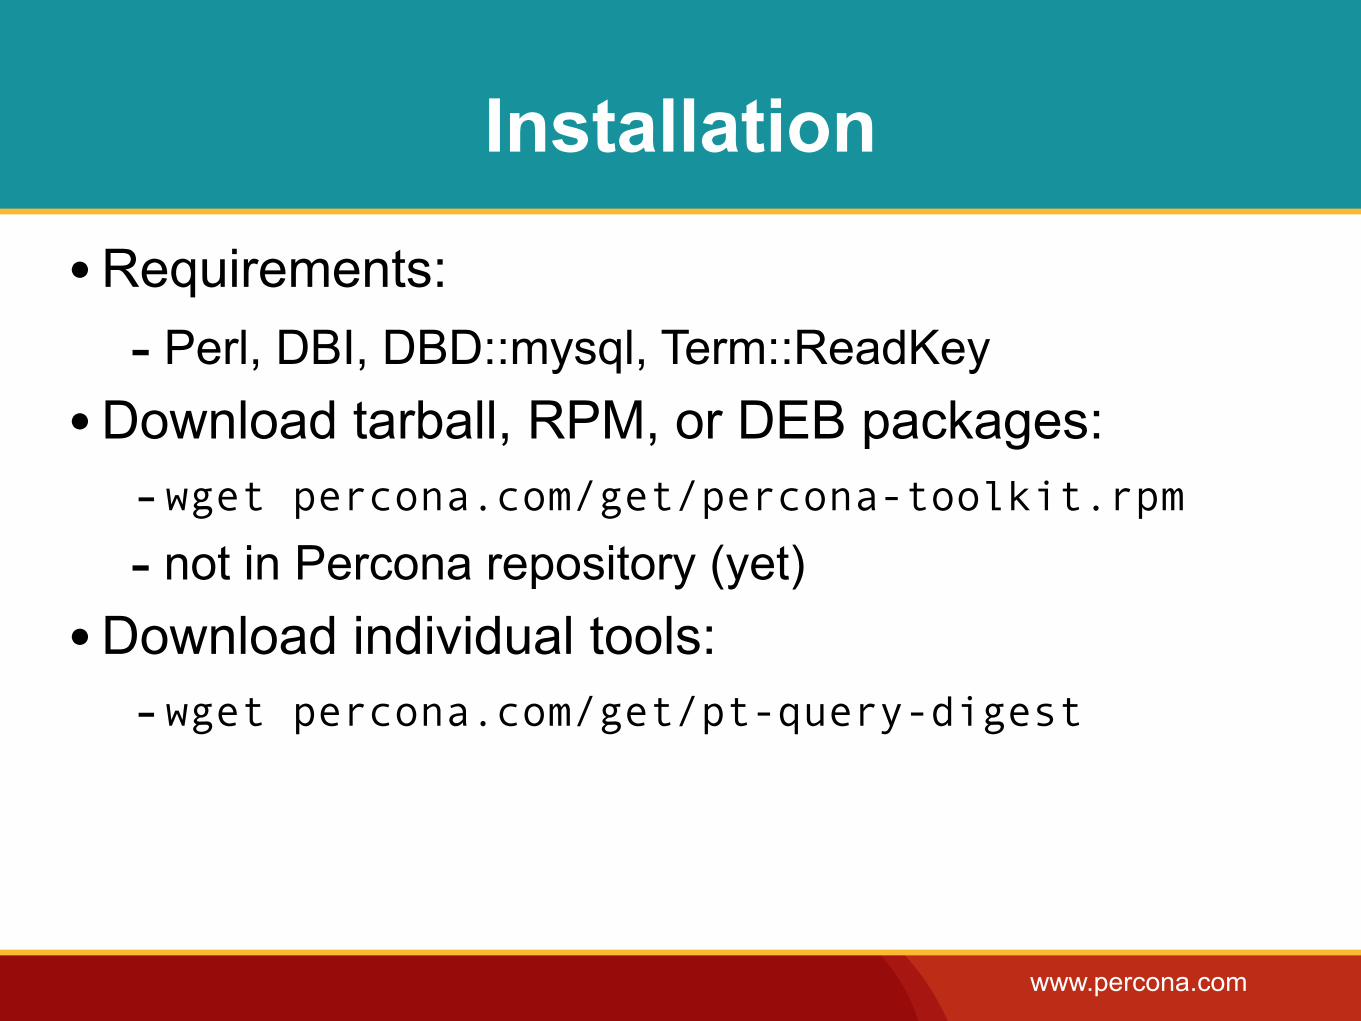
Installation
•Requirements:- Perl, DBI, DBD::mysql, Term::ReadKey
•Download tarball, RPM, or DEB packages:-wget percona.com/get/percona-toolkit.rpm- not in Percona repository (yet)
•Download individual tools:-wget percona.com/get/pt-query-digest
www.percona.com
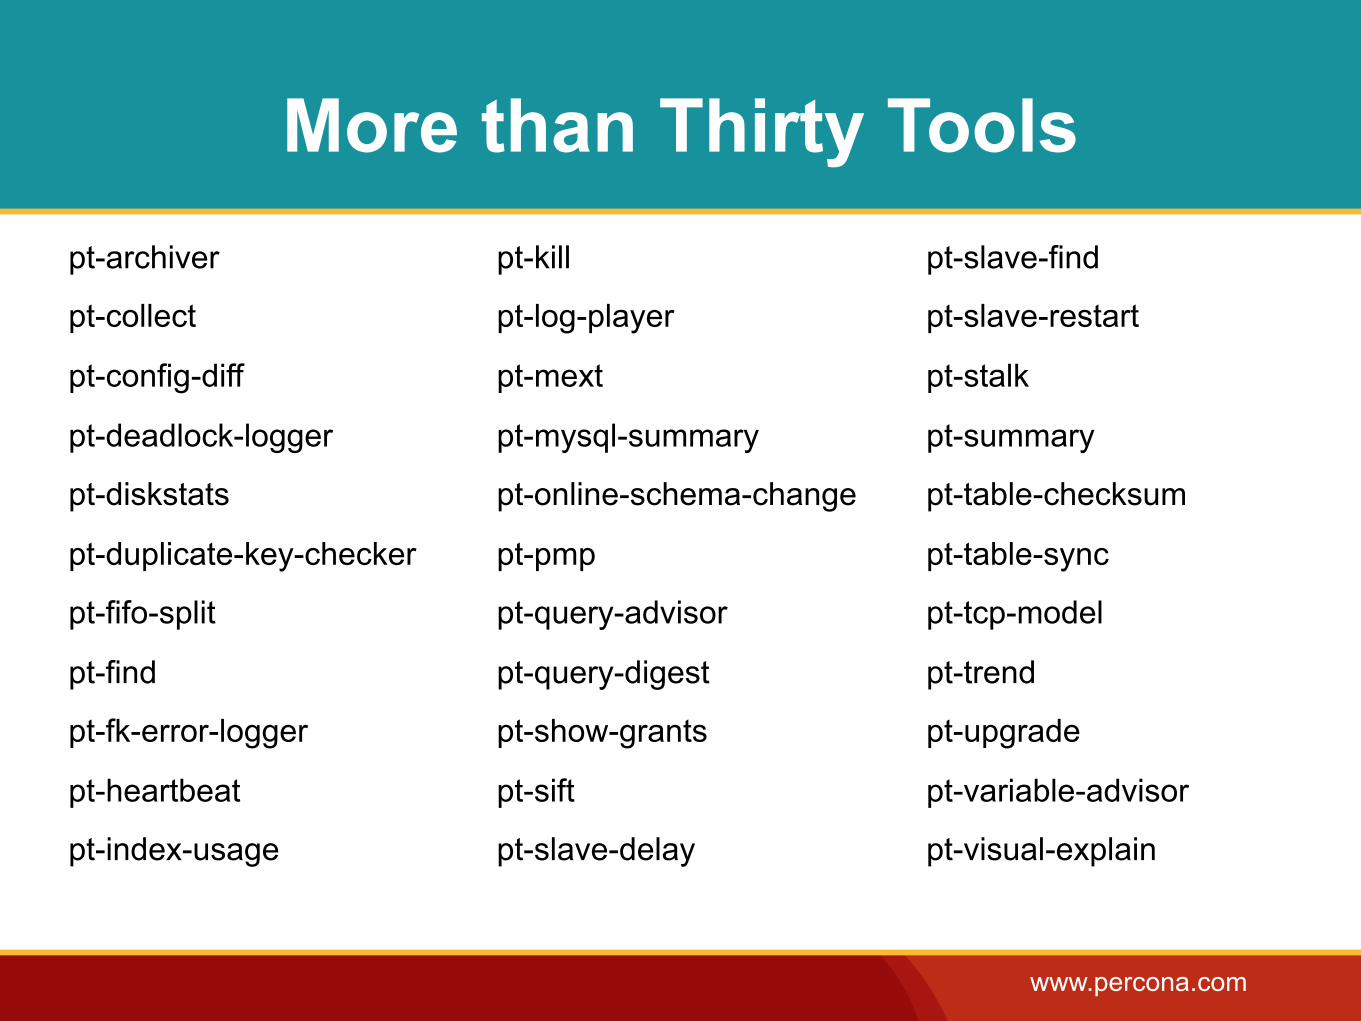
More than Thirty Toolspt-archiver
pt-collect
pt-config-diff
pt-deadlock-logger
pt-diskstats
pt-duplicate-key-checker
pt-fifo-split
pt-find
pt-fk-error-logger
pt-heartbeat
pt-index-usage
pt-kill
pt-log-player
pt-mext
pt-mysql-summary
pt-online-schema-change
pt-pmp
pt-query-advisor
pt-query-digest
pt-show-grants
pt-sift
pt-slave-delay
pt-slave-find
pt-slave-restart
pt-stalk
pt-summary
pt-table-checksum
pt-table-sync
pt-tcp-model
pt-trend
pt-upgrade
pt-variable-advisor
pt-visual-explain
www.percona.com
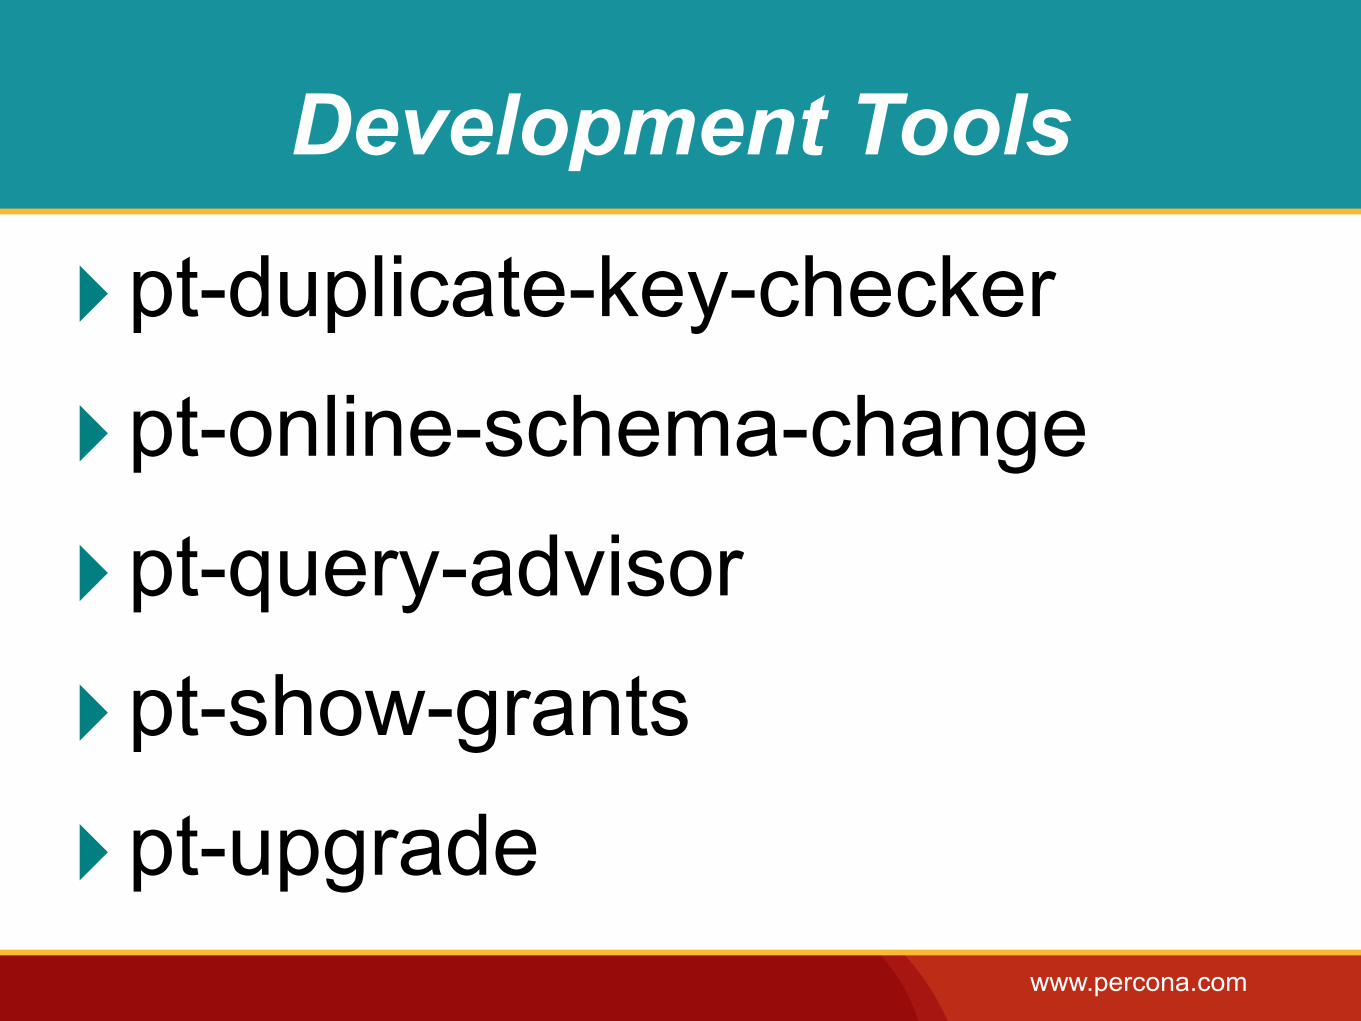
Development Tools
‣pt-duplicate-key-checker
‣pt-online-schema-change
‣pt-query-advisor
‣pt-show-grants
‣pt-upgrade
www.percona.com
pt-duplicate-key-checker
• Find duplicate indexes and foreign keys on MySQL tables.
- MySQL permits you to create redundant keys.- Nearly every database has some.- Output is a series of ALTER TABLE statements
ready to drop or reform duplicate indexes.
www.percona.com
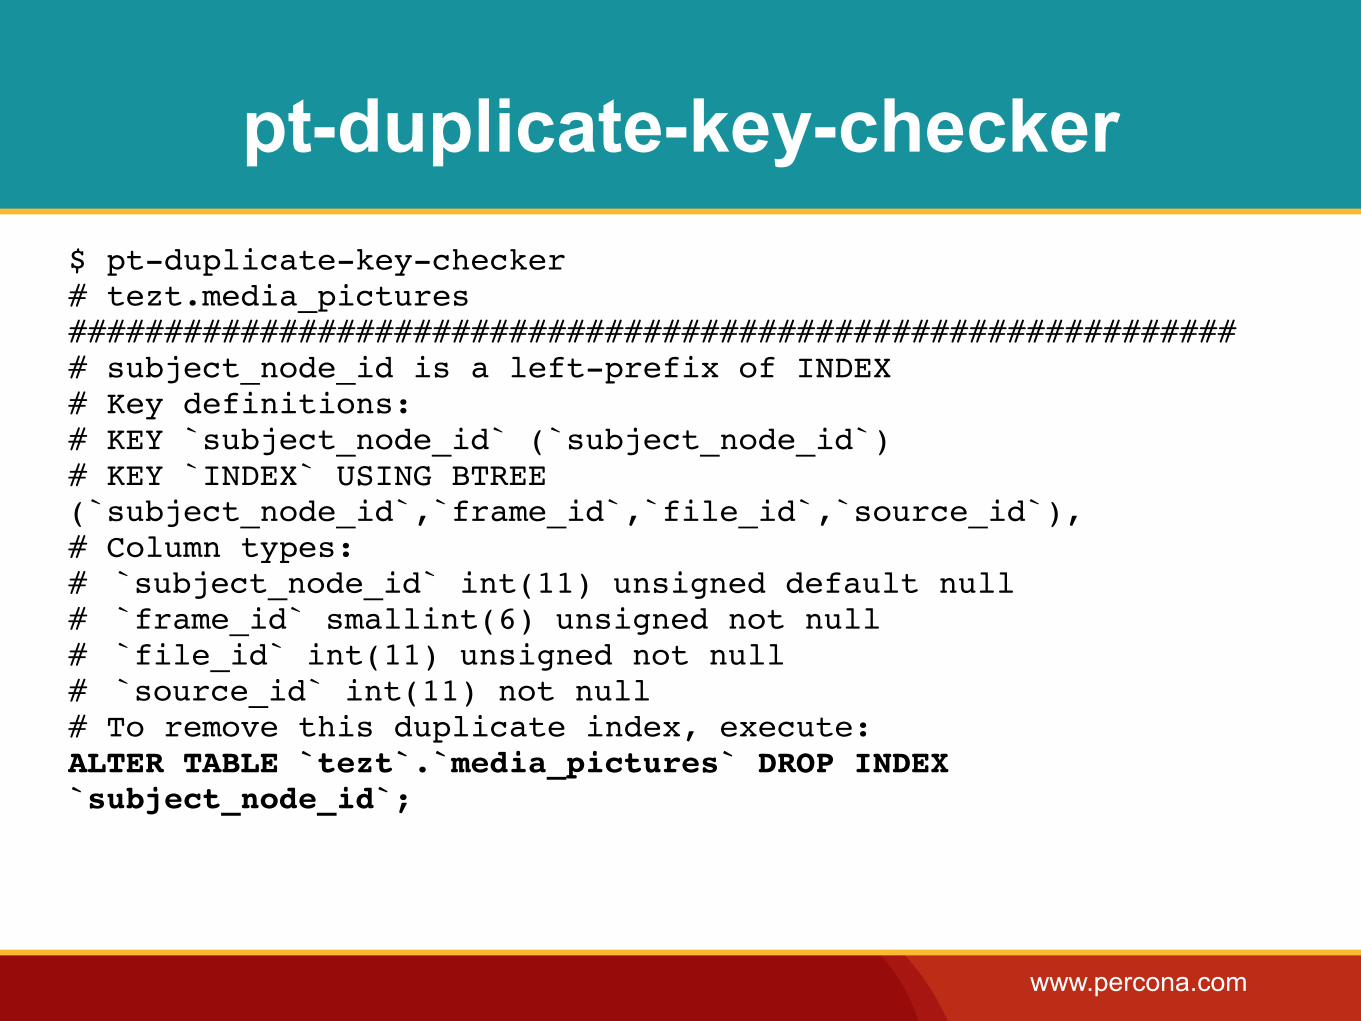
pt-duplicate-key-checker$ pt-duplicate-key-checker# tezt.media_pictures############################################################## subject_node_id is a left-prefix of INDEX# Key definitions:# KEY `subject_node_id` (`subject_node_id`)# KEY `INDEX` USING BTREE(`subject_node_id`,`frame_id`,`file_id`,`source_id`),# Column types:#! `subject_node_id` int(11) unsigned default null#! `frame_id` smallint(6) unsigned not null#! `file_id` int(11) unsigned not null#! `source_id` int(11) not null# To remove this duplicate index, execute:ALTER TABLE `tezt`.`media_pictures` DROP INDEX`subject_node_id`;
www.percona.com
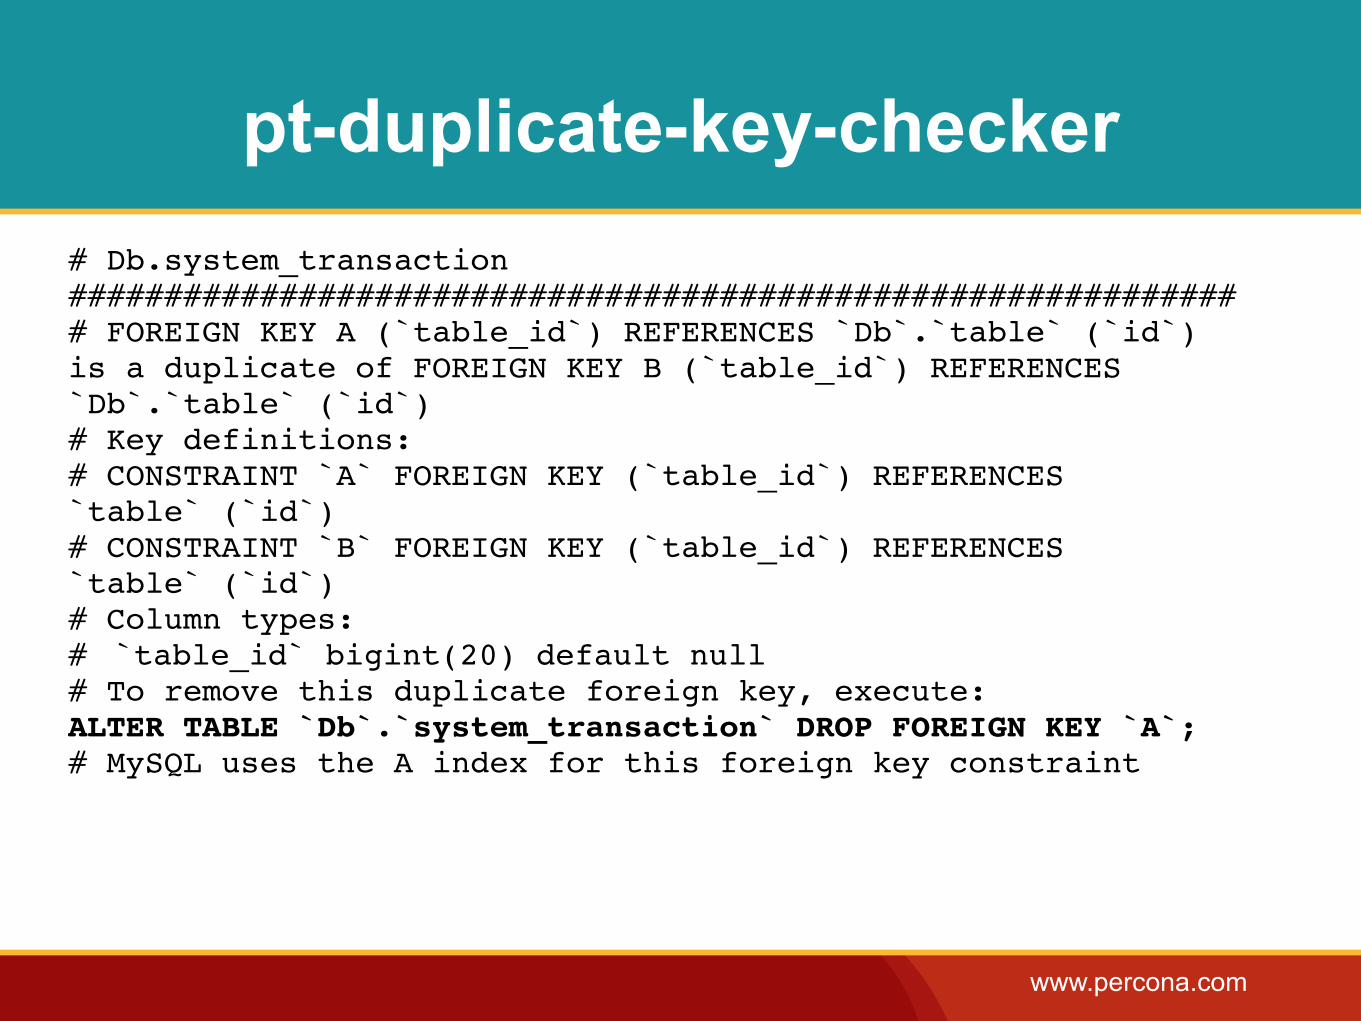
pt-duplicate-key-checker# Db.system_transaction############################################################## FOREIGN KEY A (`table_id`) REFERENCES `Db`.`table` (`id`)is a duplicate of FOREIGN KEY B (`table_id`) REFERENCES`Db`.`table` (`id`)# Key definitions:# CONSTRAINT `A` FOREIGN KEY (`table_id`) REFERENCES`table` (`id`)# CONSTRAINT `B` FOREIGN KEY (`table_id`) REFERENCES`table` (`id`)# Column types:#! `table_id` bigint(20) default null# To remove this duplicate foreign key, execute:ALTER TABLE `Db`.`system_transaction` DROP FOREIGN KEY `A`;# MySQL uses the A index for this foreign key constraint
www.percona.com
pt-online-schema-change
•Perform online, non-blocking table schema changes.
- Captures concurrent updates to a table while restructuring a table.
- Some risks and caveats exist; please read the manual and test carefully.
www.percona.com
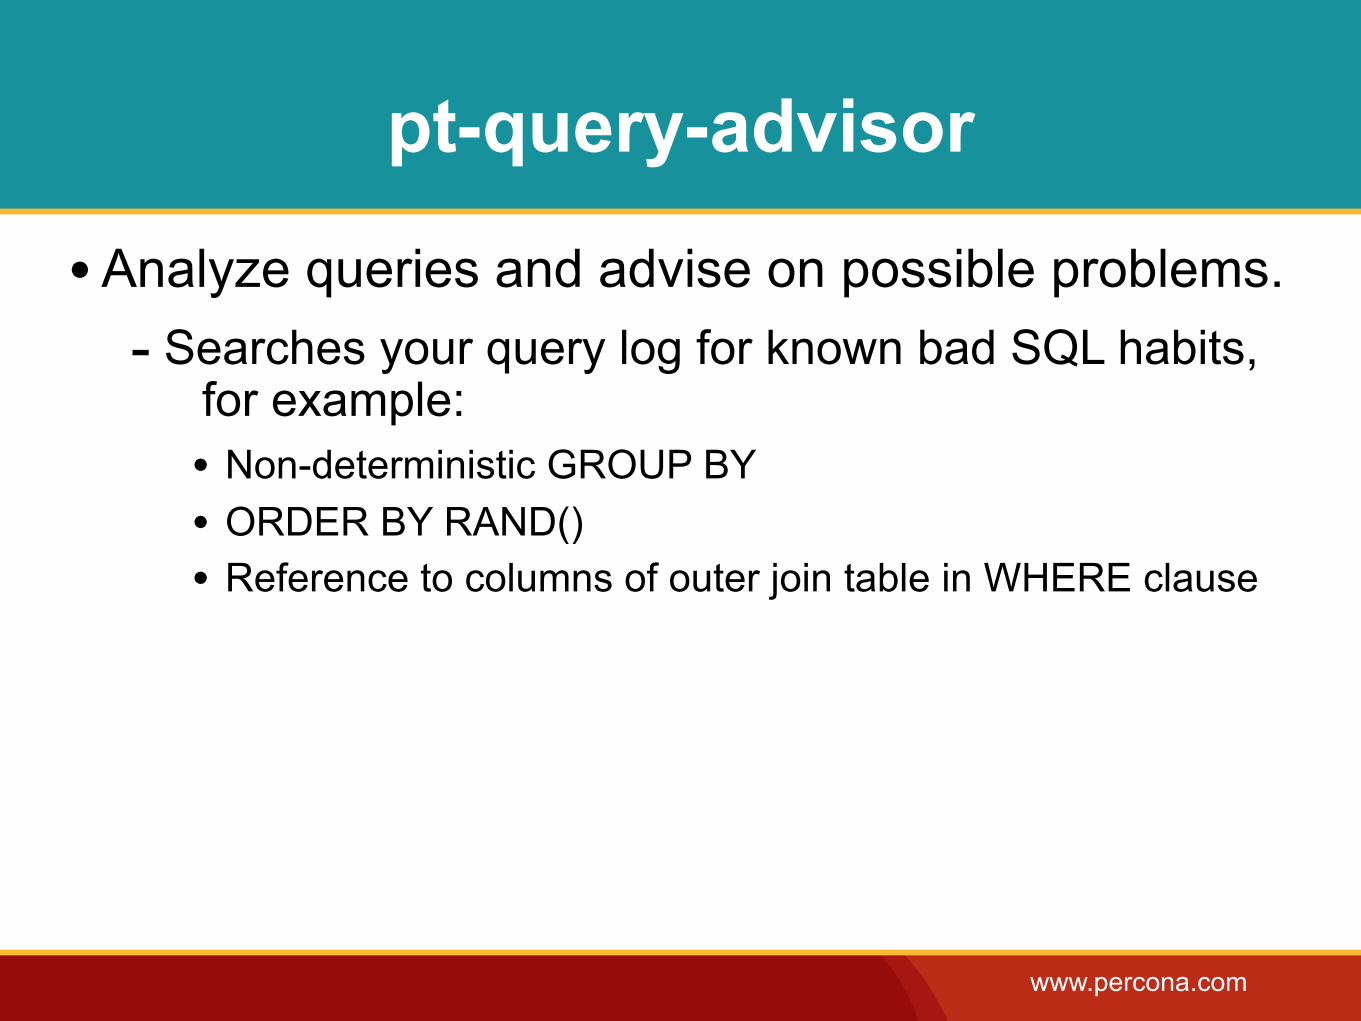
pt-query-advisor
•Analyze queries and advise on possible problems.- Searches your query log for known bad SQL habits,
for example:• Non-deterministic GROUP BY• ORDER BY RAND()• Reference to columns of outer join table in WHERE clause
www.percona.com
pt-show-grants
•Canonicalize and print MySQL grants so you can effectively replicate, compare and version-control them.
www.percona.com
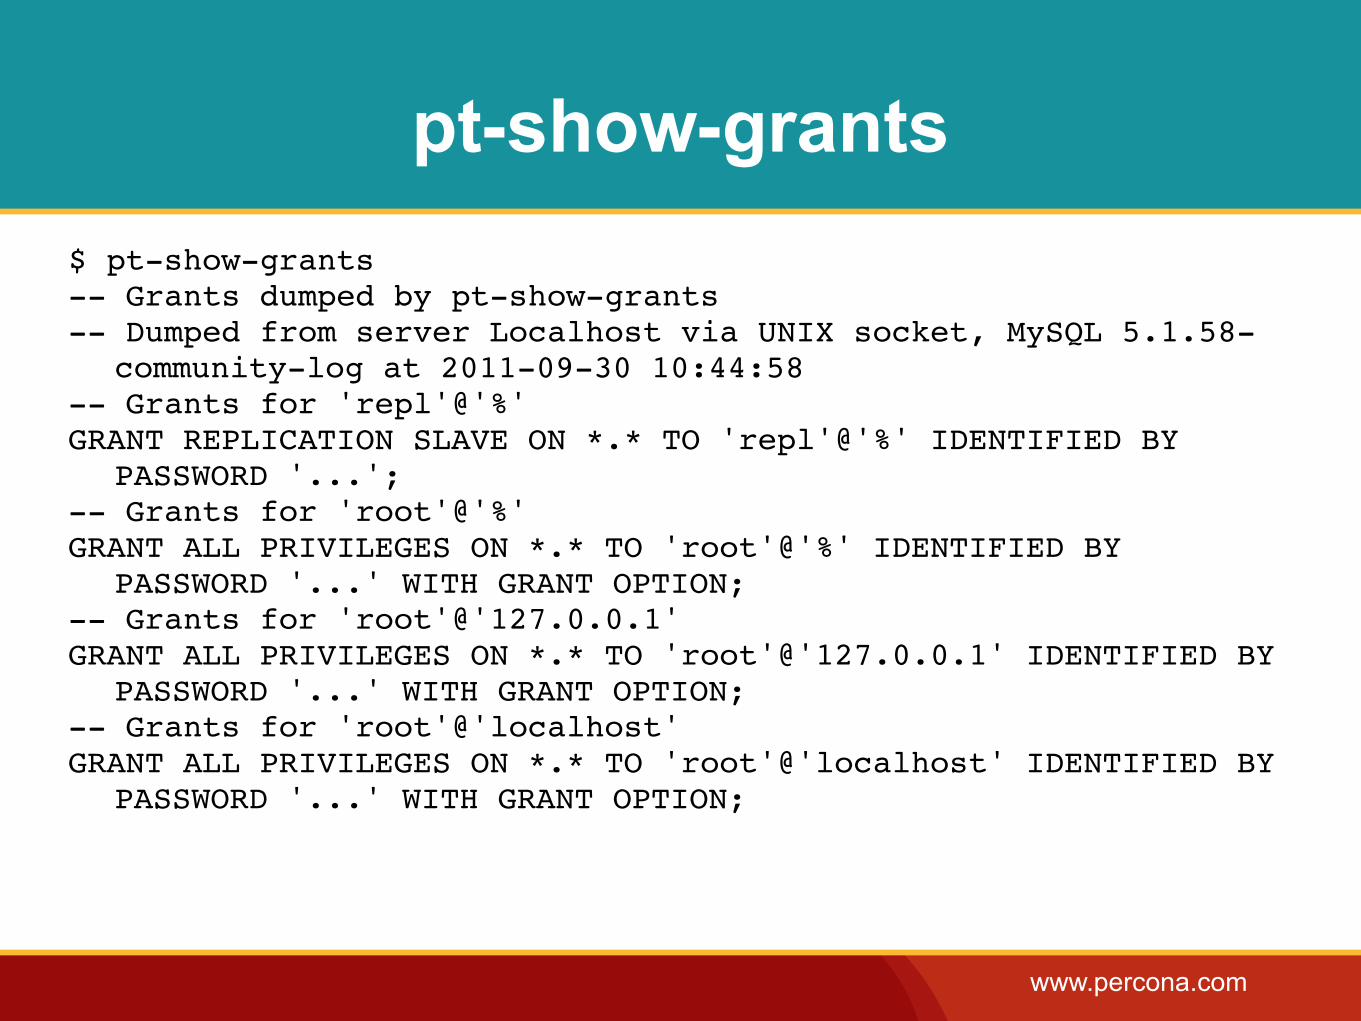
pt-show-grants$ pt-show-grants -- Grants dumped by pt-show-grants-- Dumped from server Localhost via UNIX socket, MySQL 5.1.58-
community-log at 2011-09-30 10:44:58-- Grants for 'repl'@'%'GRANT REPLICATION SLAVE ON *.* TO 'repl'@'%' IDENTIFIED BY
PASSWORD '...';-- Grants for 'root'@'%'GRANT ALL PRIVILEGES ON *.* TO 'root'@'%' IDENTIFIED BY
PASSWORD '...' WITH GRANT OPTION;-- Grants for 'root'@'127.0.0.1'GRANT ALL PRIVILEGES ON *.* TO 'root'@'127.0.0.1' IDENTIFIED BY
PASSWORD '...' WITH GRANT OPTION;-- Grants for 'root'@'localhost'GRANT ALL PRIVILEGES ON *.* TO 'root'@'localhost' IDENTIFIED BY
PASSWORD '...' WITH GRANT OPTION;
www.percona.com
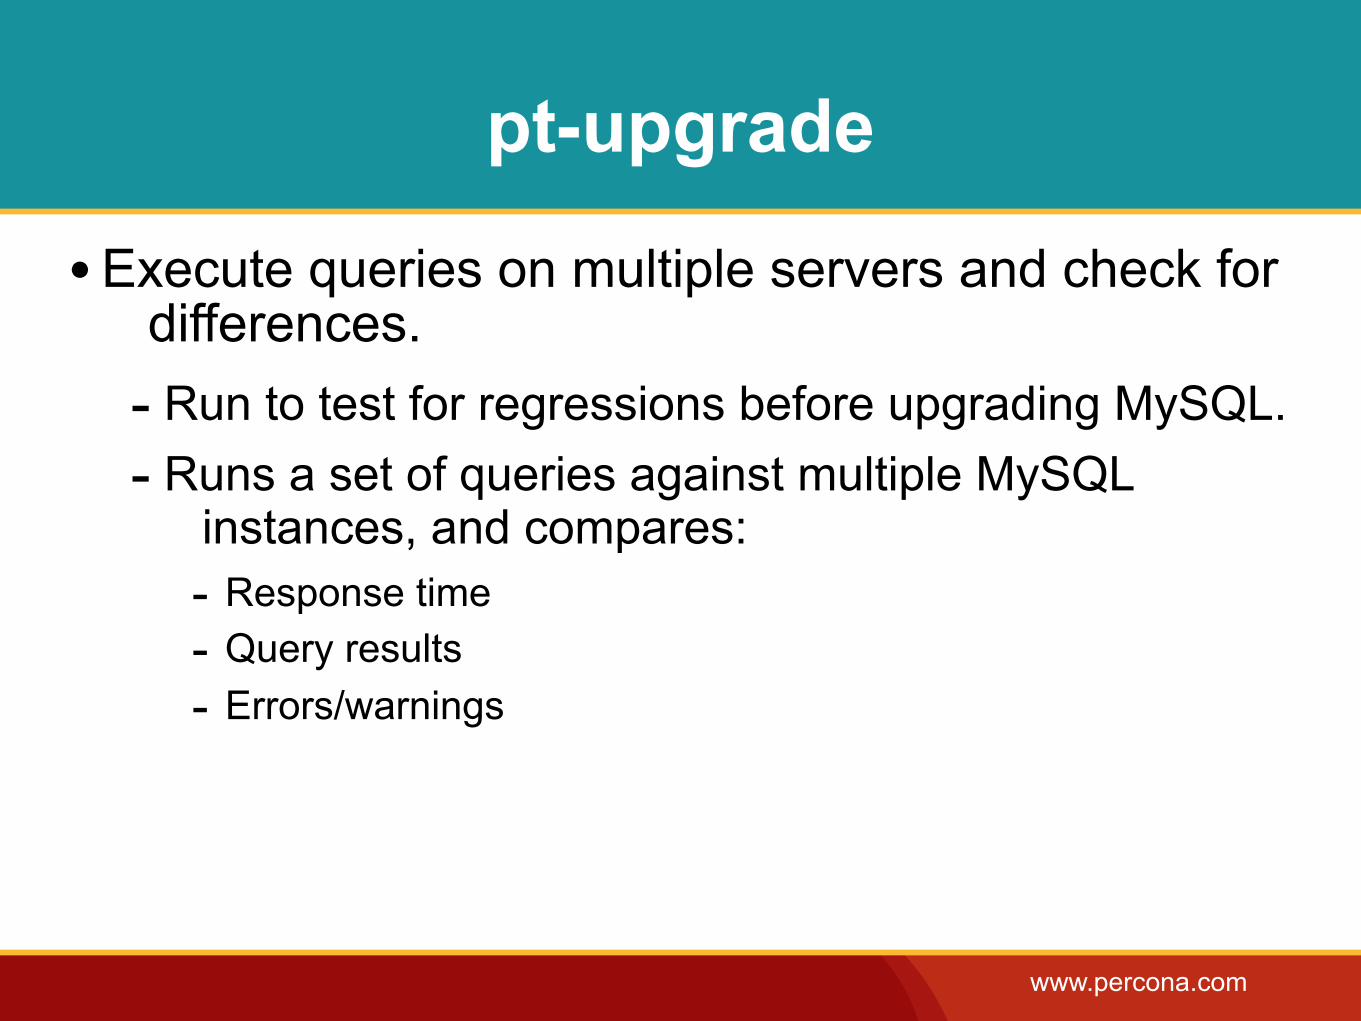
pt-upgrade
•Execute queries on multiple servers and check for differences.
- Run to test for regressions before upgrading MySQL.- Runs a set of queries against multiple MySQL
instances, and compares:- Response time- Query results- Errors/warnings
www.percona.com
Profiling Tools
‣pt-index-usage
‣pt-pmp
‣pt-visual-explain
www.percona.com
pt-index-usage
•Read queries from a log and analyze how they use indexes.
- Takes inventory of tables and indexes.- Reads query log.- Uses EXPLAIN to analyze index usage of queries.- Reports indexes not used, so you can drop them.
www.percona.com
pt-pmp
•Aggregate GDB stack traces for a selected program.
- Inspired by poormansprofiler.org

www.percona.com
pt-visual-explain
• Format EXPLAIN output as a tree.- Easier to show it than to describe it...

www.percona.com
pt-visual-explain
mysql> explain select * from -> sakila.film_actor join sakila.film -> using(film_id);+----+-------------+------------+------+----------------
+----------------+---------+---------------------+------+-------+
| id | select_type | table | type | possible_keys | key | key_len | ref | rows | Extra |
+----+-------------+------------+------+----------------+----------------+---------+---------------------+------+-------+
| 1 | SIMPLE | film | ALL | PRIMARY | NULL | NULL | NULL | 1007 | |
| 1 | SIMPLE | film_actor | ref | idx_fk_film_id | idx_fk_film_id | 2 | sakila.film.film_id | 2 | |
+----+-------------+------------+------+----------------+----------------+---------+---------------------+------+-------+
Before

www.percona.com
pt-visual-explain
JOIN+- Bookmark lookup| +- Table| | table film_actor| | possible_keys idx_fk_film_id| +- Index lookup| key film_actor->idx_fk_film_id| possible_keys idx_fk_film_id| key_len 2| ref sakila.film.film_id| rows 2+- Table scan rows 1007 +- Table table film possible_keys PRIMARY
After
www.percona.com
MySQL Configuration Tools
‣pt-config-diff
‣pt-mysql-summary
‣pt-variable-advisor
www.percona.com
pt-config-diff
•Diff MySQL configuration files and server variables.
www.percona.com
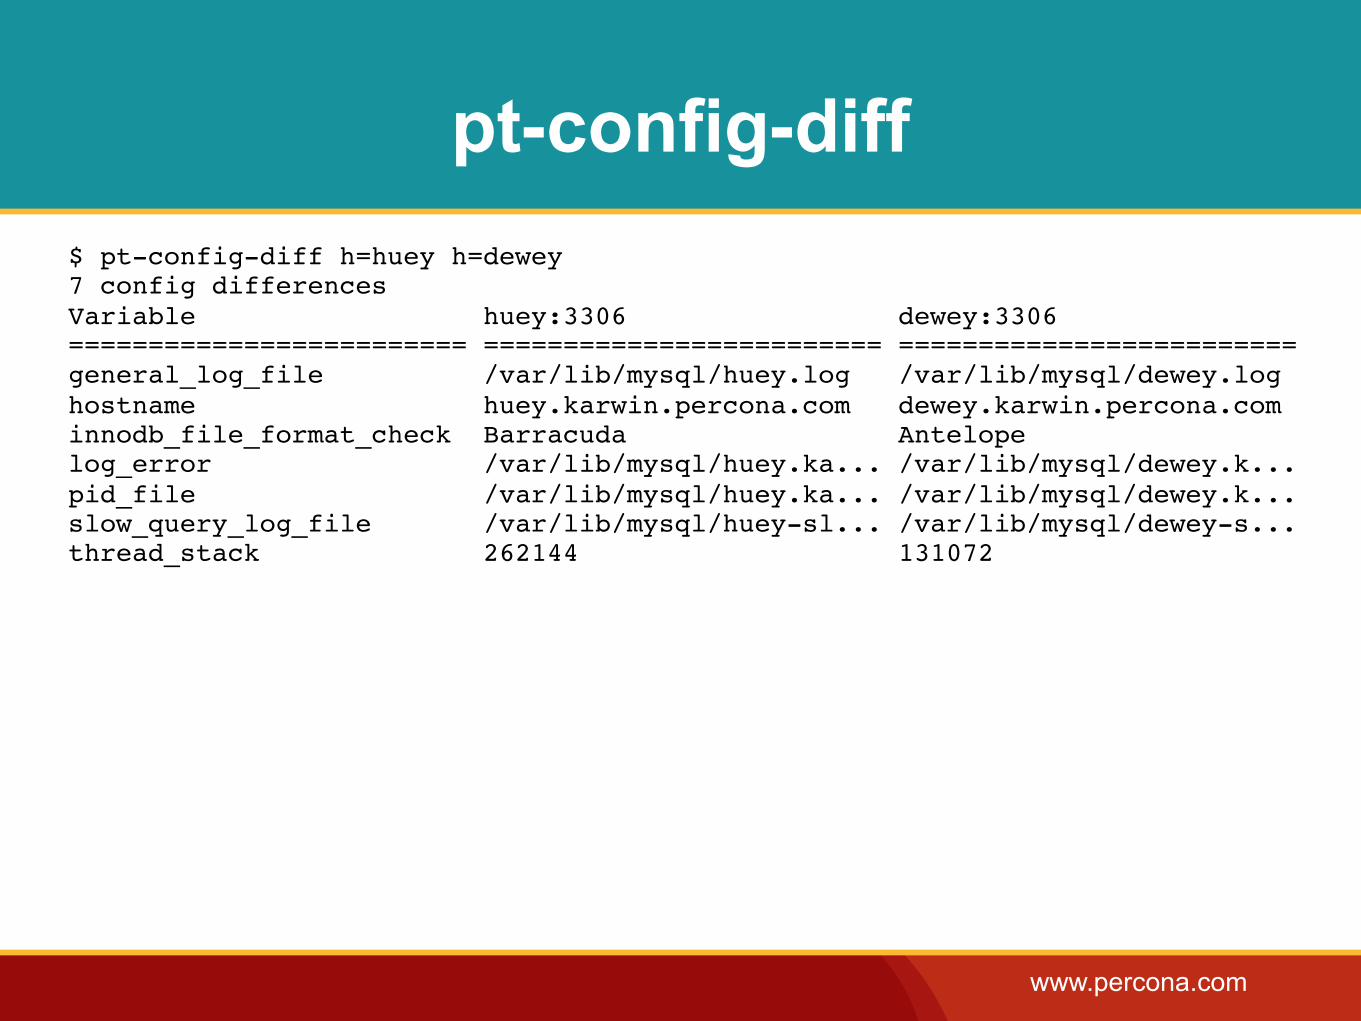
pt-config-diff$ pt-config-diff h=huey h=dewey7 config differencesVariable huey:3306 dewey:3306========================= ========================= =========================general_log_file /var/lib/mysql/huey.log /var/lib/mysql/dewey.loghostname huey.karwin.percona.com dewey.karwin.percona.cominnodb_file_format_check Barracuda Antelopelog_error /var/lib/mysql/huey.ka... /var/lib/mysql/dewey.k...pid_file /var/lib/mysql/huey.ka... /var/lib/mysql/dewey.k...slow_query_log_file /var/lib/mysql/huey-sl... /var/lib/mysql/dewey-s...thread_stack 262144 131072
www.percona.com
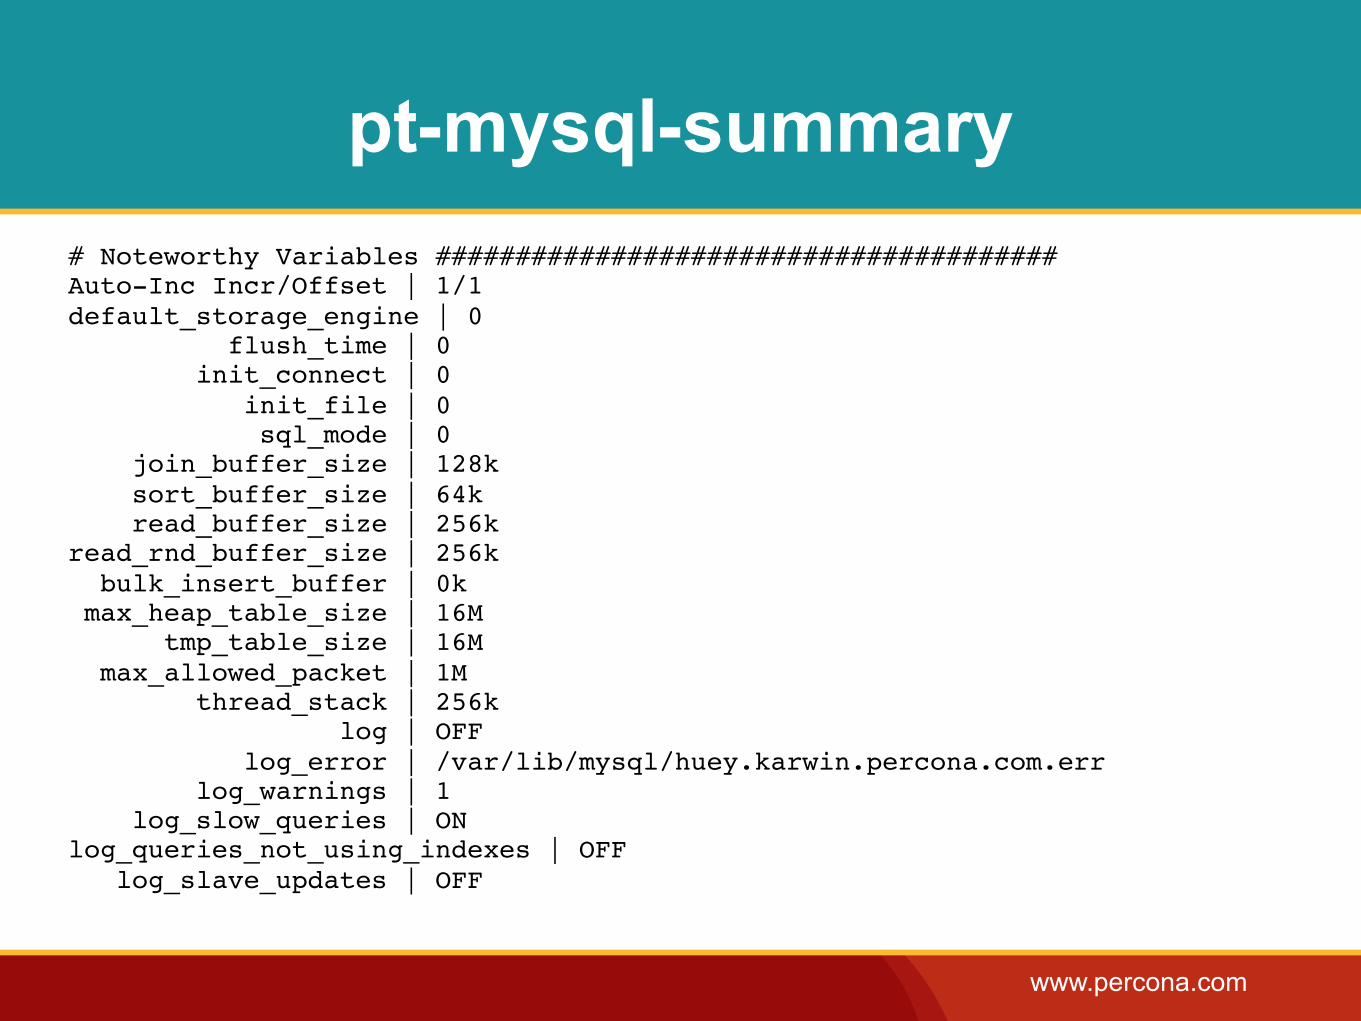
pt-mysql-summary
•Summarize MySQL information in a nice way.- See current status at a glance.- Uses live information from running instance, because
it could be different from my.cnf.- Organizes information in a consistent order, so you
know where to find it.
www.percona.com
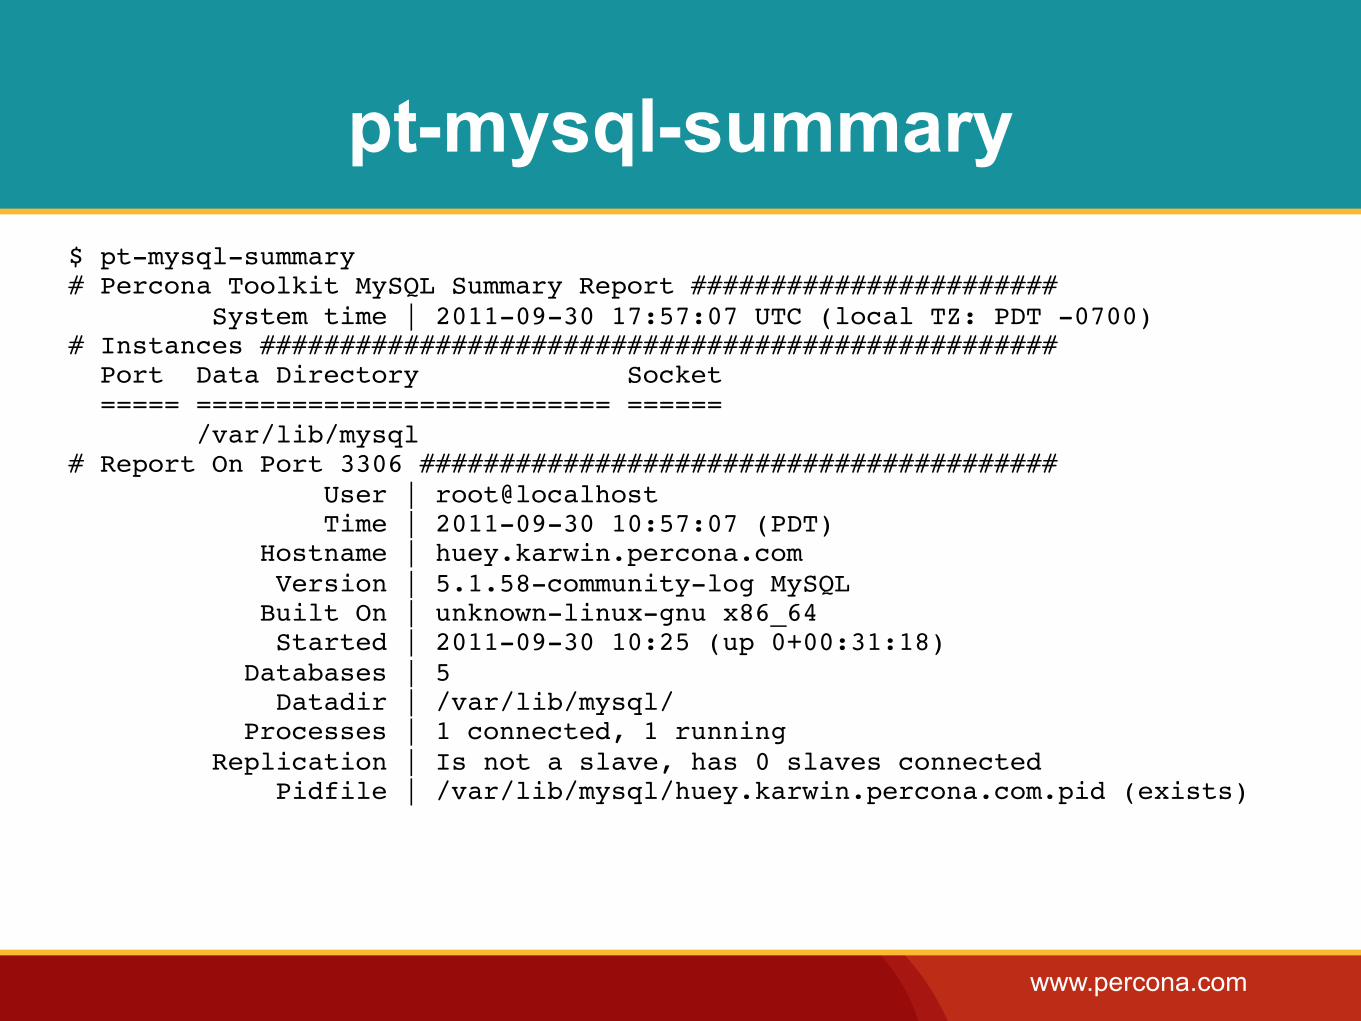
pt-mysql-summary$ pt-mysql-summary# Percona Toolkit MySQL Summary Report ####################### System time | 2011-09-30 17:57:07 UTC (local TZ: PDT -0700)# Instances ################################################## Port Data Directory Socket ===== ========================== ====== /var/lib/mysql # Report On Port 3306 ######################################## User | root@localhost Time | 2011-09-30 10:57:07 (PDT) Hostname | huey.karwin.percona.com Version | 5.1.58-community-log MySQL Built On | unknown-linux-gnu x86_64 Started | 2011-09-30 10:25 (up 0+00:31:18) Databases | 5 Datadir | /var/lib/mysql/ Processes | 1 connected, 1 running Replication | Is not a slave, has 0 slaves connected Pidfile | /var/lib/mysql/huey.karwin.percona.com.pid (exists)
www.percona.com
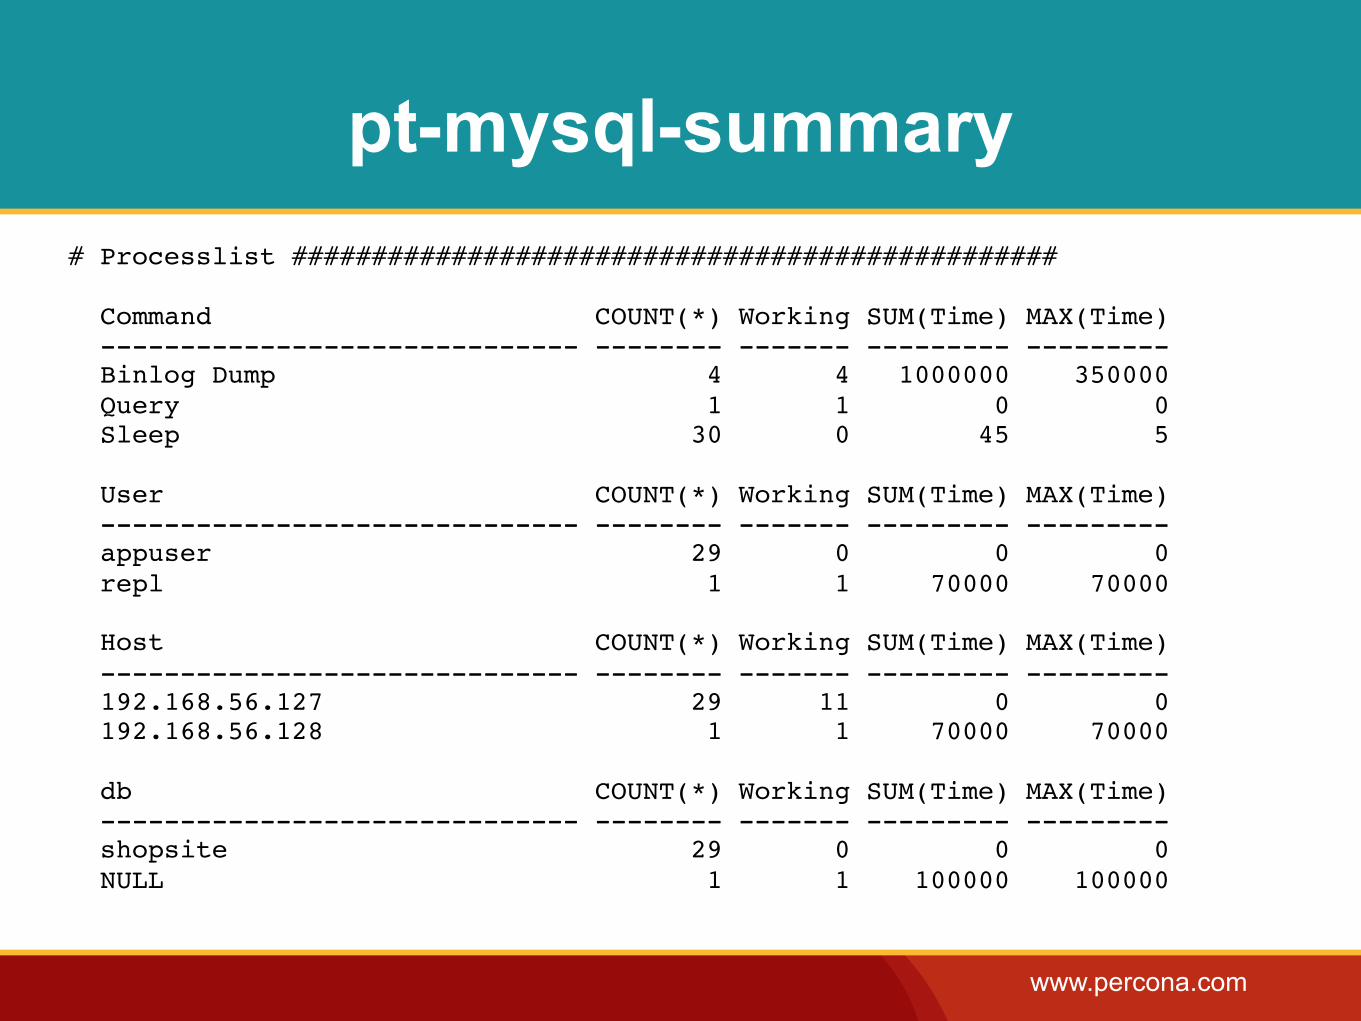
pt-mysql-summary# Processlist ################################################
Command COUNT(*) Working SUM(Time) MAX(Time) ------------------------------ -------- ------- --------- --------- Binlog Dump 4 4 1000000 350000 Query 1 1 0 0 Sleep 30 0 45 5
User COUNT(*) Working SUM(Time) MAX(Time) ------------------------------ -------- ------- --------- --------- appuser 29 0 0 0 repl 1 1 70000 70000 Host COUNT(*) Working SUM(Time) MAX(Time) ------------------------------ -------- ------- --------- --------- 192.168.56.127 29 11 0 0 192.168.56.128 1 1 70000 70000 db COUNT(*) Working SUM(Time) MAX(Time) ------------------------------ -------- ------- --------- --------- shopsite 29 0 0 0 NULL 1 1 100000 100000
www.percona.com
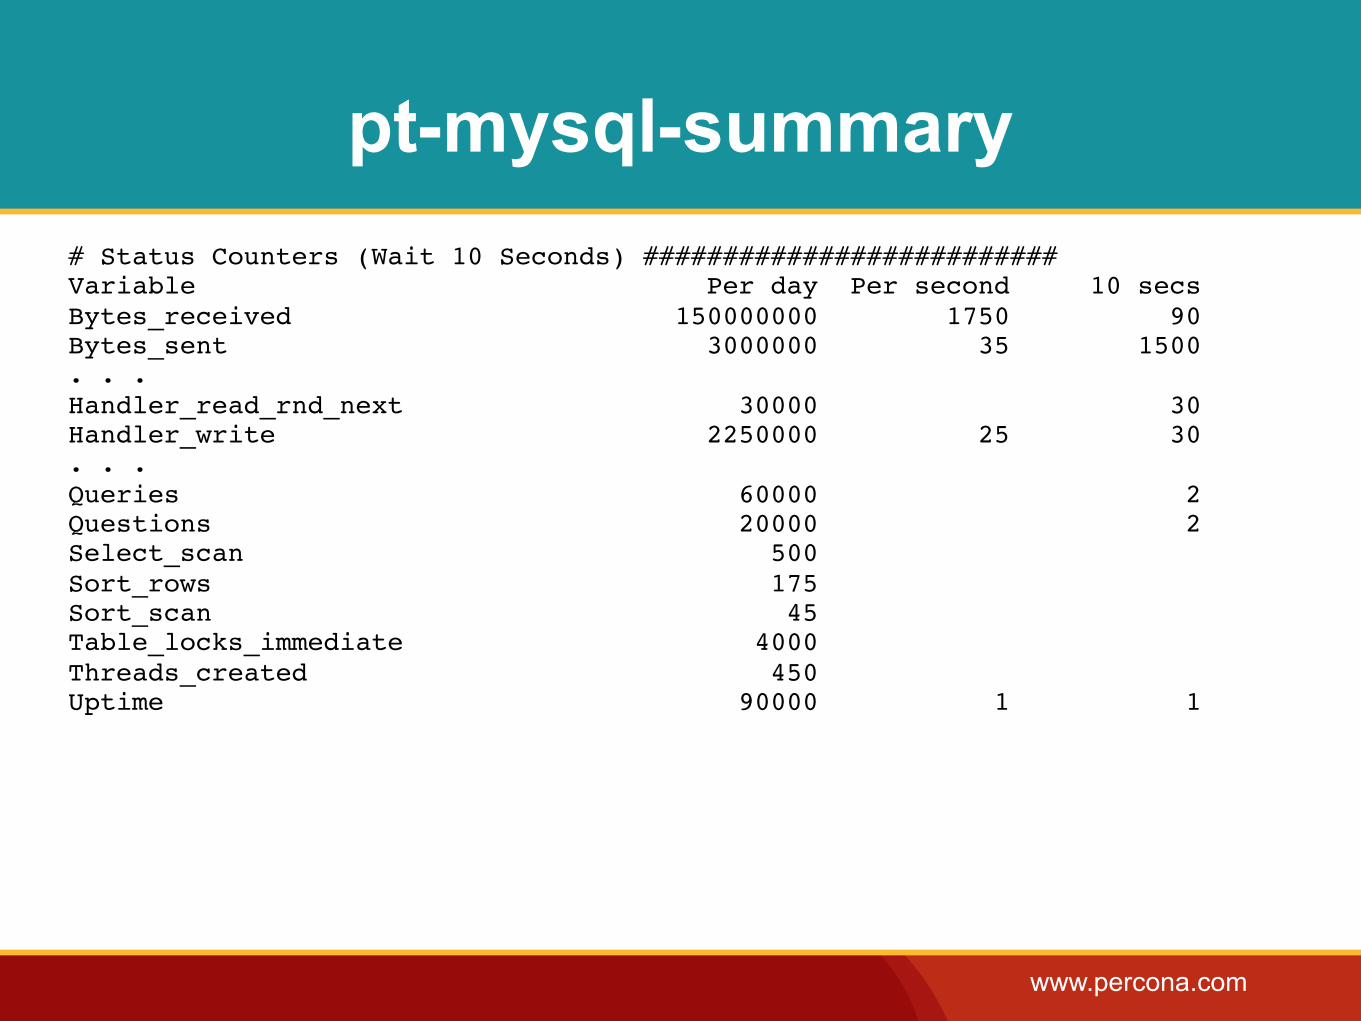
pt-mysql-summary# Status Counters (Wait 10 Seconds) ##########################Variable Per day Per second 10 secsBytes_received 150000000 1750 90Bytes_sent 3000000 35 1500. . .Handler_read_rnd_next 30000 30Handler_write 2250000 25 30. . . Queries 60000 2Questions 20000 2Select_scan 500 Sort_rows 175 Sort_scan 45 Table_locks_immediate 4000 Threads_created 450 Uptime 90000 1 1
www.percona.com
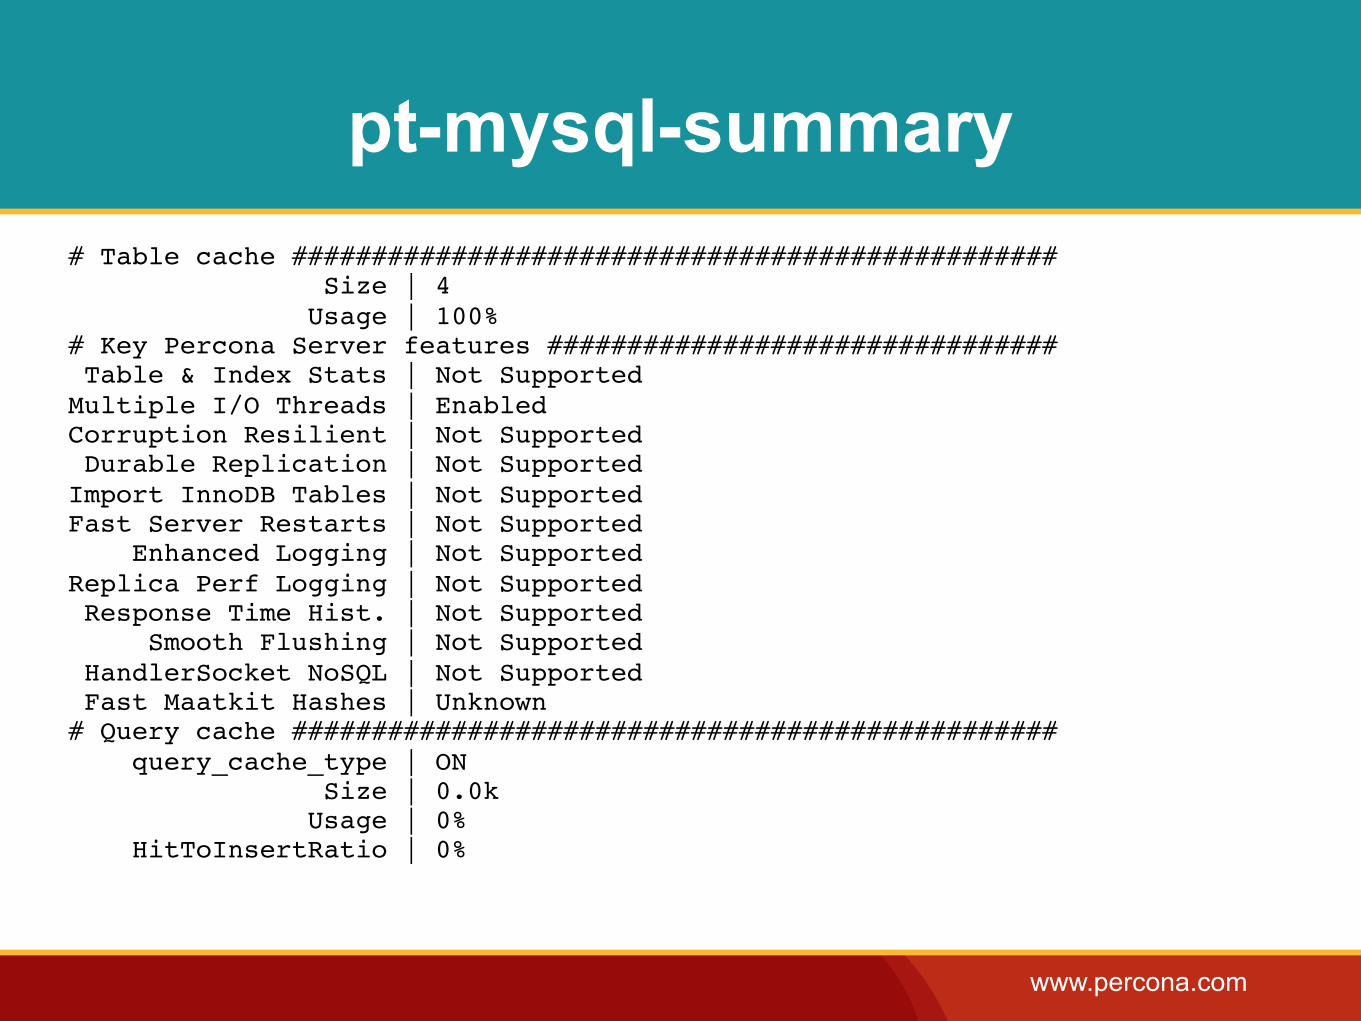
pt-mysql-summary# Table cache ################################################ Size | 4 Usage | 100%# Key Percona Server features ################################ Table & Index Stats | Not SupportedMultiple I/O Threads | EnabledCorruption Resilient | Not Supported Durable Replication | Not SupportedImport InnoDB Tables | Not SupportedFast Server Restarts | Not Supported Enhanced Logging | Not SupportedReplica Perf Logging | Not Supported Response Time Hist. | Not Supported Smooth Flushing | Not Supported HandlerSocket NoSQL | Not Supported Fast Maatkit Hashes | Unknown# Query cache ################################################ query_cache_type | ON Size | 0.0k Usage | 0% HitToInsertRatio | 0%
www.percona.com
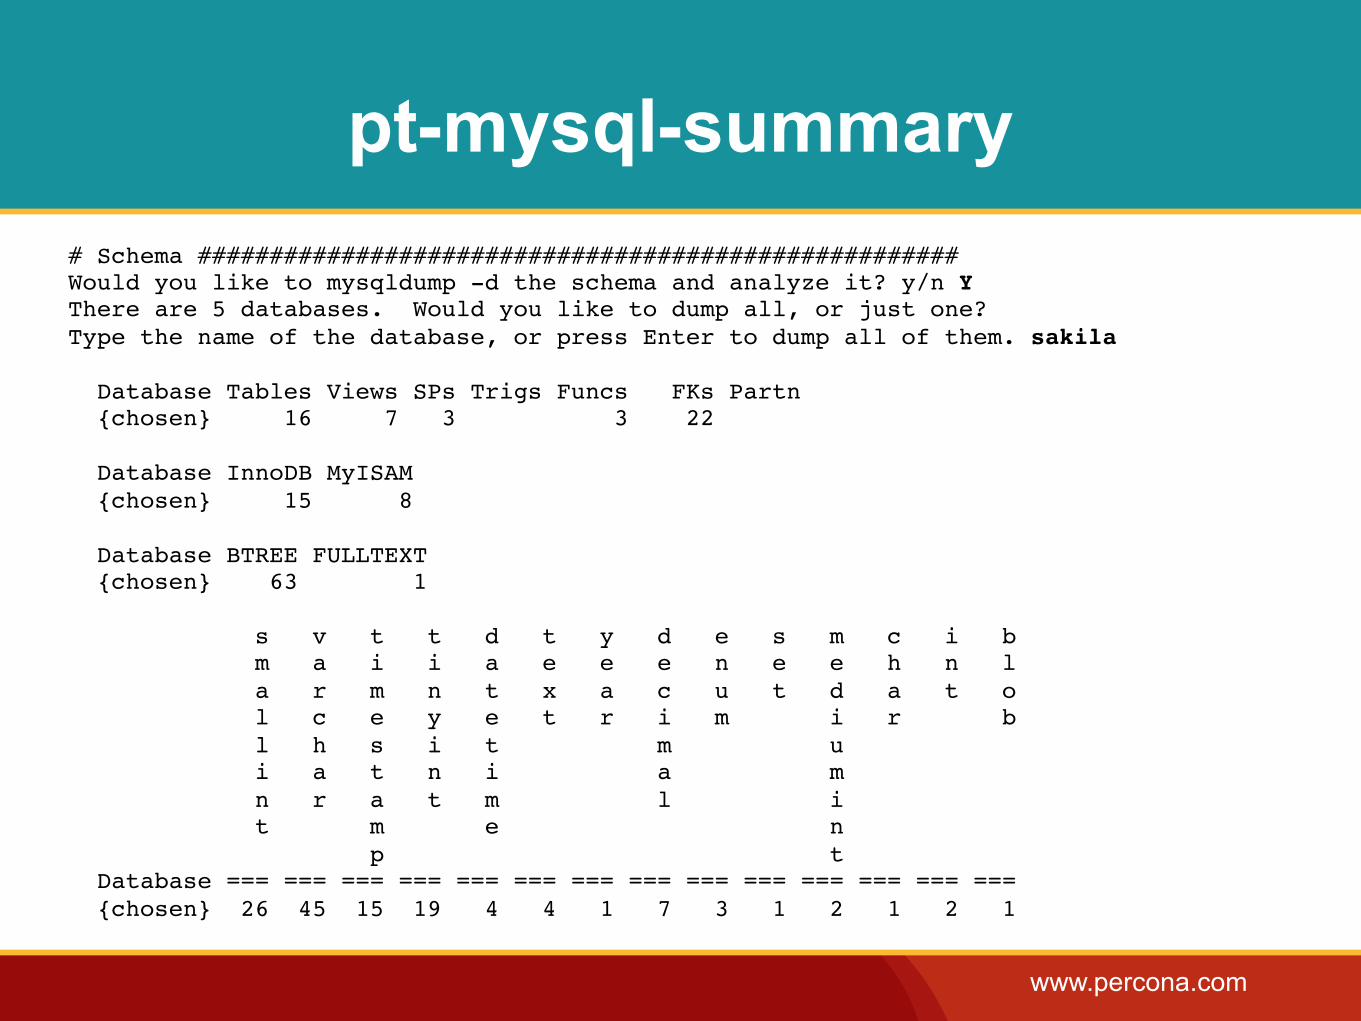
pt-mysql-summary# Schema #####################################################Would you like to mysqldump -d the schema and analyze it? y/n YThere are 5 databases. Would you like to dump all, or just one?Type the name of the database, or press Enter to dump all of them. sakila
Database Tables Views SPs Trigs Funcs FKs Partn {chosen} 16 7 3 3 22
Database InnoDB MyISAM {chosen} 15 8
Database BTREE FULLTEXT {chosen} 63 1
s v t t d t y d e s m c i b m a i i a e e e n e e h n l a r m n t x a c u t d a t o l c e y e t r i m i r b l h s i t m u i a t n i a m n r a t m l i t m e n p t Database === === === === === === === === === === === === === === {chosen} 26 45 15 19 4 4 1 7 3 1 2 1 2 1
www.percona.com
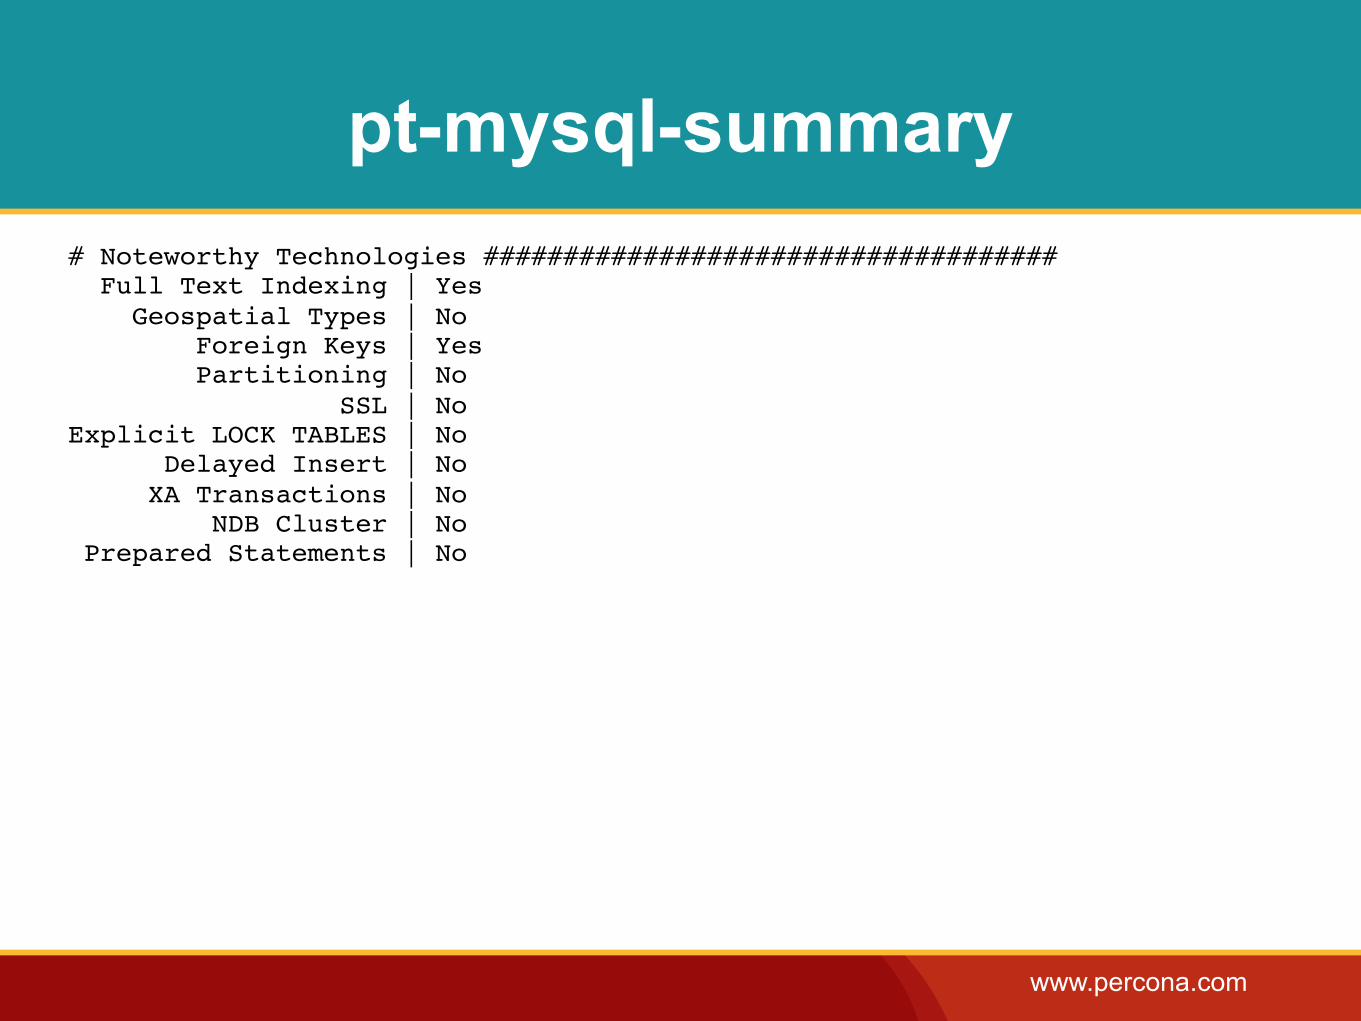
pt-mysql-summary# Noteworthy Technologies #################################### Full Text Indexing | Yes Geospatial Types | No Foreign Keys | Yes Partitioning | No SSL | NoExplicit LOCK TABLES | No Delayed Insert | No XA Transactions | No NDB Cluster | No Prepared Statements | No
www.percona.com
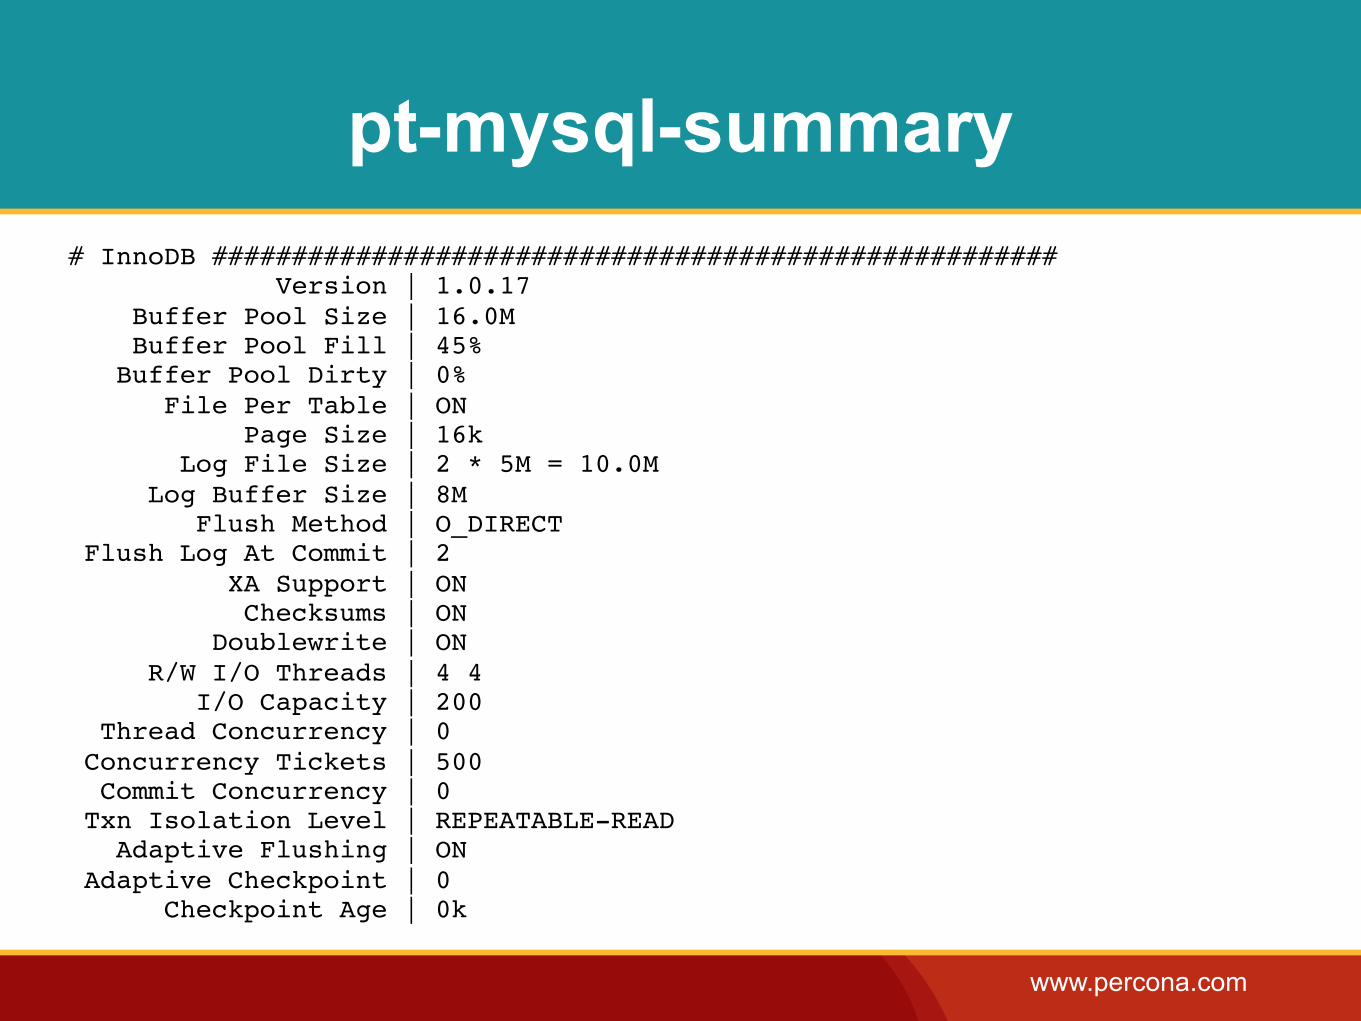
pt-mysql-summary# InnoDB ##################################################### Version | 1.0.17 Buffer Pool Size | 16.0M Buffer Pool Fill | 45% Buffer Pool Dirty | 0% File Per Table | ON Page Size | 16k Log File Size | 2 * 5M = 10.0M Log Buffer Size | 8M Flush Method | O_DIRECT Flush Log At Commit | 2 XA Support | ON Checksums | ON Doublewrite | ON R/W I/O Threads | 4 4 I/O Capacity | 200 Thread Concurrency | 0 Concurrency Tickets | 500 Commit Concurrency | 0 Txn Isolation Level | REPEATABLE-READ Adaptive Flushing | ON Adaptive Checkpoint | 0 Checkpoint Age | 0k
www.percona.com
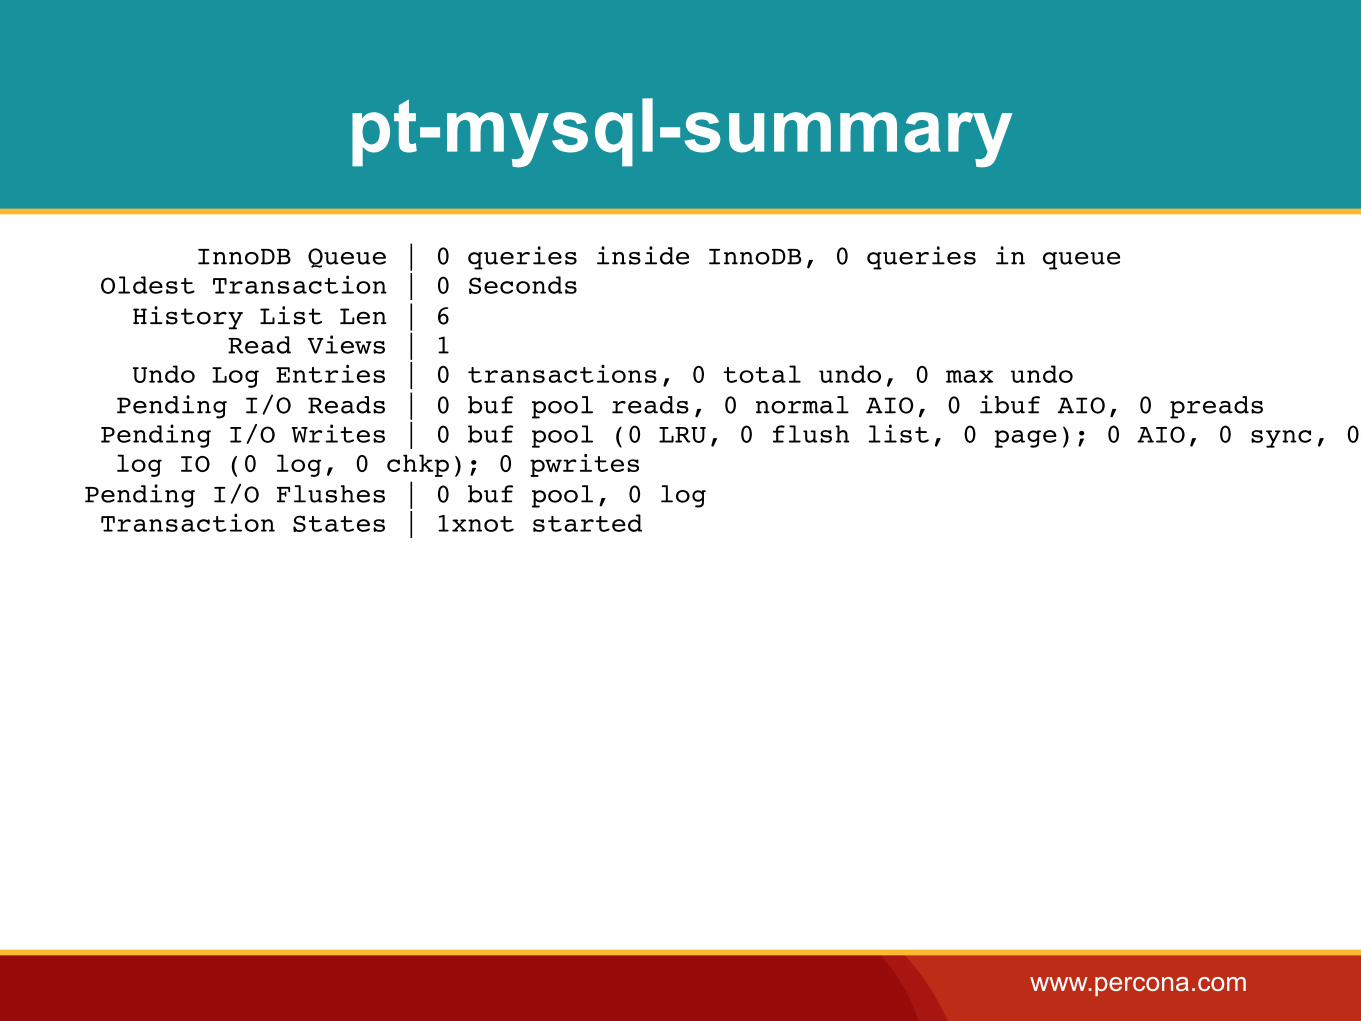
pt-mysql-summary InnoDB Queue | 0 queries inside InnoDB, 0 queries in queue Oldest Transaction | 0 Seconds History List Len | 6 Read Views | 1 Undo Log Entries | 0 transactions, 0 total undo, 0 max undo Pending I/O Reads | 0 buf pool reads, 0 normal AIO, 0 ibuf AIO, 0 preads Pending I/O Writes | 0 buf pool (0 LRU, 0 flush list, 0 page); 0 AIO, 0 sync, 0
log IO (0 log, 0 chkp); 0 pwrites Pending I/O Flushes | 0 buf pool, 0 log Transaction States | 1xnot started
www.percona.com
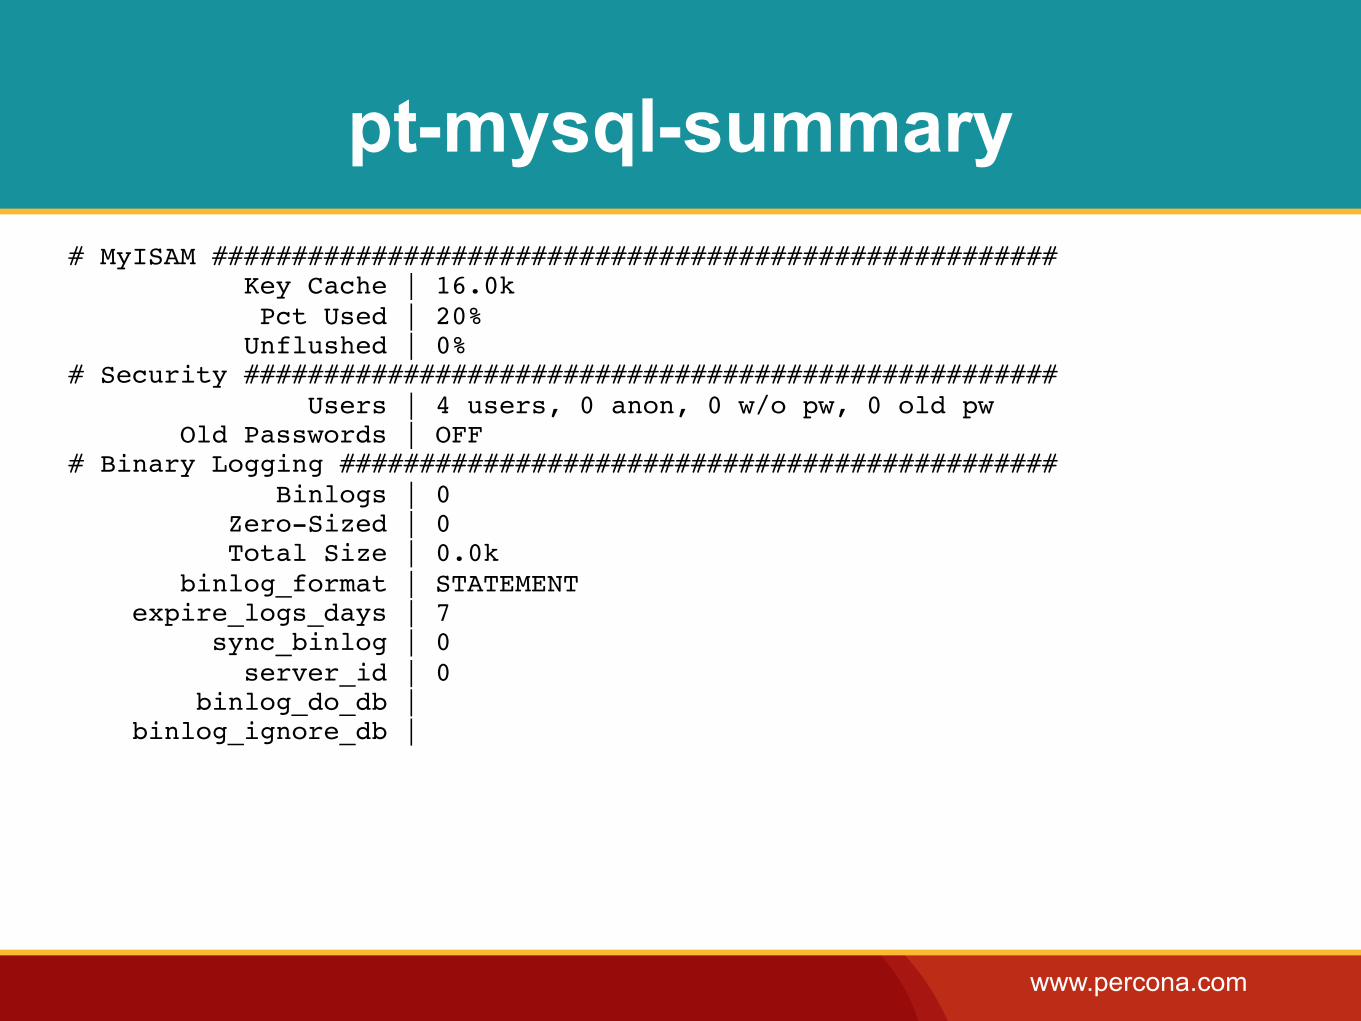
pt-mysql-summary# MyISAM ##################################################### Key Cache | 16.0k Pct Used | 20% Unflushed | 0%# Security ################################################### Users | 4 users, 0 anon, 0 w/o pw, 0 old pw Old Passwords | OFF# Binary Logging ############################################# Binlogs | 0 Zero-Sized | 0 Total Size | 0.0k binlog_format | STATEMENT expire_logs_days | 7 sync_binlog | 0 server_id | 0 binlog_do_db | binlog_ignore_db |
www.percona.com
pt-mysql-summary# Noteworthy Variables #######################################Auto-Inc Incr/Offset | 1/1default_storage_engine | 0 flush_time | 0 init_connect | 0 init_file | 0 sql_mode | 0 join_buffer_size | 128k sort_buffer_size | 64k read_buffer_size | 256kread_rnd_buffer_size | 256k bulk_insert_buffer | 0k max_heap_table_size | 16M tmp_table_size | 16M max_allowed_packet | 1M thread_stack | 256k log | OFF log_error | /var/lib/mysql/huey.karwin.percona.com.err log_warnings | 1 log_slow_queries | ONlog_queries_not_using_indexes | OFF log_slave_updates | OFF
www.percona.com
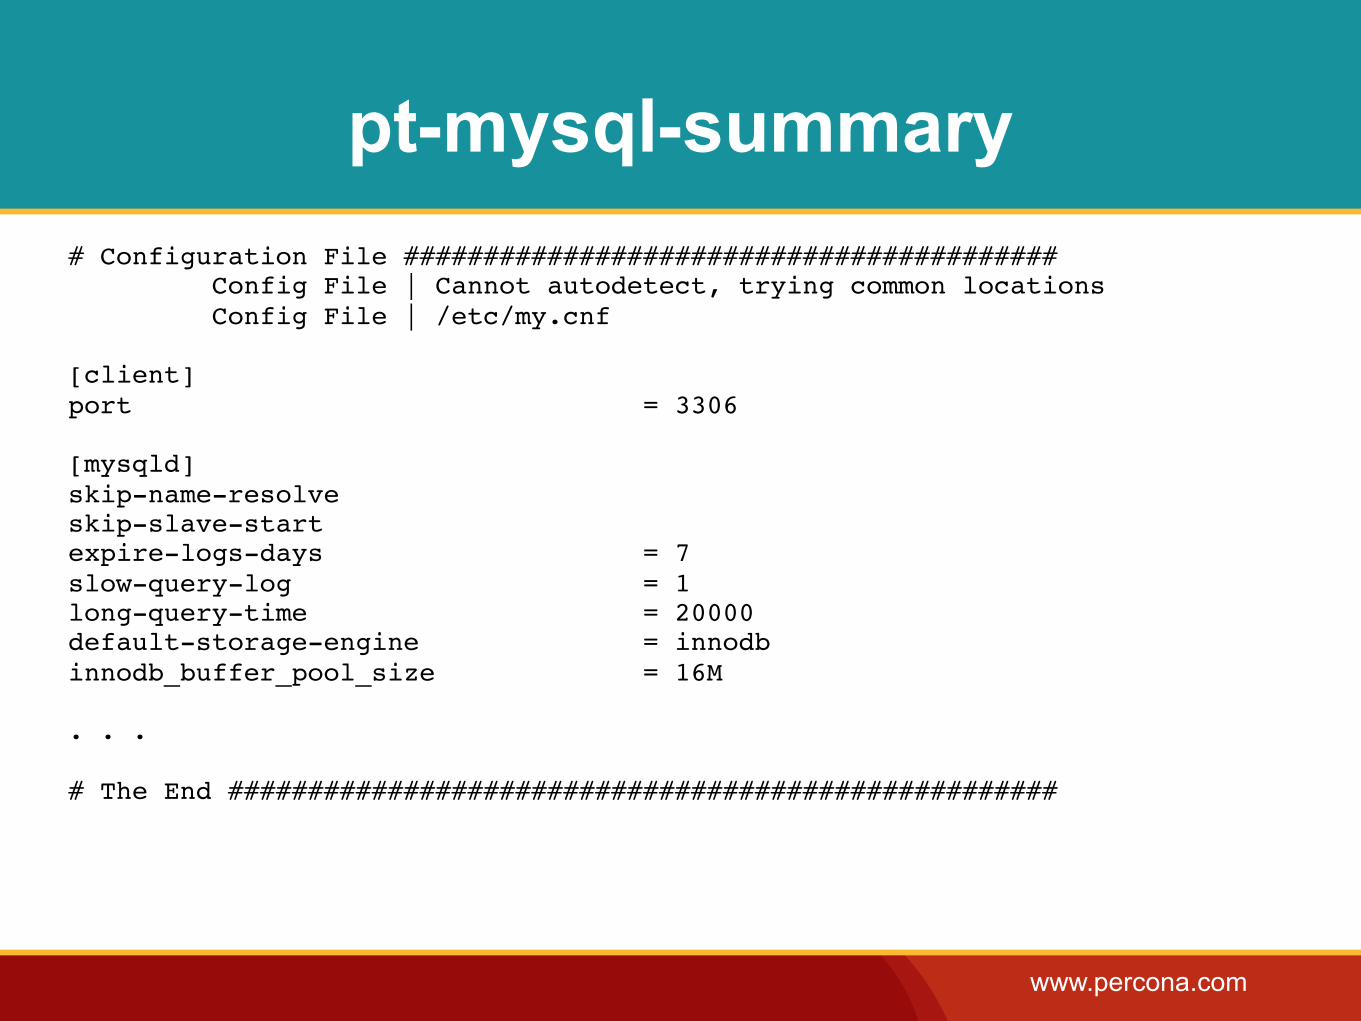
pt-mysql-summary# Configuration File ######################################### Config File | Cannot autodetect, trying common locations Config File | /etc/my.cnf
[client]port = 3306
[mysqld]skip-name-resolveskip-slave-startexpire-logs-days = 7slow-query-log = 1long-query-time = 20000default-storage-engine = innodbinnodb_buffer_pool_size = 16M
. . .
# The End ####################################################
www.percona.com
pt-variable-advisor
•Analyze MySQL variables and advise on possible problems.
- Uses SHOW VARIABLES from running MySQL instance, not my.cnf (they can be different).
- You can specify rules to ignore.
www.percona.com
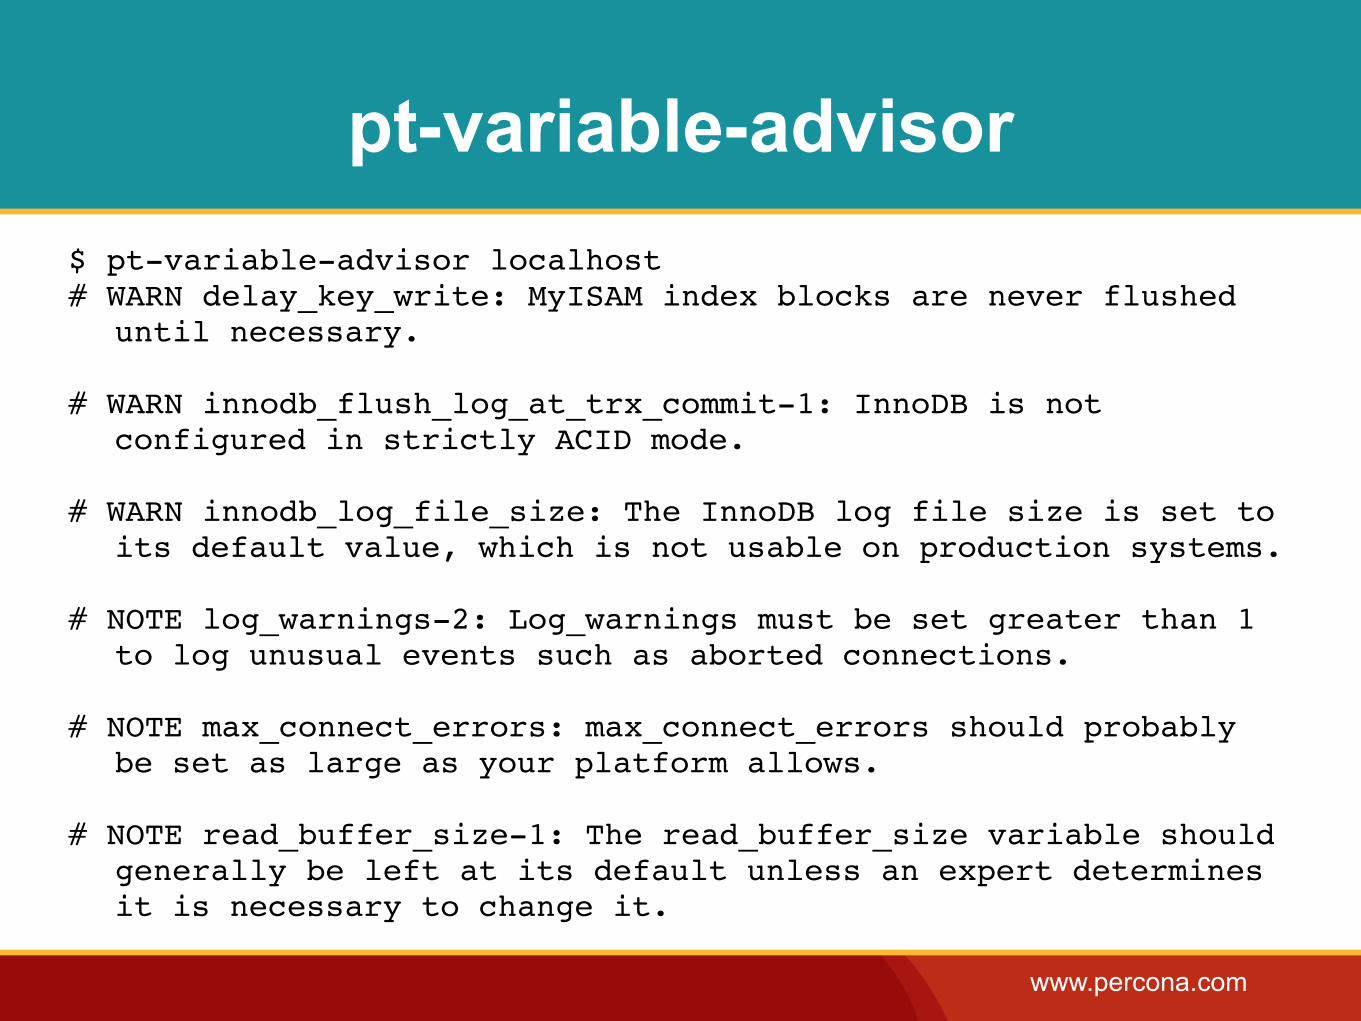
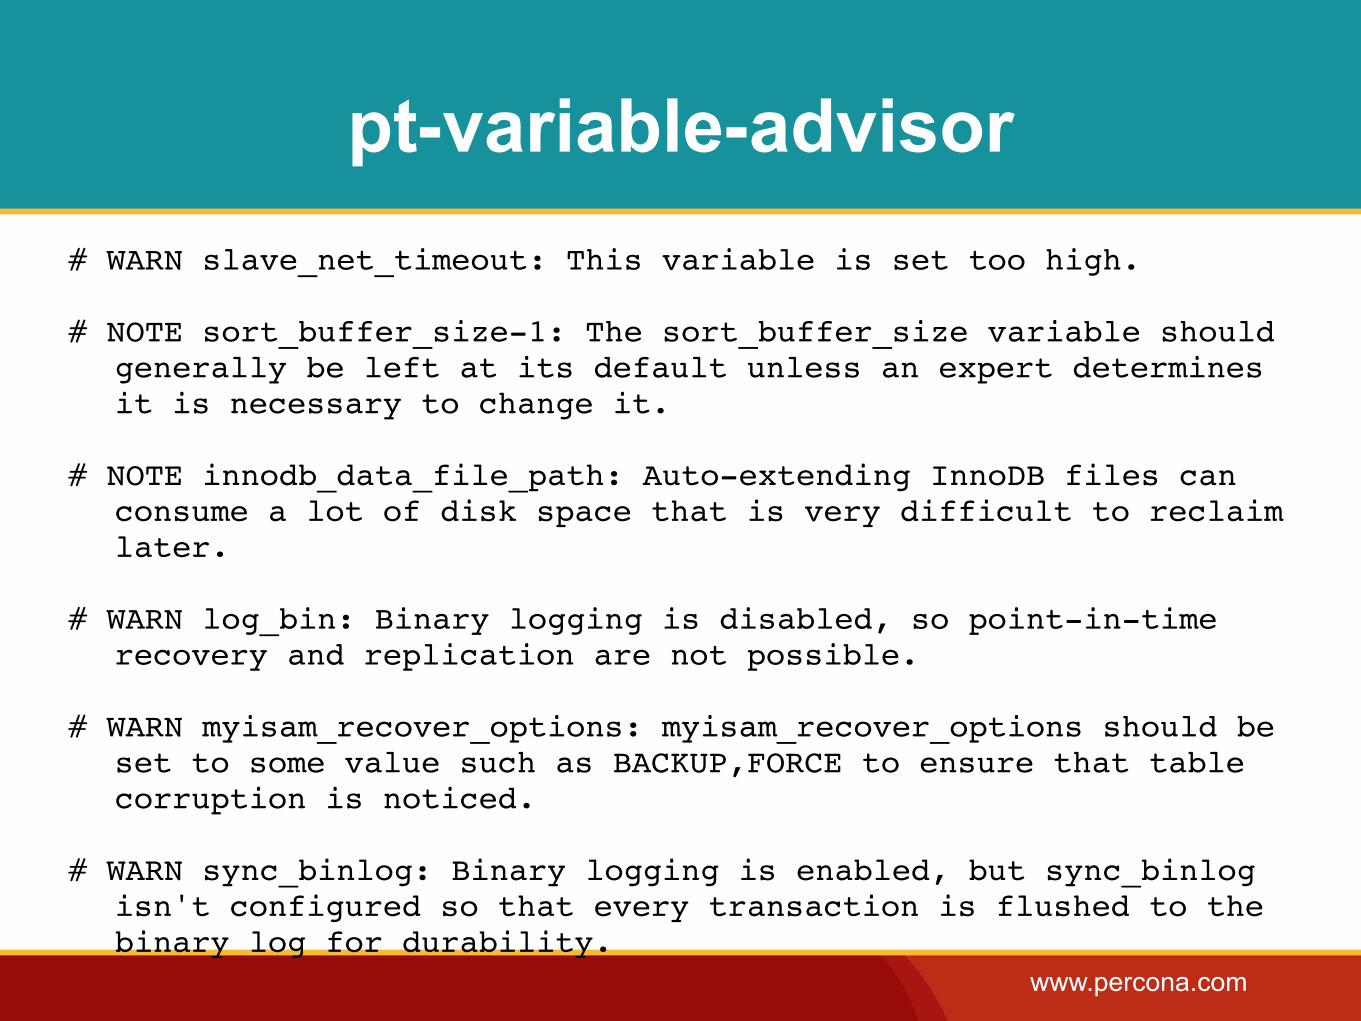
pt-variable-advisor$ pt-variable-advisor localhost# WARN delay_key_write: MyISAM index blocks are never flushed
until necessary.
# WARN innodb_flush_log_at_trx_commit-1: InnoDB is not configured in strictly ACID mode.
# WARN innodb_log_file_size: The InnoDB log file size is set to its default value, which is not usable on production systems.
# NOTE log_warnings-2: Log_warnings must be set greater than 1 to log unusual events such as aborted connections.
# NOTE max_connect_errors: max_connect_errors should probably be set as large as your platform allows.
# NOTE read_buffer_size-1: The read_buffer_size variable should generally be left at its default unless an expert determines it is necessary to change it.
www.percona.com
pt-variable-advisor# WARN slave_net_timeout: This variable is set too high.
# NOTE sort_buffer_size-1: The sort_buffer_size variable should generally be left at its default unless an expert determines it is necessary to change it.
# NOTE innodb_data_file_path: Auto-extending InnoDB files can consume a lot of disk space that is very difficult to reclaim later.
# WARN log_bin: Binary logging is disabled, so point-in-time recovery and replication are not possible.
# WARN myisam_recover_options: myisam_recover_options should be set to some value such as BACKUP,FORCE to ensure that table corruption is noticed.
# WARN sync_binlog: Binary logging is enabled, but sync_binlog isn't configured so that every transaction is flushed to the binary log for durability.
www.percona.com
Monitoring Tools
‣pt-deadlock-logger
‣pt-fk-error-logger
‣pt-mext
‣pt-query-digest
‣pt-trend
www.percona.com
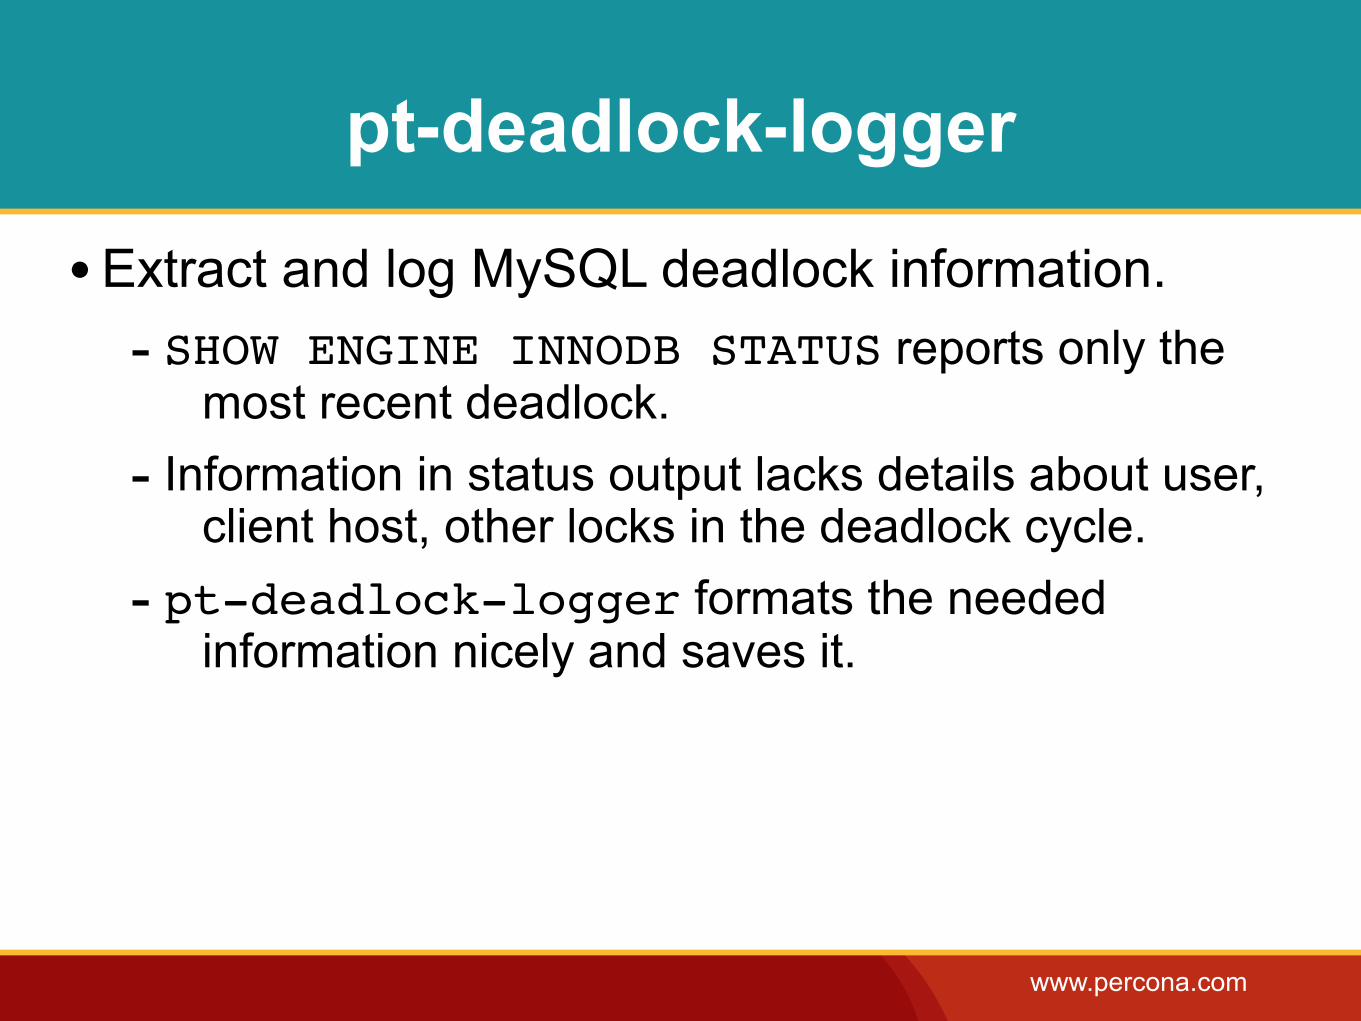
pt-deadlock-logger
•Extract and log MySQL deadlock information.- SHOW ENGINE INNODB STATUS reports only the
most recent deadlock.- Information in status output lacks details about user,
client host, other locks in the deadlock cycle.- pt-deadlock-logger formats the needed
information nicely and saves it.
www.percona.com
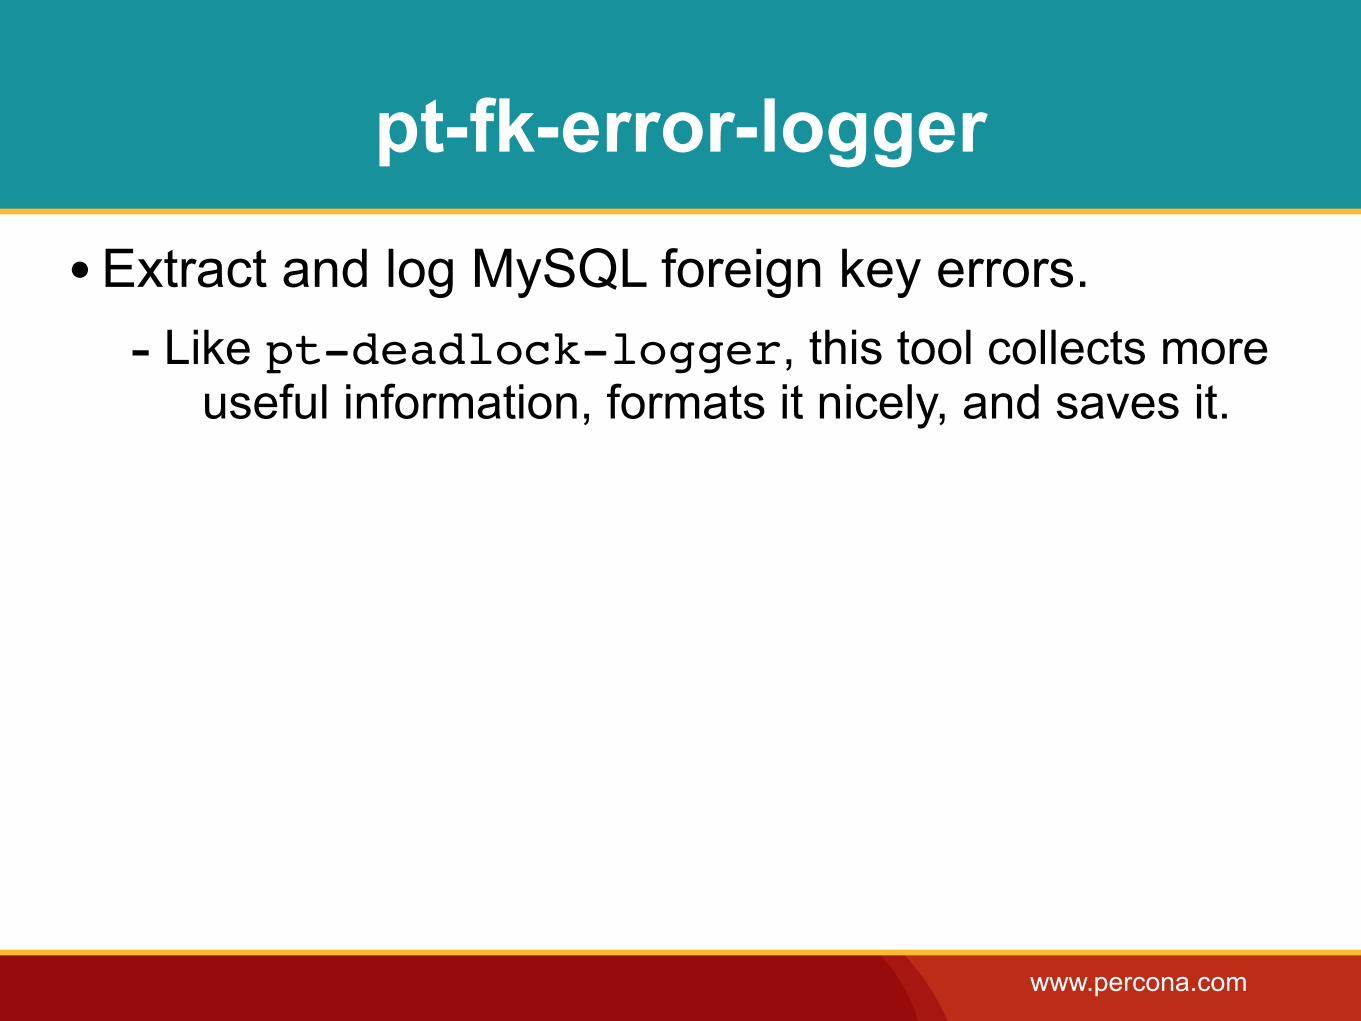
pt-fk-error-logger
•Extract and log MySQL foreign key errors.- Like pt-deadlock-logger, this tool collects more
useful information, formats it nicely, and saves it.
www.percona.com
pt-mext
• Look at many samples of MySQL SHOW GLOBAL STATUS side-by-side.
- Default STATUS shows counters since the MySQL instances started.
- It’s more helpful to see a delta of recent activity, to check if a change you applied made a difference.
www.percona.com
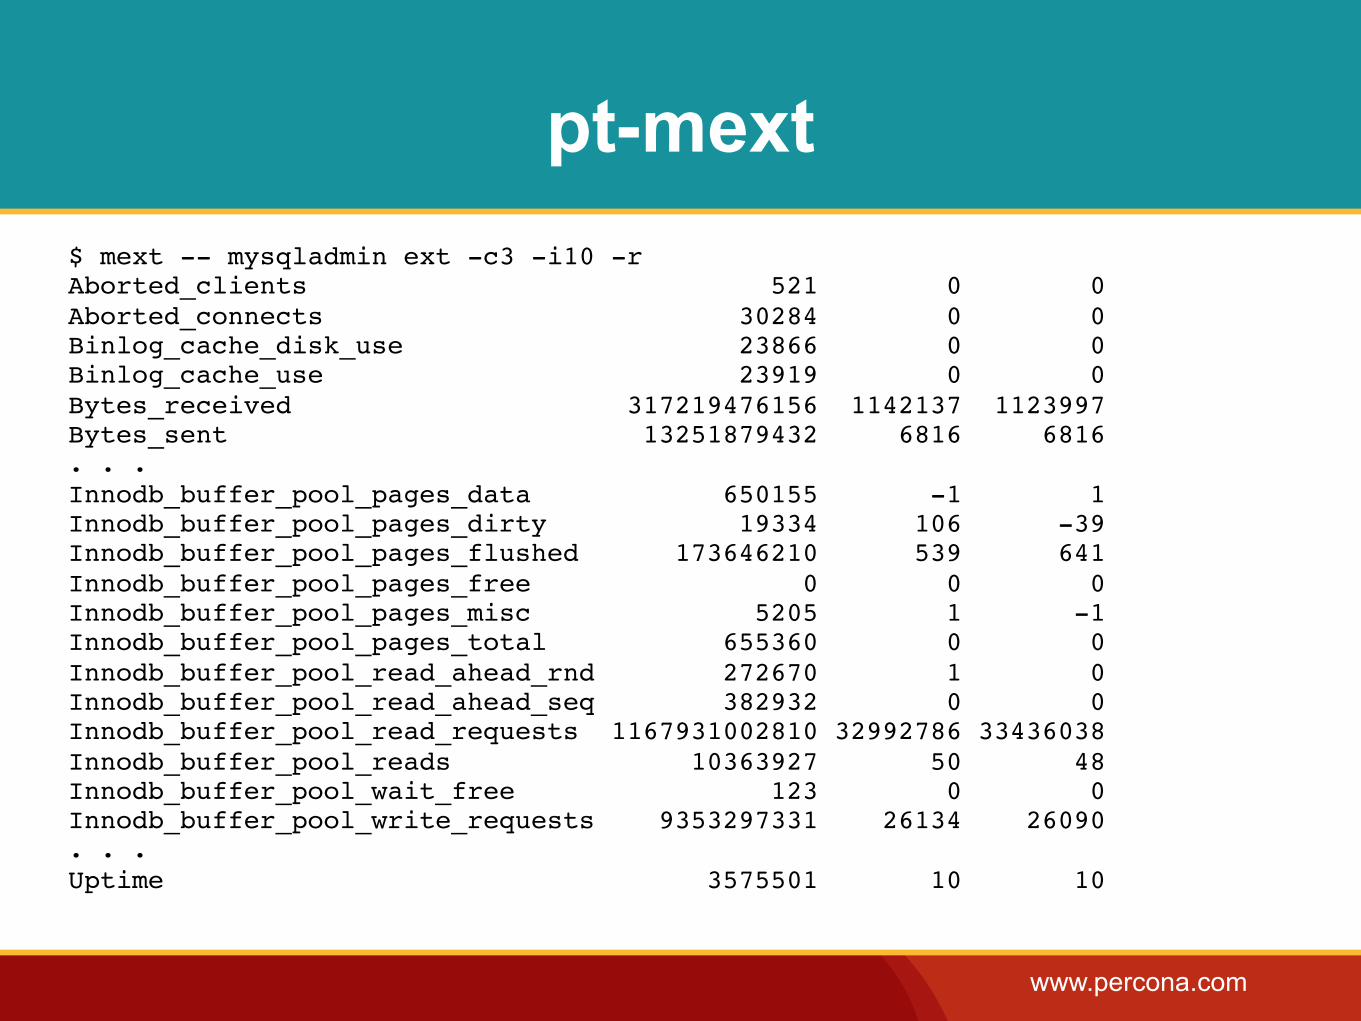
pt-mext$ mext -- mysqladmin ext -c3 -i10 -rAborted_clients 521 0 0Aborted_connects 30284 0 0Binlog_cache_disk_use 23866 0 0Binlog_cache_use 23919 0 0Bytes_received 317219476156 1142137 1123997Bytes_sent 13251879432 6816 6816. . .Innodb_buffer_pool_pages_data 650155 -1 1Innodb_buffer_pool_pages_dirty 19334 106 -39Innodb_buffer_pool_pages_flushed 173646210 539 641Innodb_buffer_pool_pages_free 0 0 0Innodb_buffer_pool_pages_misc 5205 1 -1Innodb_buffer_pool_pages_total 655360 0 0Innodb_buffer_pool_read_ahead_rnd 272670 1 0Innodb_buffer_pool_read_ahead_seq 382932 0 0Innodb_buffer_pool_read_requests 1167931002810 32992786 33436038Innodb_buffer_pool_reads 10363927 50 48Innodb_buffer_pool_wait_free 123 0 0Innodb_buffer_pool_write_requests 9353297331 26134 26090. . .Uptime 3575501 10 10
www.percona.com
pt-query-digest
•Analyze query execution logs and generate a query report, filter, replay, or transform queries.
- If you learn only one tool in Percona Toolkit, make it this one!
- Capture full query traffic in the slow query log with SET GLOBAL long_query_time=0;...temporarily.
- Copy the log to another server and analyze it there (pt-query-digest can be resource-intensive).
www.percona.com
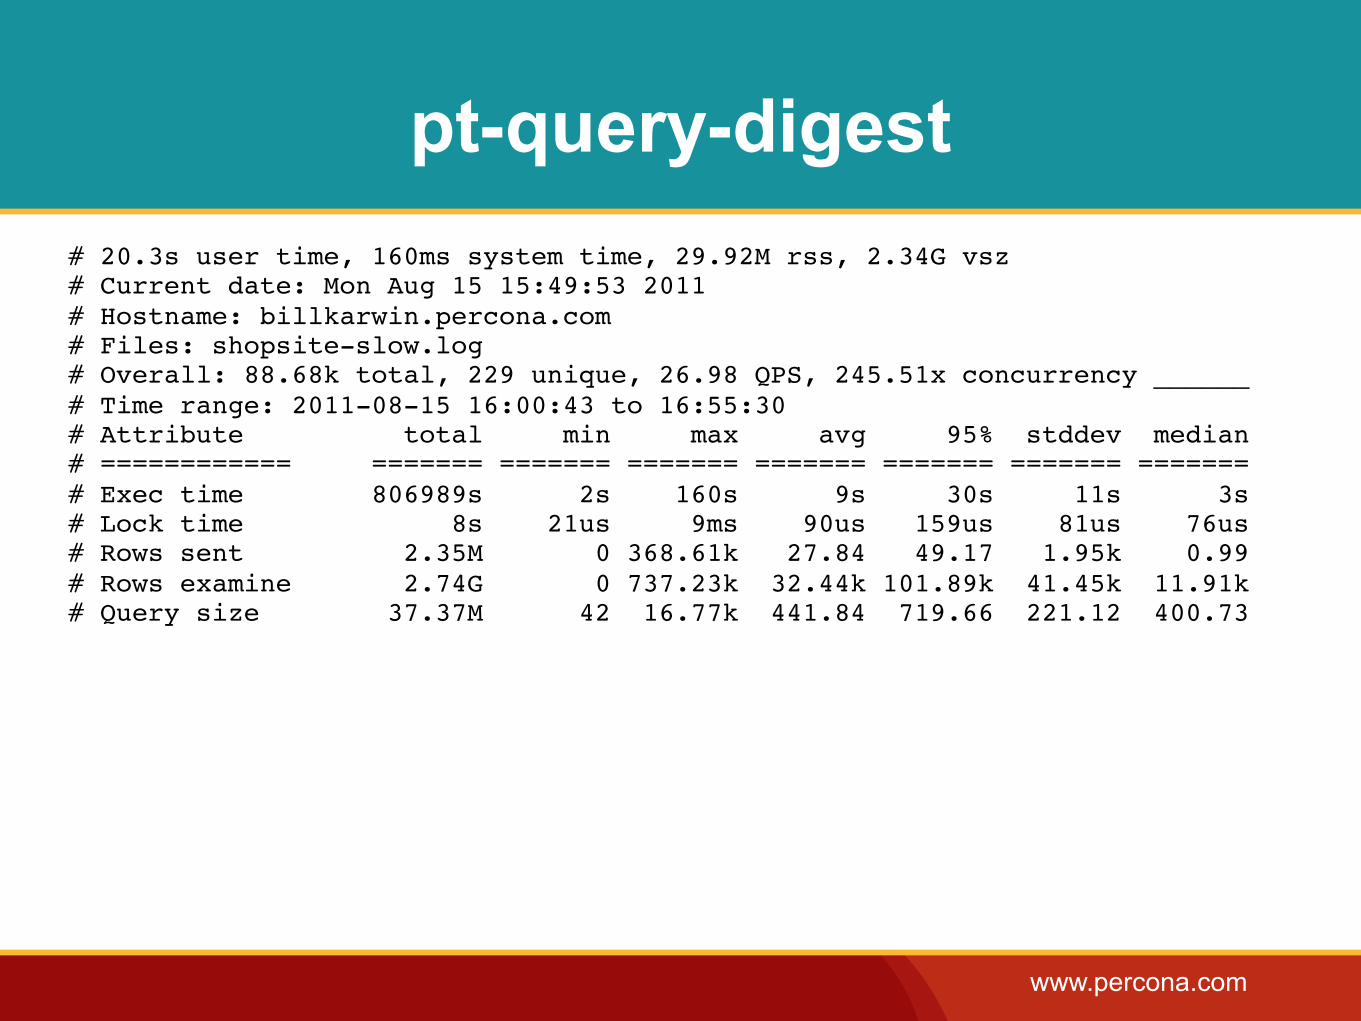
pt-query-digest# 20.3s user time, 160ms system time, 29.92M rss, 2.34G vsz# Current date: Mon Aug 15 15:49:53 2011# Hostname: billkarwin.percona.com# Files: shopsite-slow.log# Overall: 88.68k total, 229 unique, 26.98 QPS, 245.51x concurrency ______# Time range: 2011-08-15 16:00:43 to 16:55:30# Attribute total min max avg 95% stddev median# ============ ======= ======= ======= ======= ======= ======= =======# Exec time 806989s 2s 160s 9s 30s 11s 3s# Lock time 8s 21us 9ms 90us 159us 81us 76us# Rows sent 2.35M 0 368.61k 27.84 49.17 1.95k 0.99# Rows examine 2.74G 0 737.23k 32.44k 101.89k 41.45k 11.91k# Query size 37.37M 42 16.77k 441.84 719.66 221.12 400.73
www.percona.com
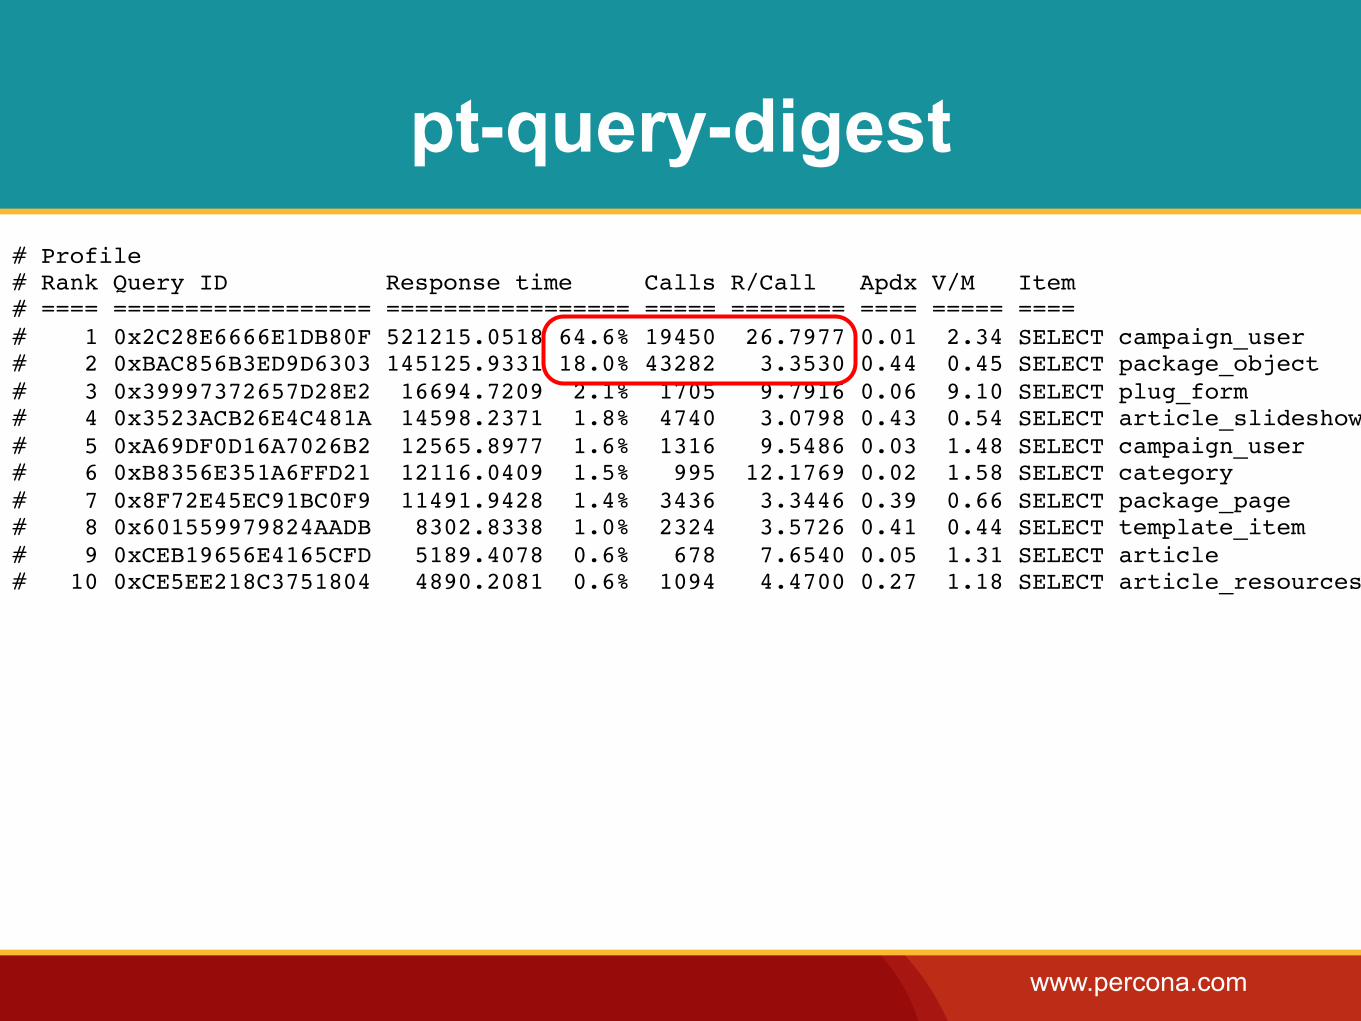
pt-query-digest# Profile# Rank Query ID Response time Calls R/Call Apdx V/M Item# ==== ================== ================= ===== ======== ==== ===== ====# 1 0x2C28E6666E1DB80F 521215.0518 64.6% 19450 26.7977 0.01 2.34 SELECT campaign_user# 2 0xBAC856B3ED9D6303 145125.9331 18.0% 43282 3.3530 0.44 0.45 SELECT package_object# 3 0x39997372657D28E2 16694.7209 2.1% 1705 9.7916 0.06 9.10 SELECT plug_form# 4 0x3523ACB26E4C481A 14598.2371 1.8% 4740 3.0798 0.43 0.54 SELECT article_slideshow# 5 0xA69DF0D16A7026B2 12565.8977 1.6% 1316 9.5486 0.03 1.48 SELECT campaign_user# 6 0xB8356E351A6FFD21 12116.0409 1.5% 995 12.1769 0.02 1.58 SELECT category# 7 0x8F72E45EC91BC0F9 11491.9428 1.4% 3436 3.3446 0.39 0.66 SELECT package_page# 8 0x601559979824AADB 8302.8338 1.0% 2324 3.5726 0.41 0.44 SELECT template_item# 9 0xCEB19656E4165CFD 5189.4078 0.6% 678 7.6540 0.05 1.31 SELECT article# 10 0xCE5EE218C3751804 4890.2081 0.6% 1094 4.4700 0.27 1.18 SELECT article_resources
www.percona.com
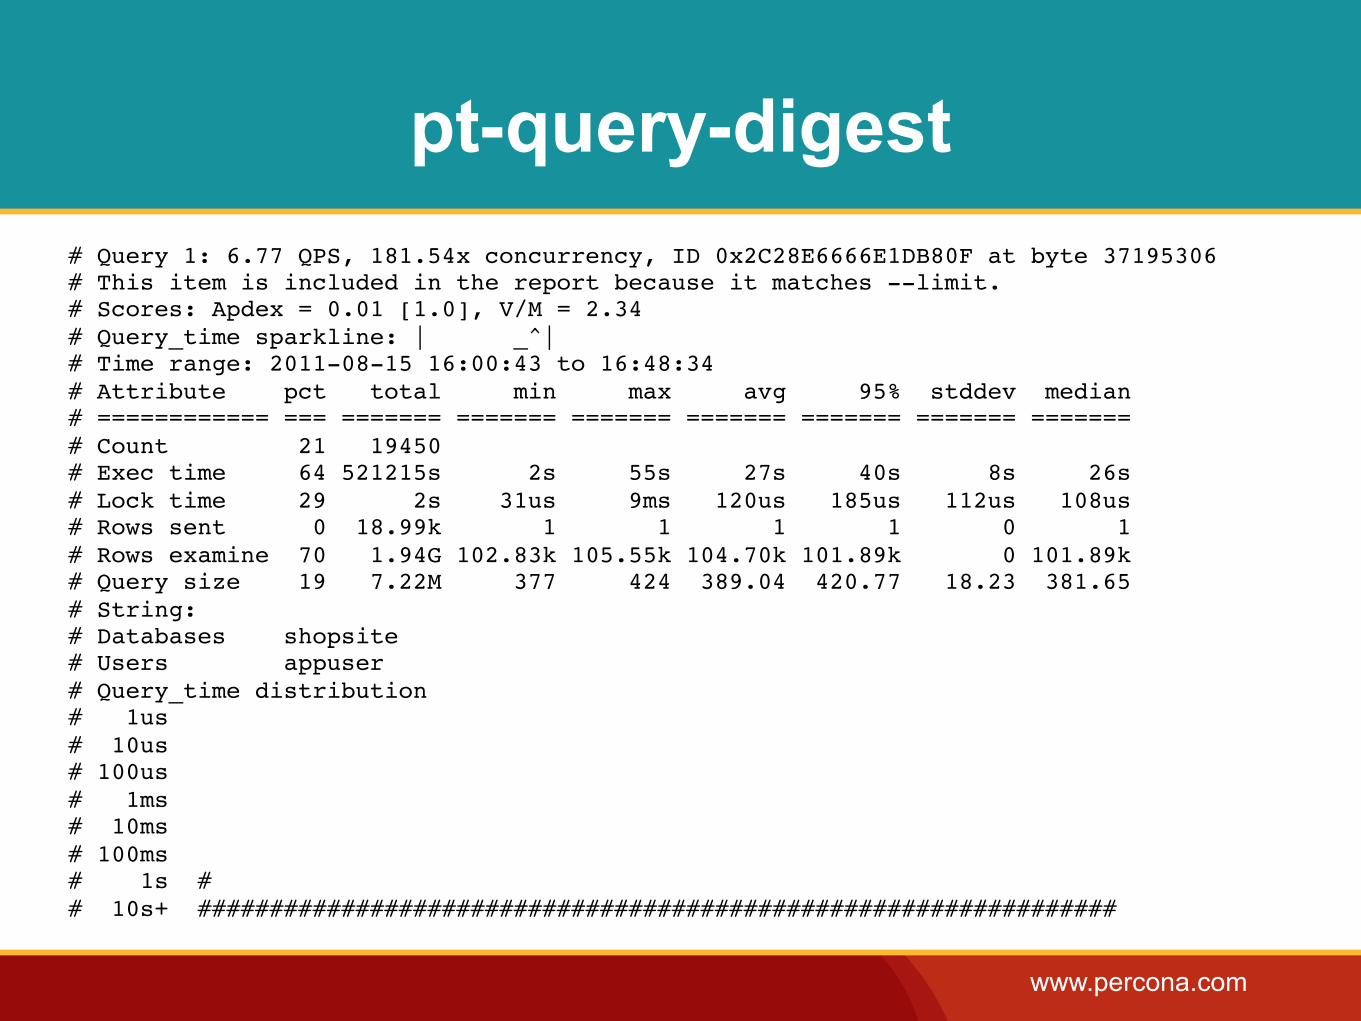
pt-query-digest# Query 1: 6.77 QPS, 181.54x concurrency, ID 0x2C28E6666E1DB80F at byte 37195306# This item is included in the report because it matches --limit.# Scores: Apdex = 0.01 [1.0], V/M = 2.34# Query_time sparkline: | _^|# Time range: 2011-08-15 16:00:43 to 16:48:34# Attribute pct total min max avg 95% stddev median# ============ === ======= ======= ======= ======= ======= ======= =======# Count 21 19450# Exec time 64 521215s 2s 55s 27s 40s 8s 26s# Lock time 29 2s 31us 9ms 120us 185us 112us 108us# Rows sent 0 18.99k 1 1 1 1 0 1# Rows examine 70 1.94G 102.83k 105.55k 104.70k 101.89k 0 101.89k# Query size 19 7.22M 377 424 389.04 420.77 18.23 381.65# String:# Databases shopsite# Users appuser# Query_time distribution# 1us# 10us# 100us# 1ms# 10ms# 100ms# 1s ## 10s+ ################################################################
www.percona.com
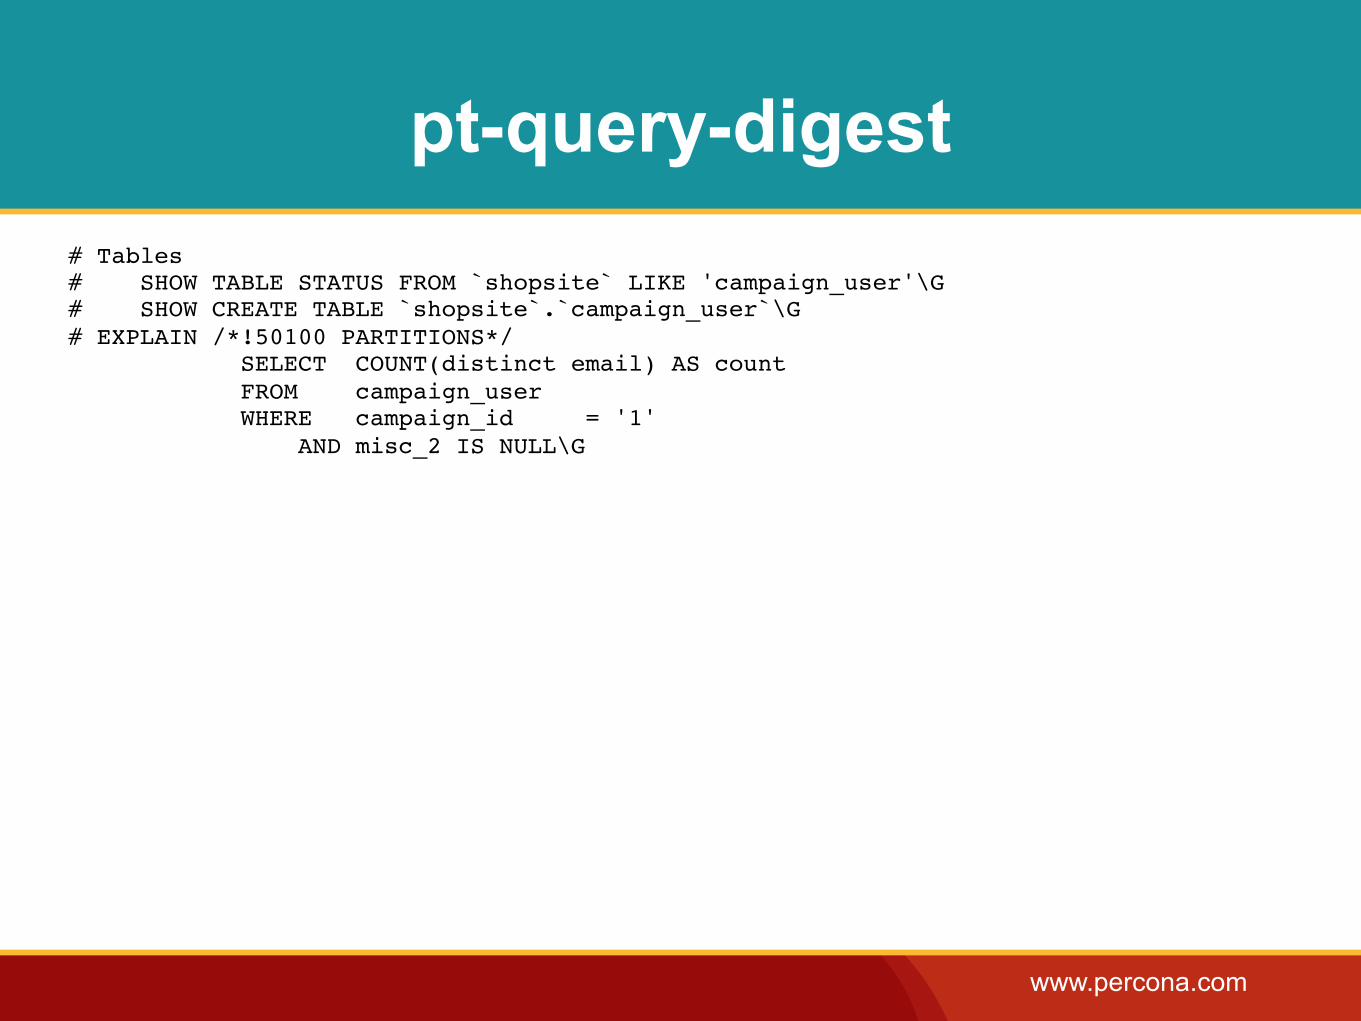
pt-query-digest# Tables# SHOW TABLE STATUS FROM `shopsite` LIKE 'campaign_user'\G# SHOW CREATE TABLE `shopsite`.`campaign_user`\G# EXPLAIN /*!50100 PARTITIONS*/ SELECT COUNT(distinct email) AS count FROM campaign_user WHERE campaign_id = '1' AND misc_2 IS NULL\G
www.percona.com
pt-query-digest
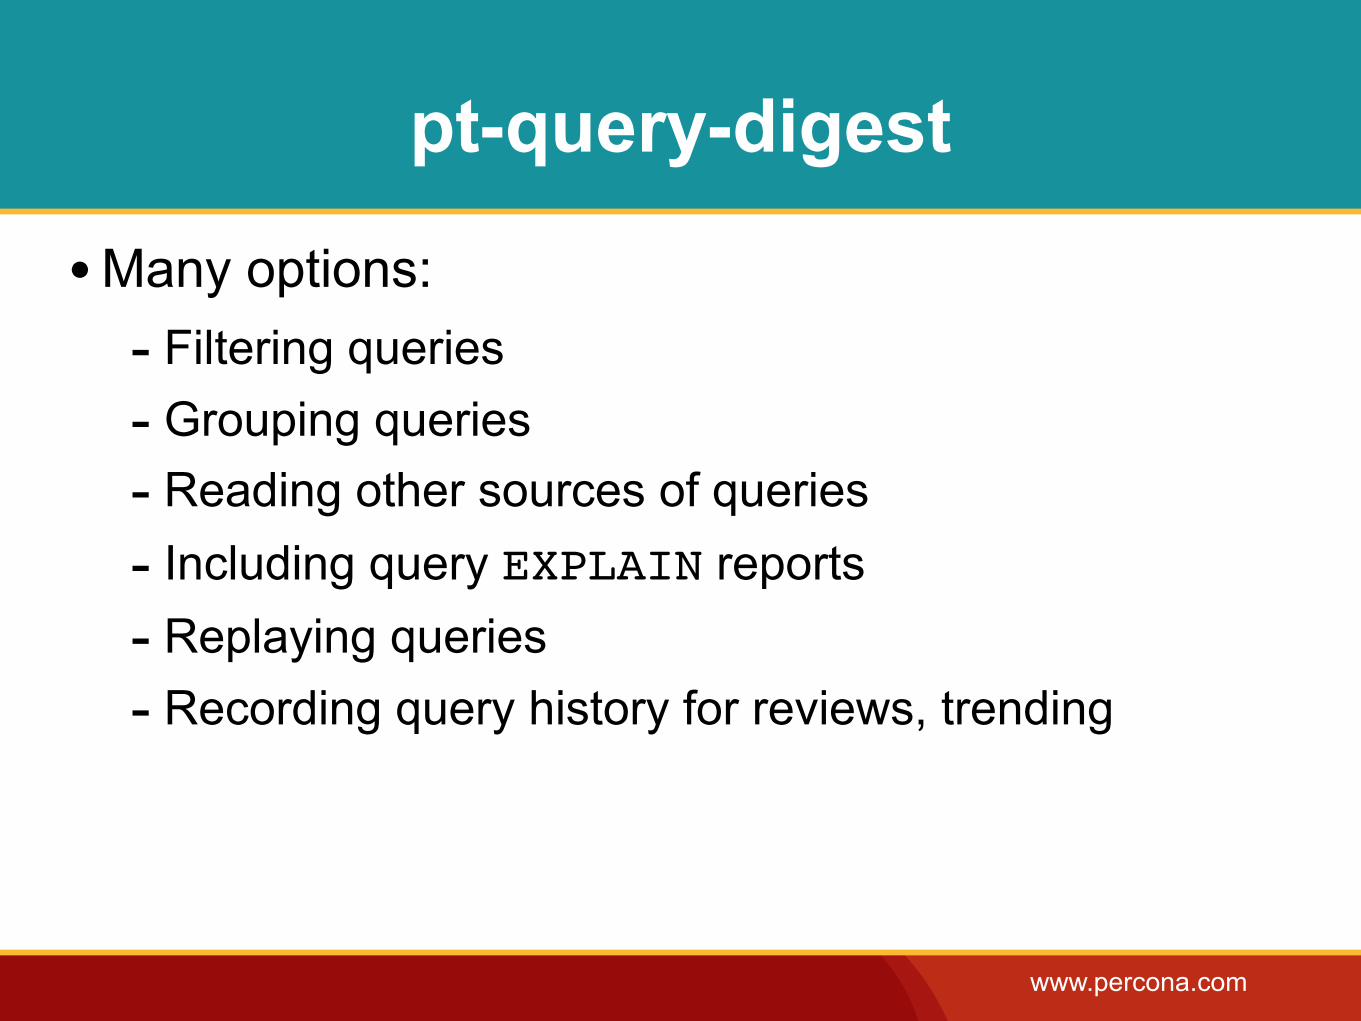
•Many options:- Filtering queries- Grouping queries- Reading other sources of queries- Including query EXPLAIN reports- Replaying queries- Recording query history for reviews, trending
www.percona.com
Replication Tools
‣pt-heartbeat‣pt-slave-delay‣pt-slave-find‣pt-slave-restart‣pt-table-checksum‣pt-table-sync
www.percona.com
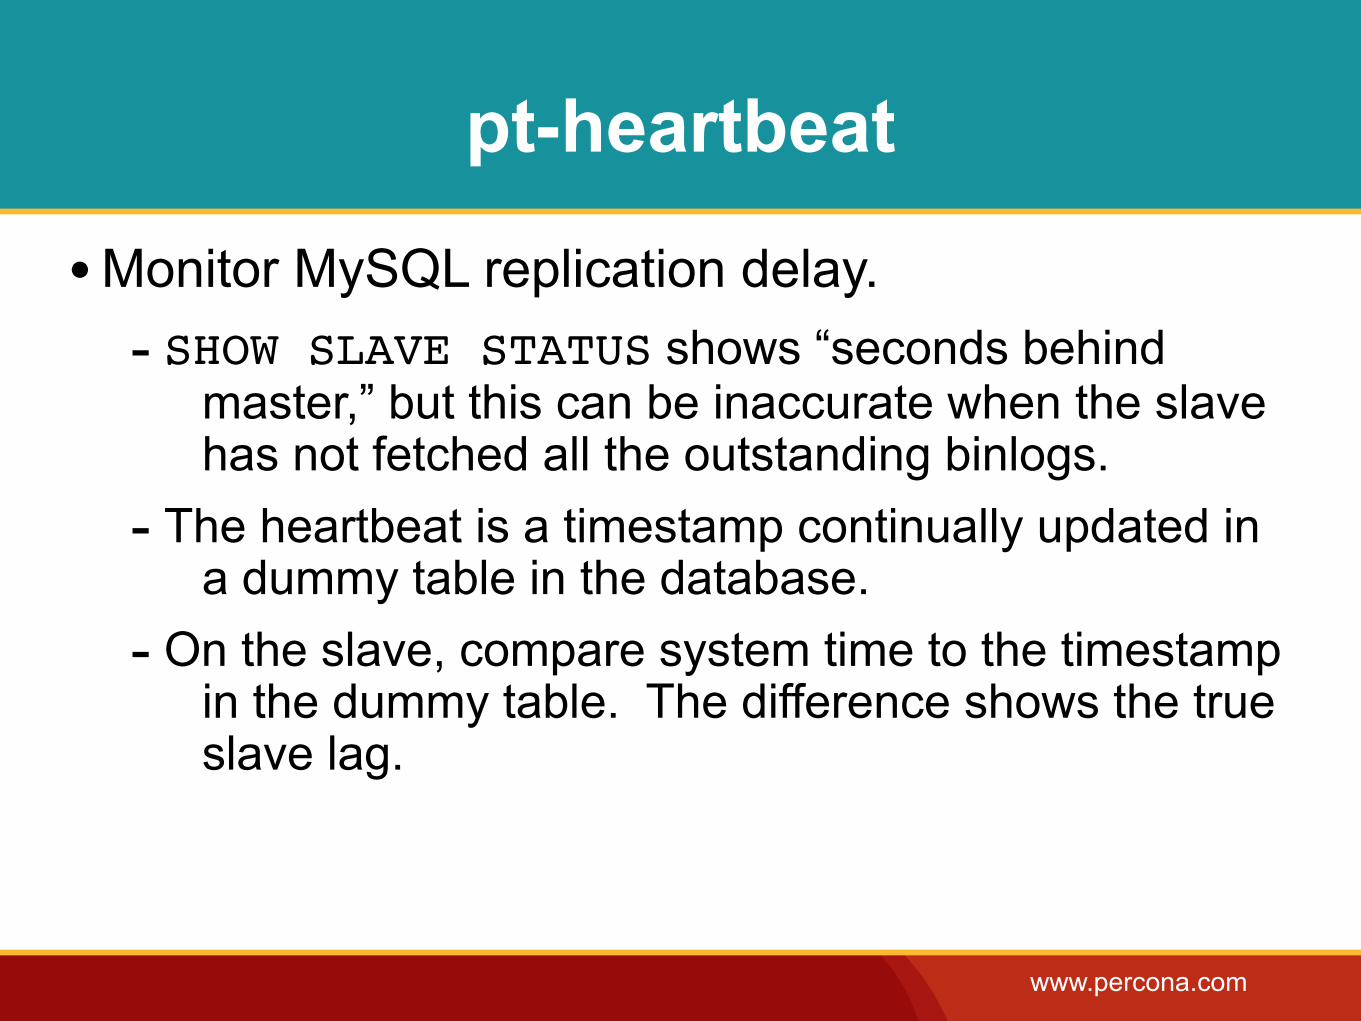
pt-heartbeat
•Monitor MySQL replication delay.- SHOW SLAVE STATUS shows “seconds behind
master,” but this can be inaccurate when the slave has not fetched all the outstanding binlogs.
- The heartbeat is a timestamp continually updated in a dummy table in the database.
- On the slave, compare system time to the timestamp in the dummy table. The difference shows the true slave lag.
www.percona.com
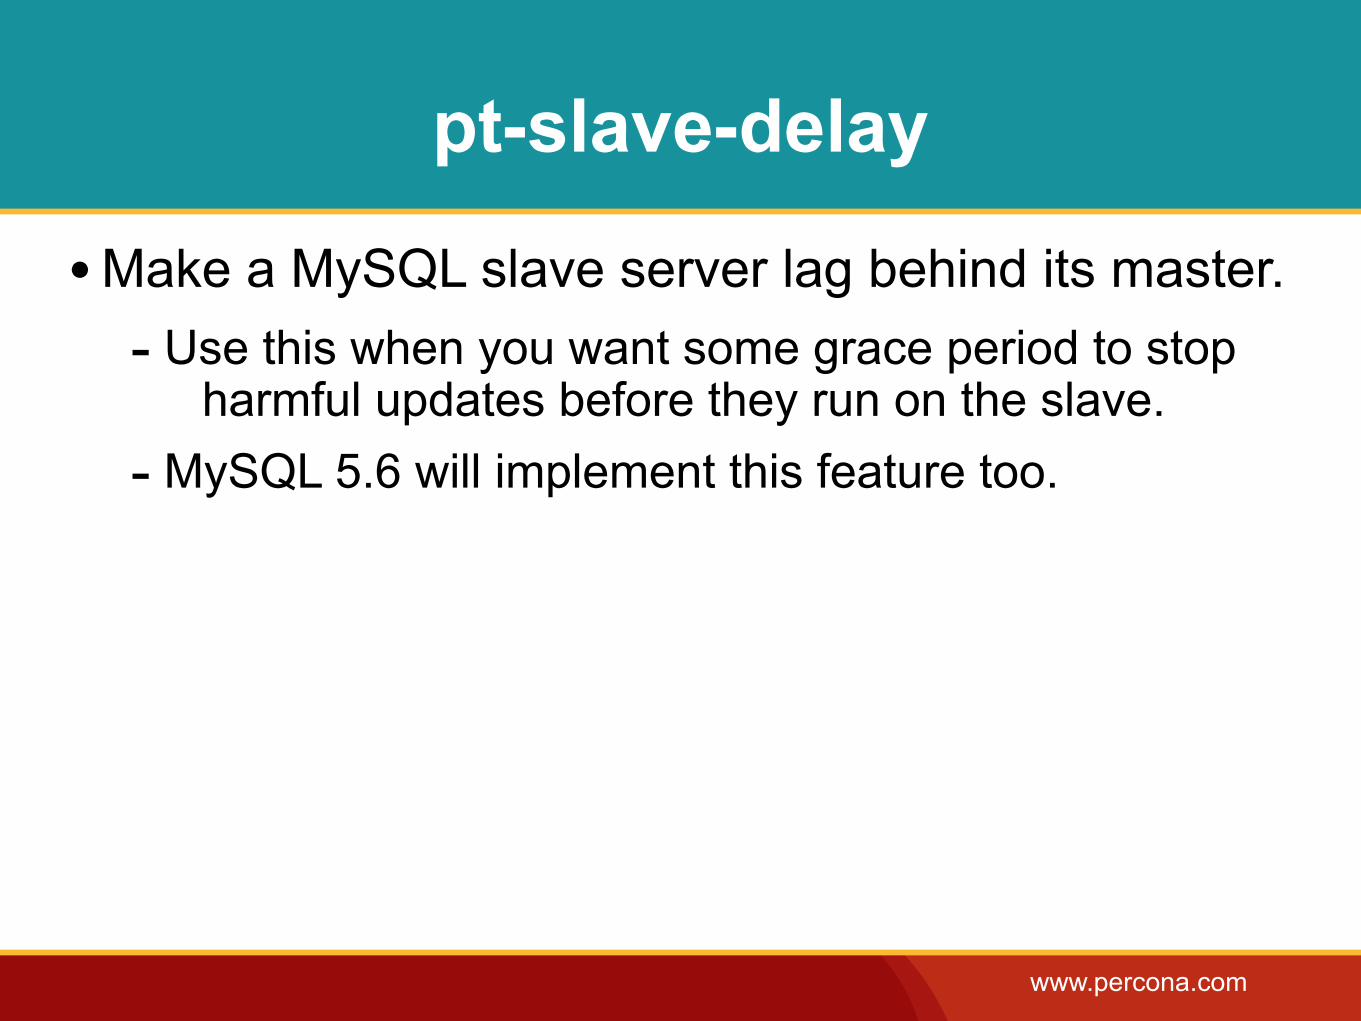
pt-slave-delay
•Make a MySQL slave server lag behind its master.- Use this when you want some grace period to stop
harmful updates before they run on the slave.- MySQL 5.6 will implement this feature too.
www.percona.com
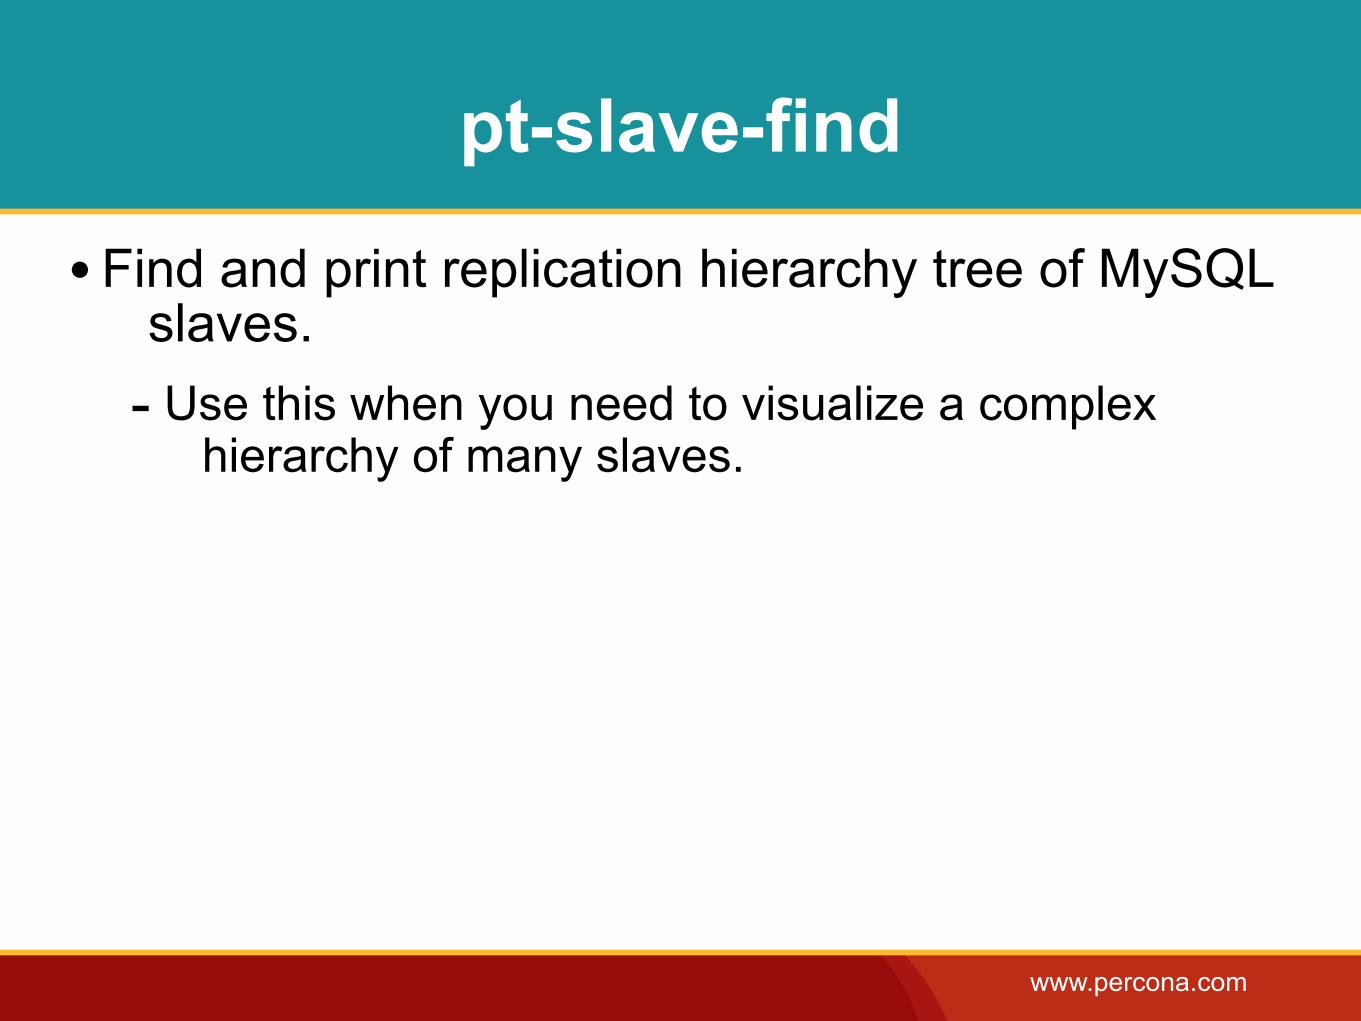
pt-slave-find
• Find and print replication hierarchy tree of MySQL slaves.
- Use this when you need to visualize a complex hierarchy of many slaves.
www.percona.com
pt-slave-restart
•Watch and restart MySQL replication after errors.- Give a specific error number, and let the slave skip
the SQL statement responsible.
www.percona.com
pt-table-checksum
•Perform an online replication consistency check, or checksum MySQL tables efficiently.
- This is the solution to detect slave drift.
www.percona.com
pt-table-sync
•Synchronize MySQL table data efficiently.- This is the solution to correct slave drift.
www.percona.com
System Tools
‣pt-collect
‣pt-diskstats
‣pt-fifo-split
‣pt-summary
‣pt-tcp-model
‣pt-sift
‣pt-stalk
www.percona.com
pt-collect
•Collect information from a server for some period of time.
www.percona.com
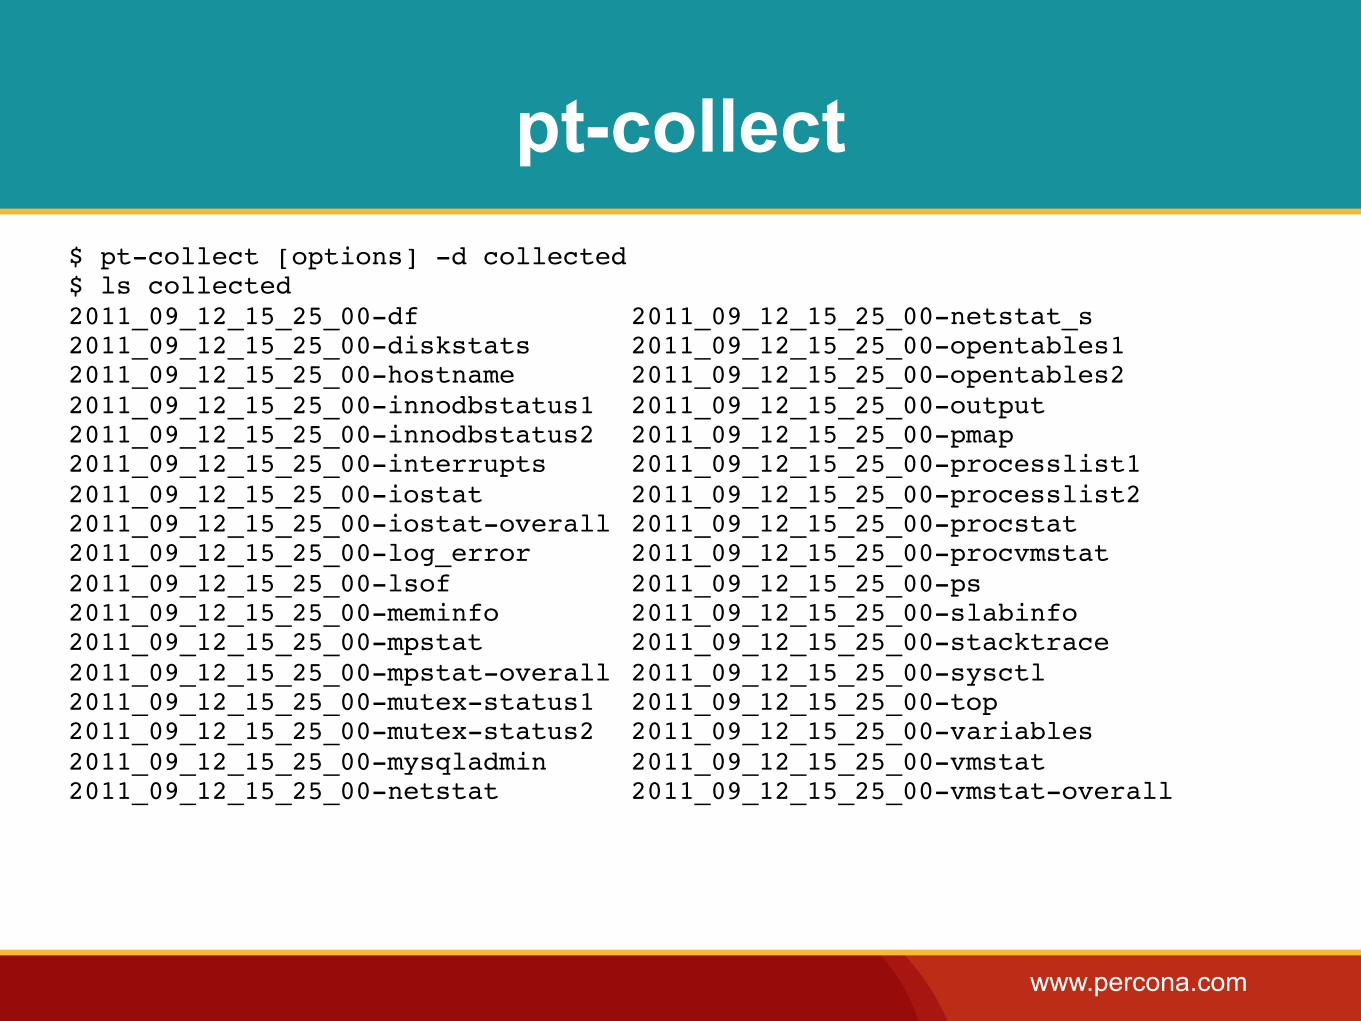
pt-collect$ pt-collect [options] -d collected$ ls collected2011_09_12_15_25_00-df! ! ! ! 2011_09_12_15_25_00-netstat_s2011_09_12_15_25_00-diskstats! ! 2011_09_12_15_25_00-opentables12011_09_12_15_25_00-hostname! ! 2011_09_12_15_25_00-opentables22011_09_12_15_25_00-innodbstatus1! 2011_09_12_15_25_00-output2011_09_12_15_25_00-innodbstatus2! 2011_09_12_15_25_00-pmap2011_09_12_15_25_00-interrupts! ! 2011_09_12_15_25_00-processlist12011_09_12_15_25_00-iostat! ! ! 2011_09_12_15_25_00-processlist22011_09_12_15_25_00-iostat-overall!2011_09_12_15_25_00-procstat2011_09_12_15_25_00-log_error! ! 2011_09_12_15_25_00-procvmstat2011_09_12_15_25_00-lsof! ! ! 2011_09_12_15_25_00-ps2011_09_12_15_25_00-meminfo!! ! 2011_09_12_15_25_00-slabinfo2011_09_12_15_25_00-mpstat! ! ! 2011_09_12_15_25_00-stacktrace2011_09_12_15_25_00-mpstat-overall!2011_09_12_15_25_00-sysctl2011_09_12_15_25_00-mutex-status1! 2011_09_12_15_25_00-top2011_09_12_15_25_00-mutex-status2! 2011_09_12_15_25_00-variables2011_09_12_15_25_00-mysqladmin! ! 2011_09_12_15_25_00-vmstat2011_09_12_15_25_00-netstat!! ! 2011_09_12_15_25_00-vmstat-overall

www.percona.com
pt-stalk
•Wait for a condition to occur, collect information.- Low-impact process, safe to run continually.- Invokes pt-collect after an event you specify.
www.percona.com
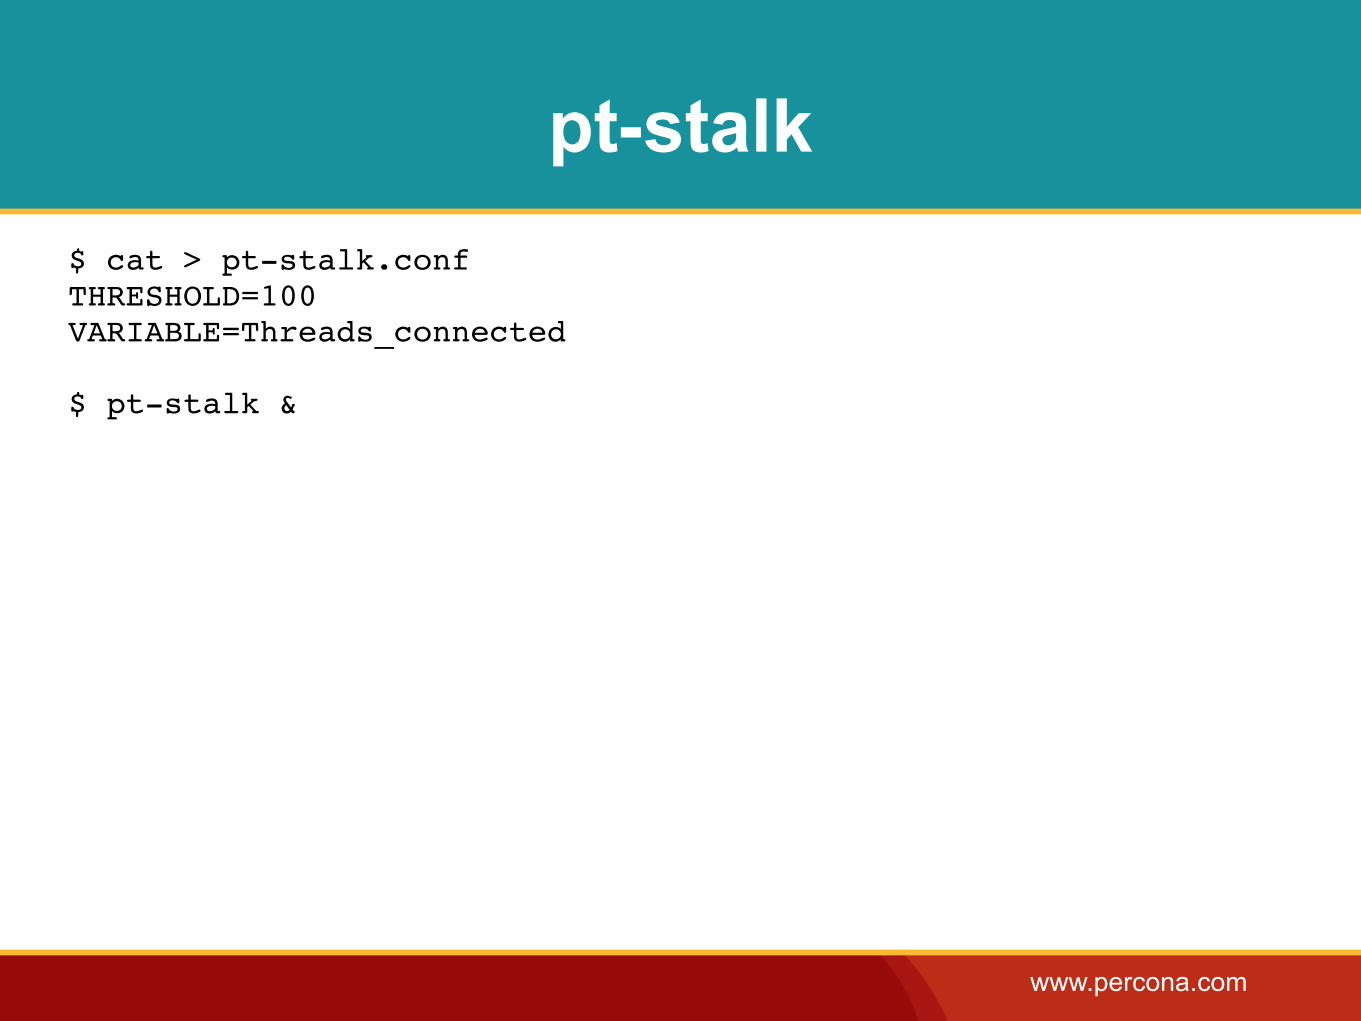
pt-stalk$ cat > pt-stalk.confTHRESHOLD=100VARIABLE=Threads_connected
$ pt-stalk &
www.percona.com
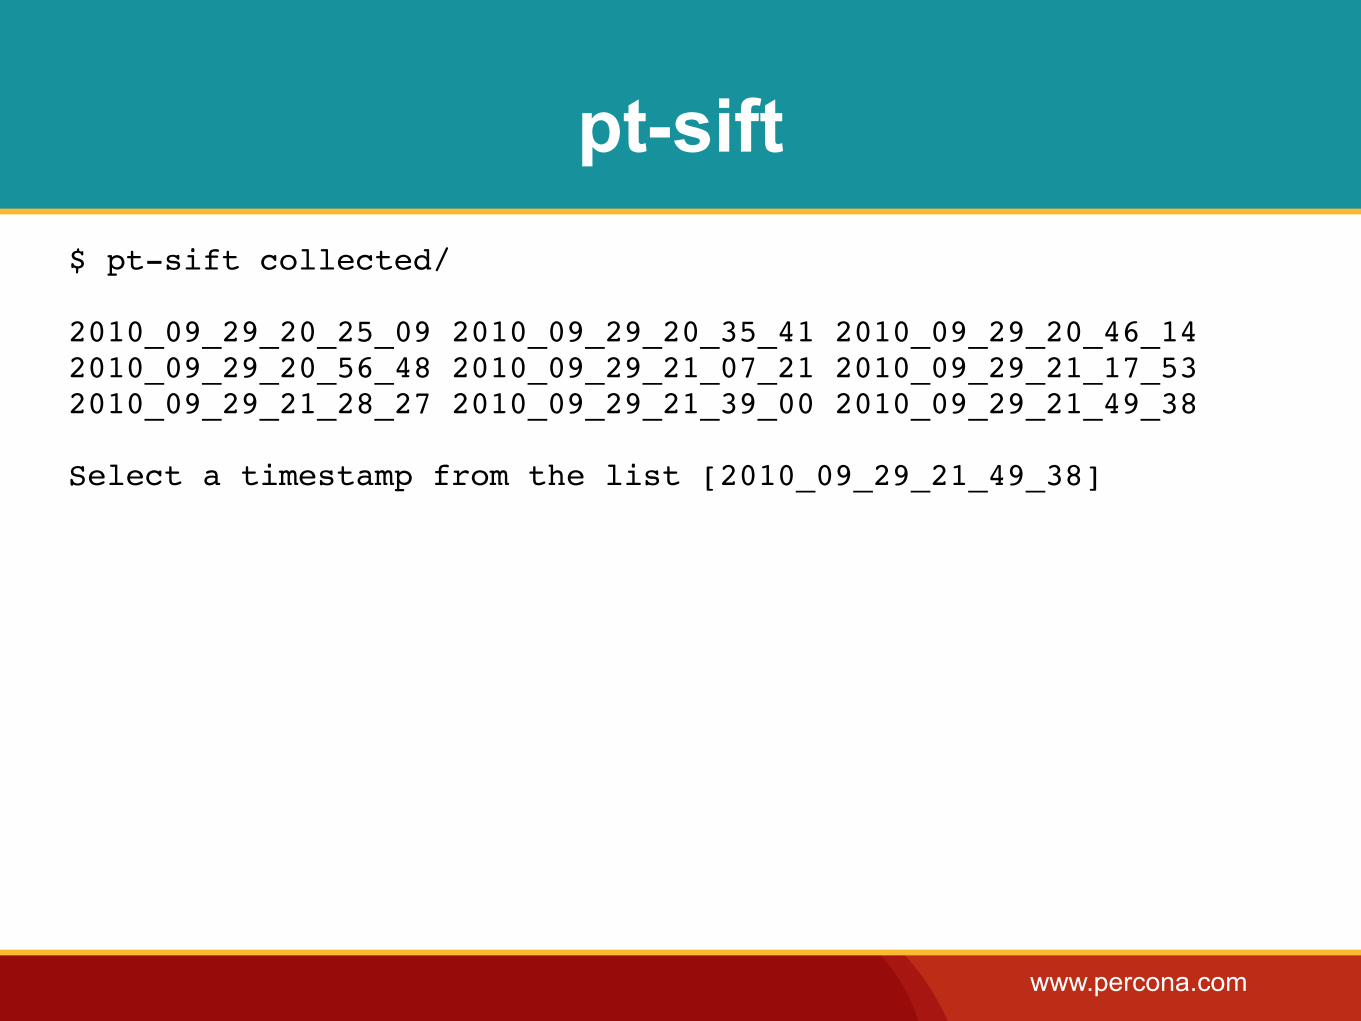
pt-sift
•Browse files created by pt-collect.- Your collected directory can accumulate many files
from many sample times.- pt-sift helps you choose a sample time, and
formats the diagnostic information more nicely.
www.percona.com
pt-sift$ pt-sift collected/
2010_09_29_20_25_09 2010_09_29_20_35_41 2010_09_29_20_46_142010_09_29_20_56_48 2010_09_29_21_07_21 2010_09_29_21_17_532010_09_29_21_28_27 2010_09_29_21_39_00 2010_09_29_21_49_38
Select a timestamp from the list [2010_09_29_21_49_38]
www.percona.com
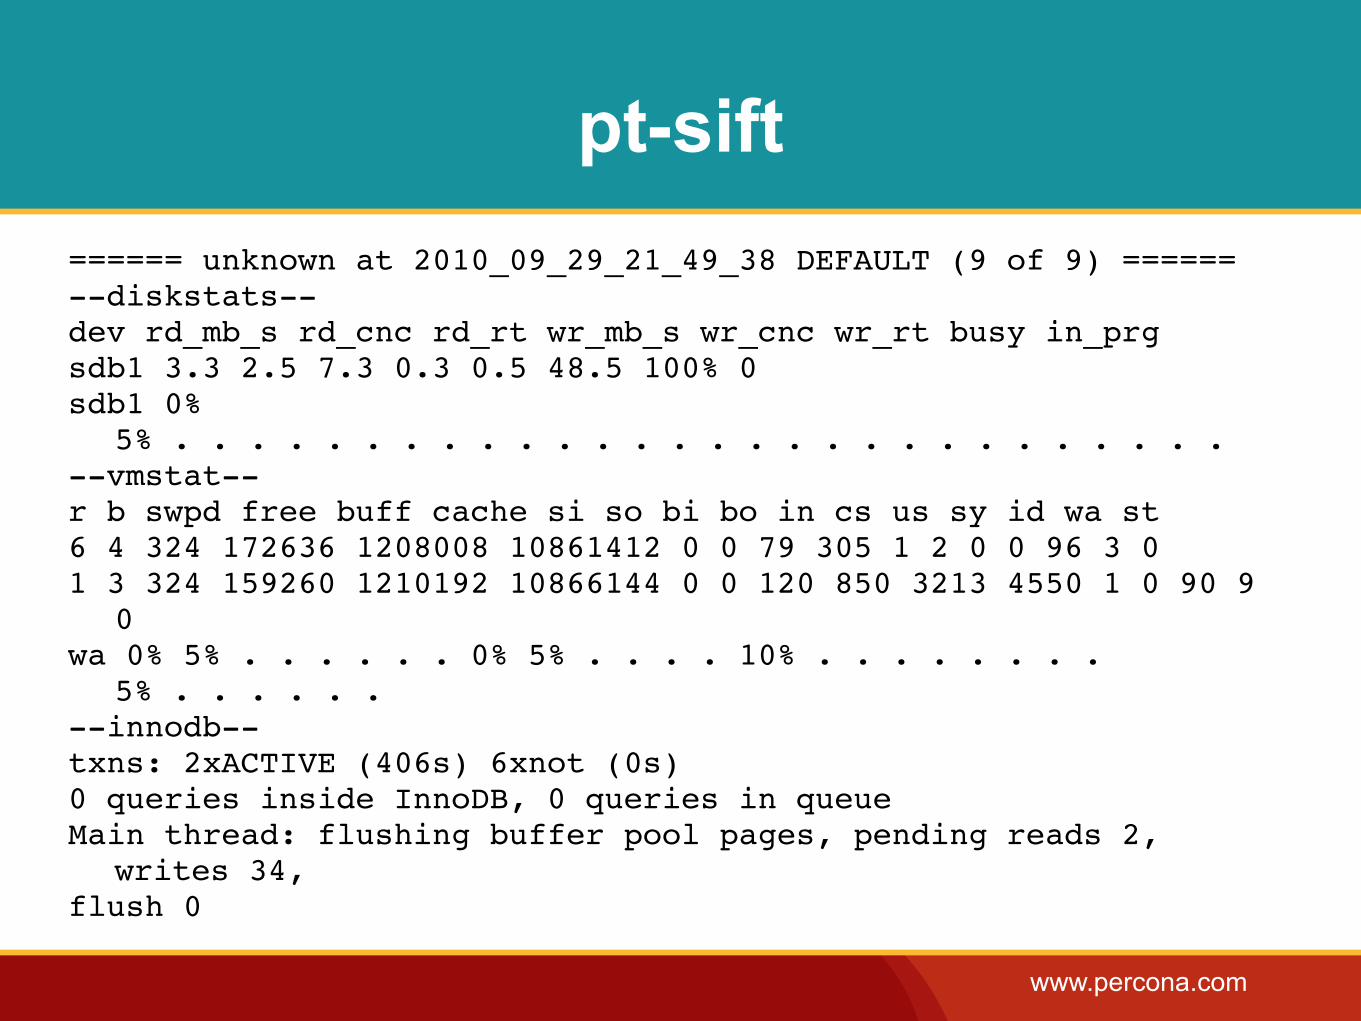
pt-sift====== unknown at 2010_09_29_21_49_38 DEFAULT (9 of 9) ======--diskstats--dev rd_mb_s rd_cnc rd_rt wr_mb_s wr_cnc wr_rt busy in_prgsdb1 3.3 2.5 7.3 0.3 0.5 48.5 100% 0sdb1 0%
5% . . . . . . . . . . . . . . . . . . . . . . . . . . . .--vmstat--r b swpd free buff cache si so bi bo in cs us sy id wa st6 4 324 172636 1208008 10861412 0 0 79 305 1 2 0 0 96 3 01 3 324 159260 1210192 10866144 0 0 120 850 3213 4550 1 0 90 9
0wa 0% 5% . . . . . . 0% 5% . . . . 10% . . . . . . . .
5% . . . . . .--innodb--txns: 2xACTIVE (406s) 6xnot (0s)0 queries inside InnoDB, 0 queries in queueMain thread: flushing buffer pool pages, pending reads 2,
writes 34,flush 0
www.percona.com
pt-diskstats
•Aggregate and summarize /proc/diskstats.- Gives you more useful data than iostat.
www.percona.com
pt-fifo-split
•Split files and pipe lines to a fifo without really splitting.
- Good for processing large log files.
www.percona.com
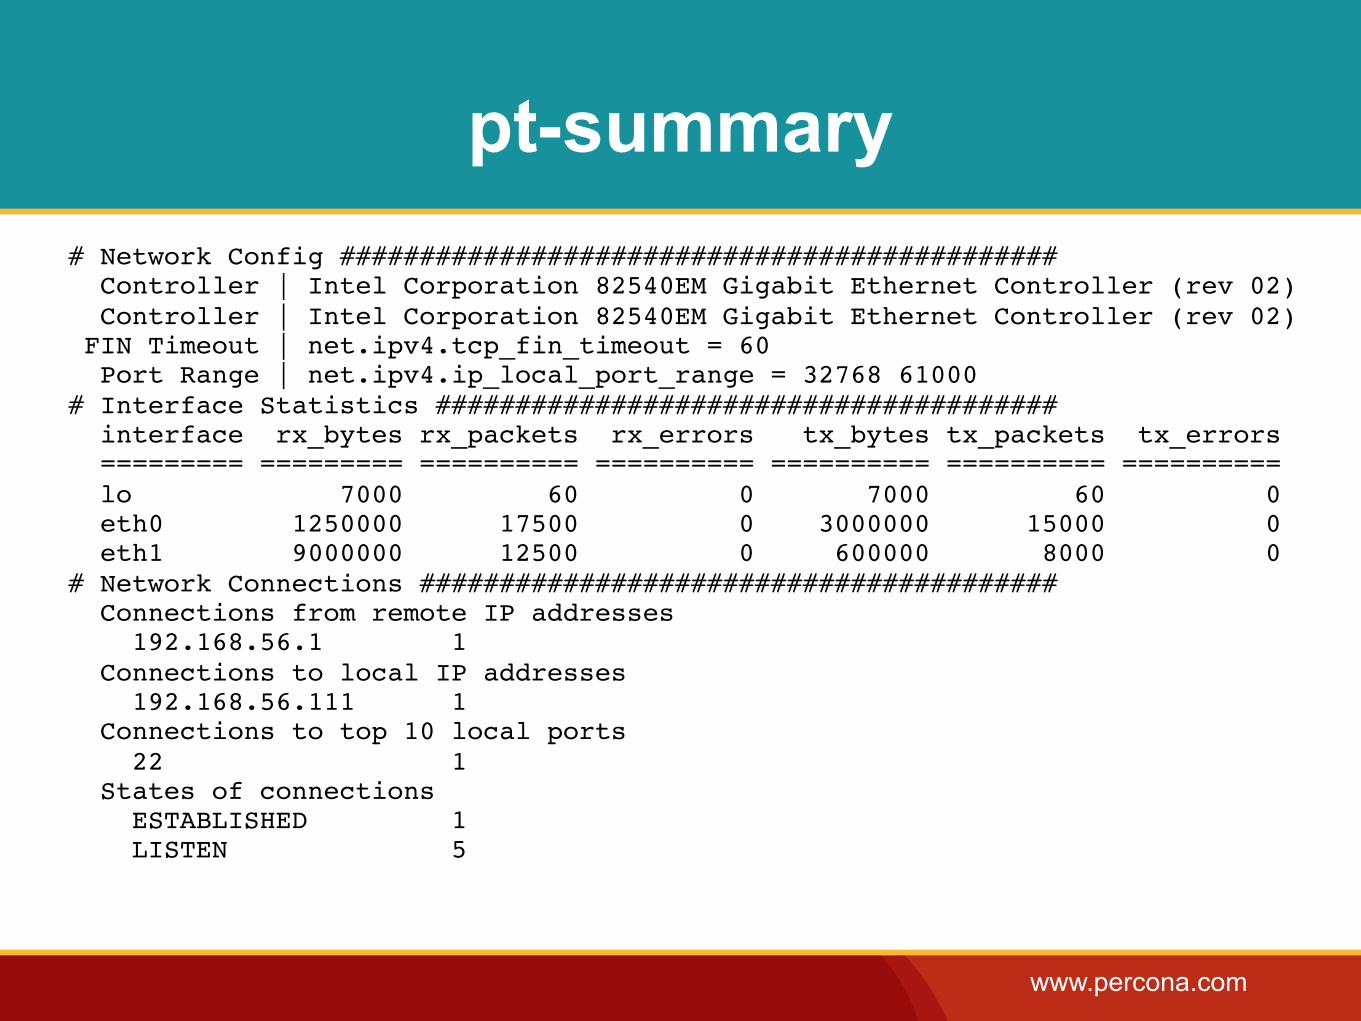
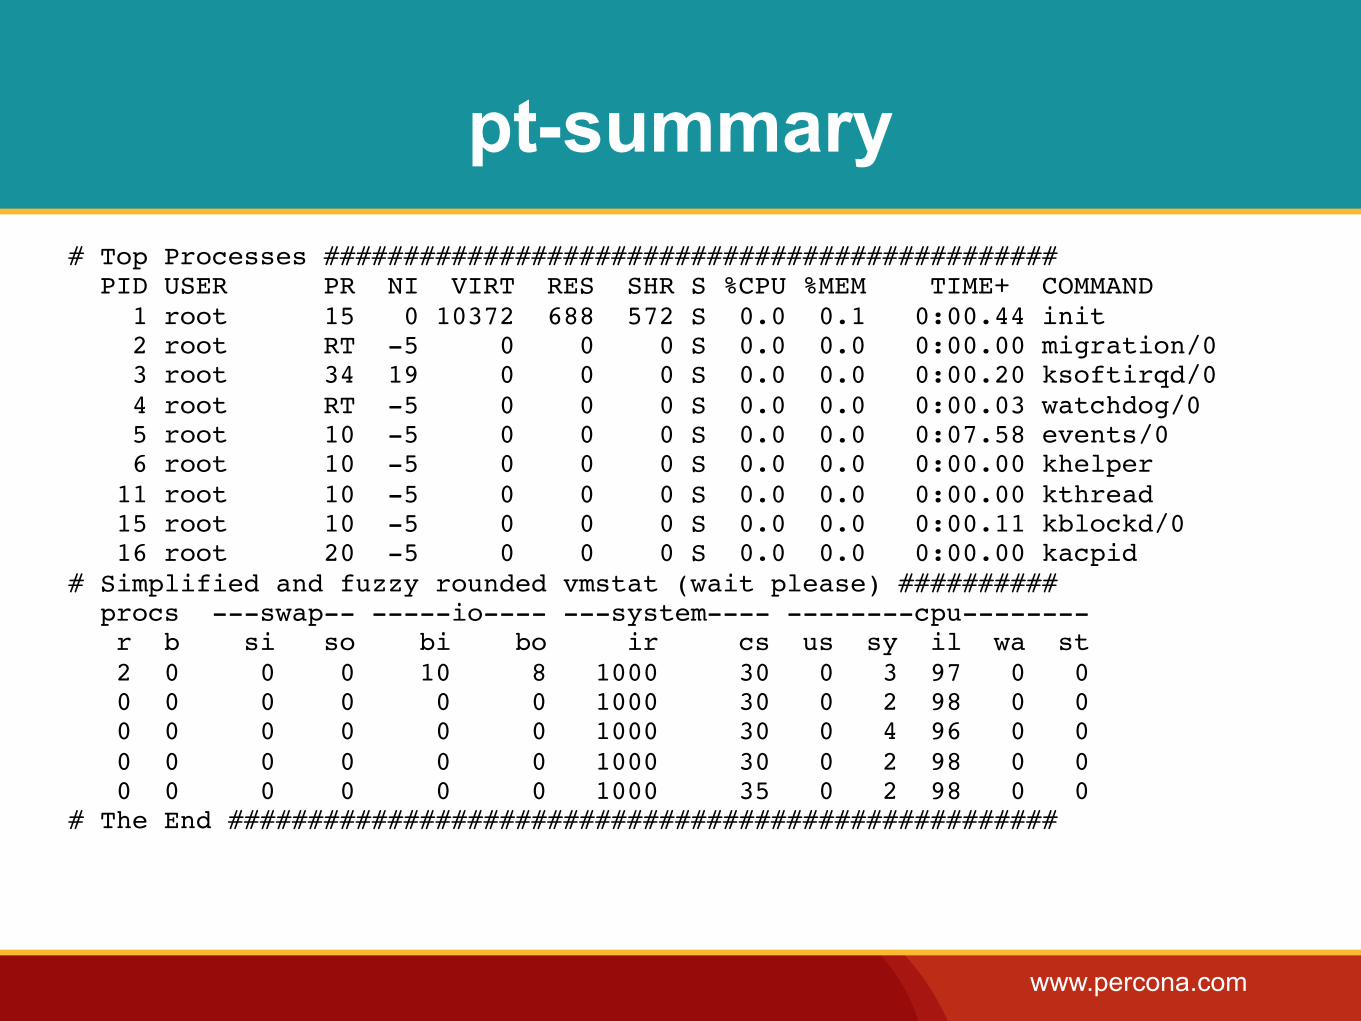
pt-summary
•Summarize system information in a nice way.- Complement of pt-mysql-summary.
- Great to get a quick view of system status.
www.percona.com
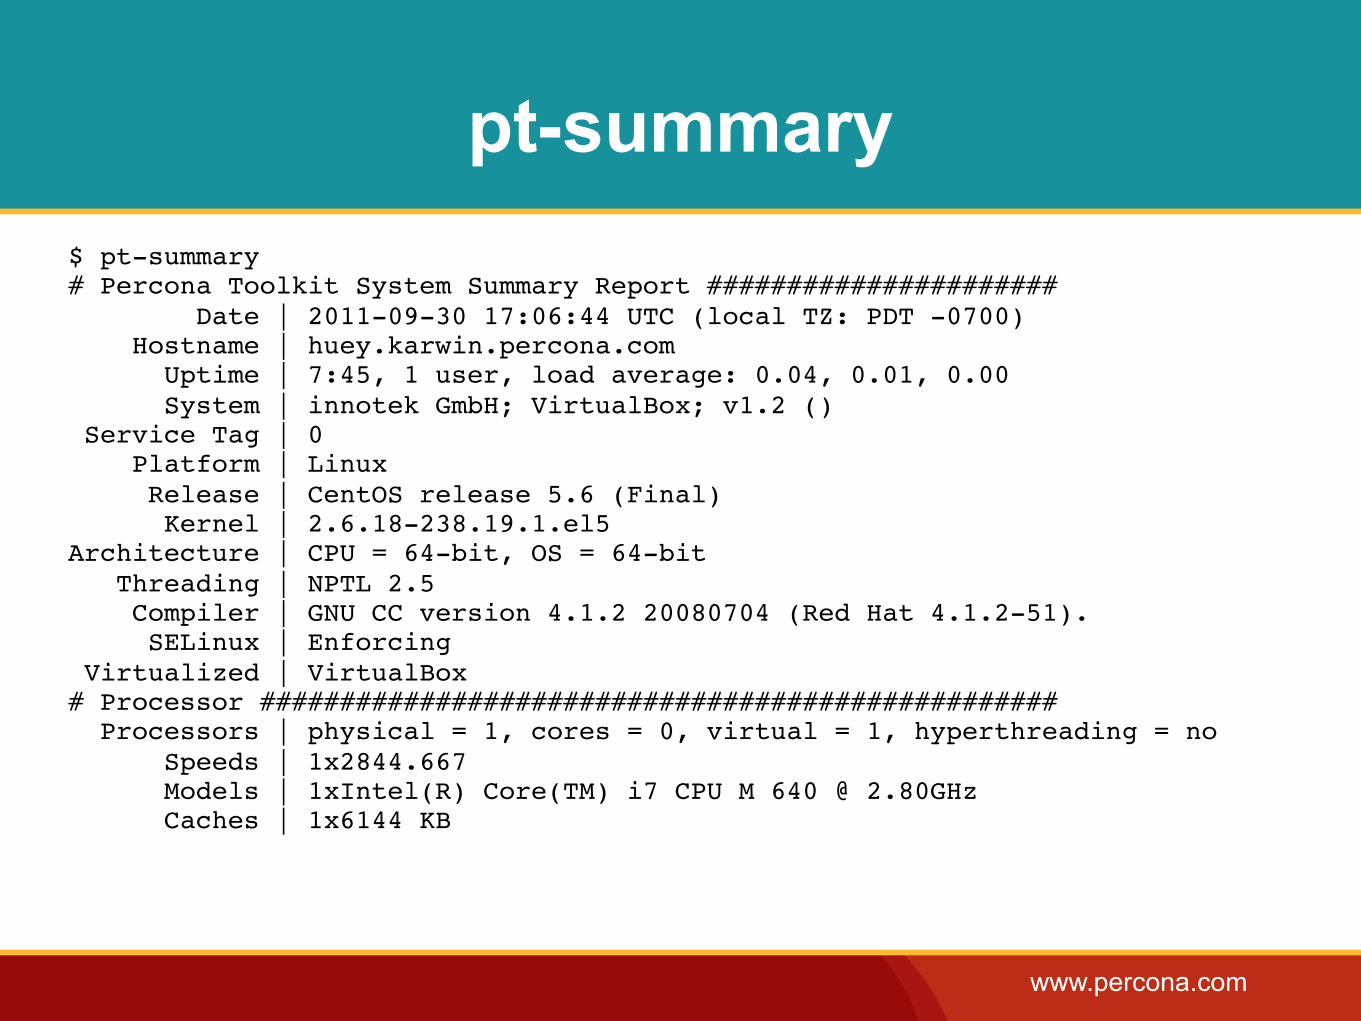
pt-summary$ pt-summary# Percona Toolkit System Summary Report ###################### Date | 2011-09-30 17:06:44 UTC (local TZ: PDT -0700) Hostname | huey.karwin.percona.com Uptime | 7:45, 1 user, load average: 0.04, 0.01, 0.00 System | innotek GmbH; VirtualBox; v1.2 () Service Tag | 0 Platform | Linux Release | CentOS release 5.6 (Final) Kernel | 2.6.18-238.19.1.el5Architecture | CPU = 64-bit, OS = 64-bit Threading | NPTL 2.5 Compiler | GNU CC version 4.1.2 20080704 (Red Hat 4.1.2-51). SELinux | Enforcing Virtualized | VirtualBox# Processor ################################################## Processors | physical = 1, cores = 0, virtual = 1, hyperthreading = no Speeds | 1x2844.667 Models | 1xIntel(R) Core(TM) i7 CPU M 640 @ 2.80GHz Caches | 1x6144 KB
www.percona.com
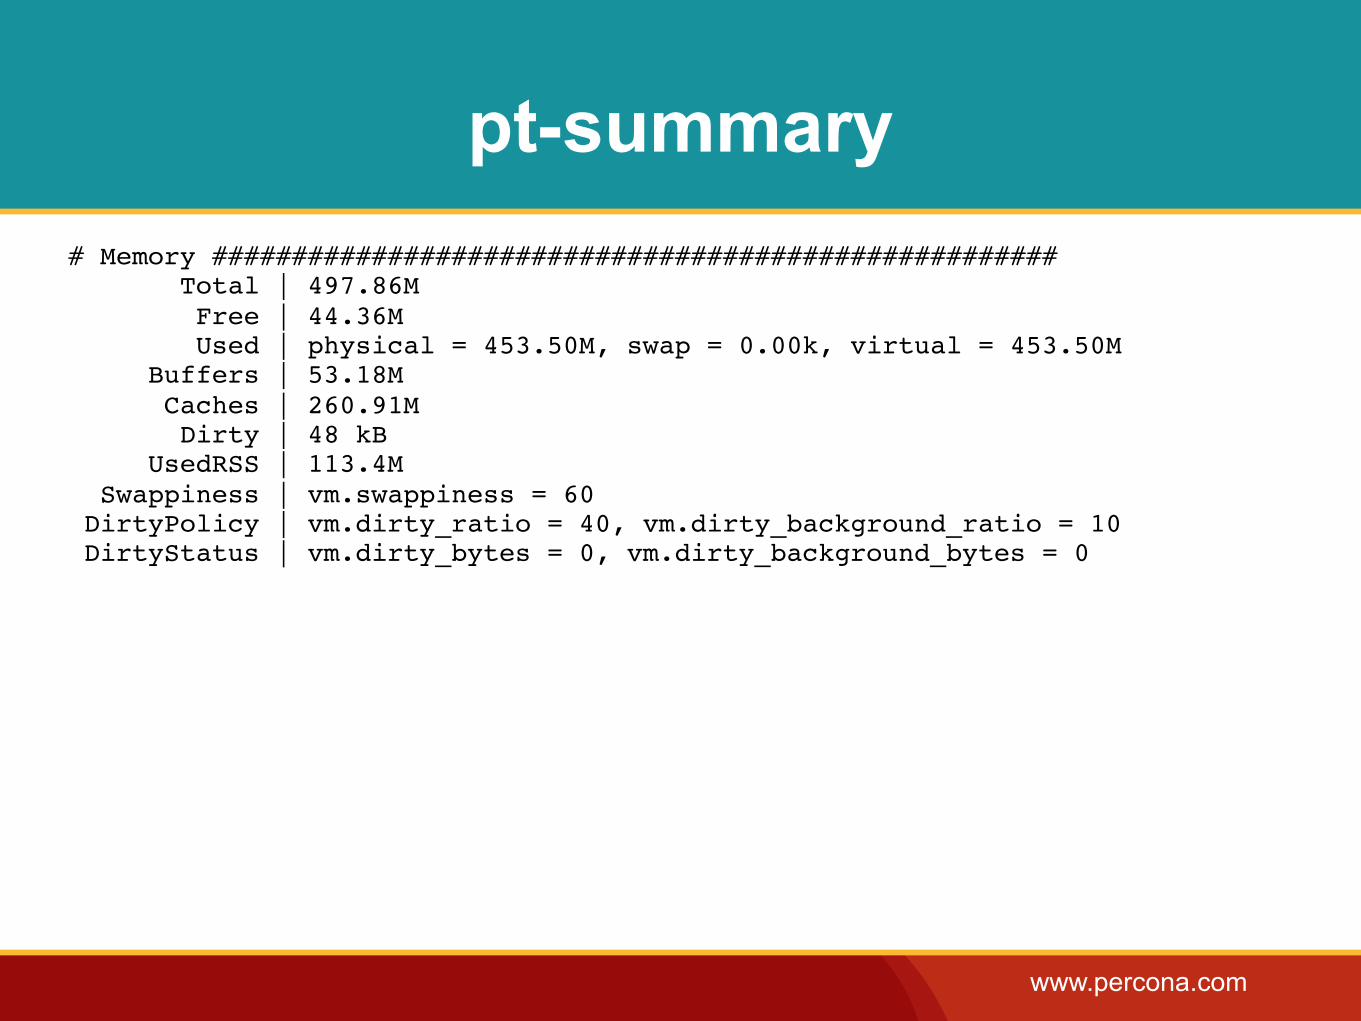
pt-summary# Memory ##################################################### Total | 497.86M Free | 44.36M Used | physical = 453.50M, swap = 0.00k, virtual = 453.50M Buffers | 53.18M Caches | 260.91M Dirty | 48 kB UsedRSS | 113.4M Swappiness | vm.swappiness = 60 DirtyPolicy | vm.dirty_ratio = 40, vm.dirty_background_ratio = 10 DirtyStatus | vm.dirty_bytes = 0, vm.dirty_background_bytes = 0
www.percona.com
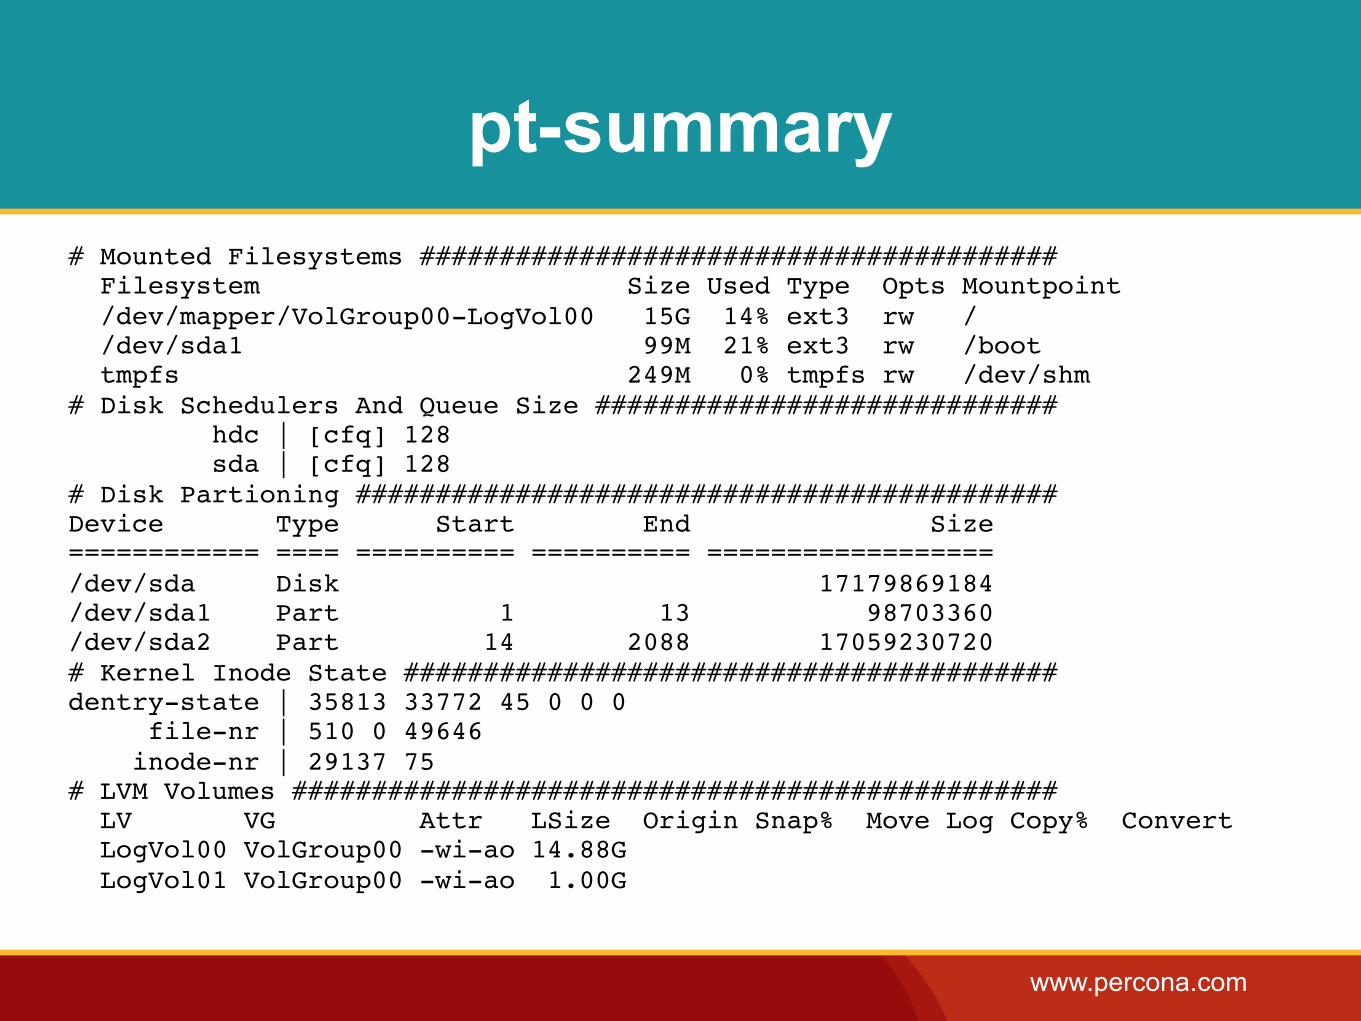
pt-summary# Mounted Filesystems ######################################## Filesystem Size Used Type Opts Mountpoint /dev/mapper/VolGroup00-LogVol00 15G 14% ext3 rw / /dev/sda1 99M 21% ext3 rw /boot tmpfs 249M 0% tmpfs rw /dev/shm# Disk Schedulers And Queue Size ############################# hdc | [cfq] 128 sda | [cfq] 128# Disk Partioning ############################################Device Type Start End Size============ ==== ========== ========== ==================/dev/sda Disk 17179869184/dev/sda1 Part 1 13 98703360/dev/sda2 Part 14 2088 17059230720# Kernel Inode State #########################################dentry-state | 35813 33772 45 0 0 0 file-nr | 510 0 49646 inode-nr | 29137 75# LVM Volumes ################################################ LV VG Attr LSize Origin Snap% Move Log Copy% Convert LogVol00 VolGroup00 -wi-ao 14.88G LogVol01 VolGroup00 -wi-ao 1.00G
www.percona.com
pt-summary# Network Config ############################################# Controller | Intel Corporation 82540EM Gigabit Ethernet Controller (rev 02) Controller | Intel Corporation 82540EM Gigabit Ethernet Controller (rev 02) FIN Timeout | net.ipv4.tcp_fin_timeout = 60 Port Range | net.ipv4.ip_local_port_range = 32768 61000# Interface Statistics ####################################### interface rx_bytes rx_packets rx_errors tx_bytes tx_packets tx_errors ========= ========= ========== ========== ========== ========== ========== lo 7000 60 0 7000 60 0 eth0 1250000 17500 0 3000000 15000 0 eth1 9000000 12500 0 600000 8000 0# Network Connections ######################################## Connections from remote IP addresses 192.168.56.1 1 Connections to local IP addresses 192.168.56.111 1 Connections to top 10 local ports 22 1 States of connections ESTABLISHED 1 LISTEN 5
www.percona.com
pt-summary# Top Processes ############################################## PID USER PR NI VIRT RES SHR S %CPU %MEM TIME+ COMMAND 1 root 15 0 10372 688 572 S 0.0 0.1 0:00.44 init 2 root RT -5 0 0 0 S 0.0 0.0 0:00.00 migration/0 3 root 34 19 0 0 0 S 0.0 0.0 0:00.20 ksoftirqd/0 4 root RT -5 0 0 0 S 0.0 0.0 0:00.03 watchdog/0 5 root 10 -5 0 0 0 S 0.0 0.0 0:07.58 events/0 6 root 10 -5 0 0 0 S 0.0 0.0 0:00.00 khelper 11 root 10 -5 0 0 0 S 0.0 0.0 0:00.00 kthread 15 root 10 -5 0 0 0 S 0.0 0.0 0:00.11 kblockd/0 16 root 20 -5 0 0 0 S 0.0 0.0 0:00.00 kacpid# Simplified and fuzzy rounded vmstat (wait please) ########## procs ---swap-- -----io---- ---system---- --------cpu-------- r b si so bi bo ir cs us sy il wa st 2 0 0 0 10 8 1000 30 0 3 97 0 0 0 0 0 0 0 0 1000 30 0 2 98 0 0 0 0 0 0 0 0 1000 30 0 4 96 0 0 0 0 0 0 0 0 1000 30 0 2 98 0 0 0 0 0 0 0 0 1000 35 0 2 98 0 0# The End ####################################################
www.percona.com
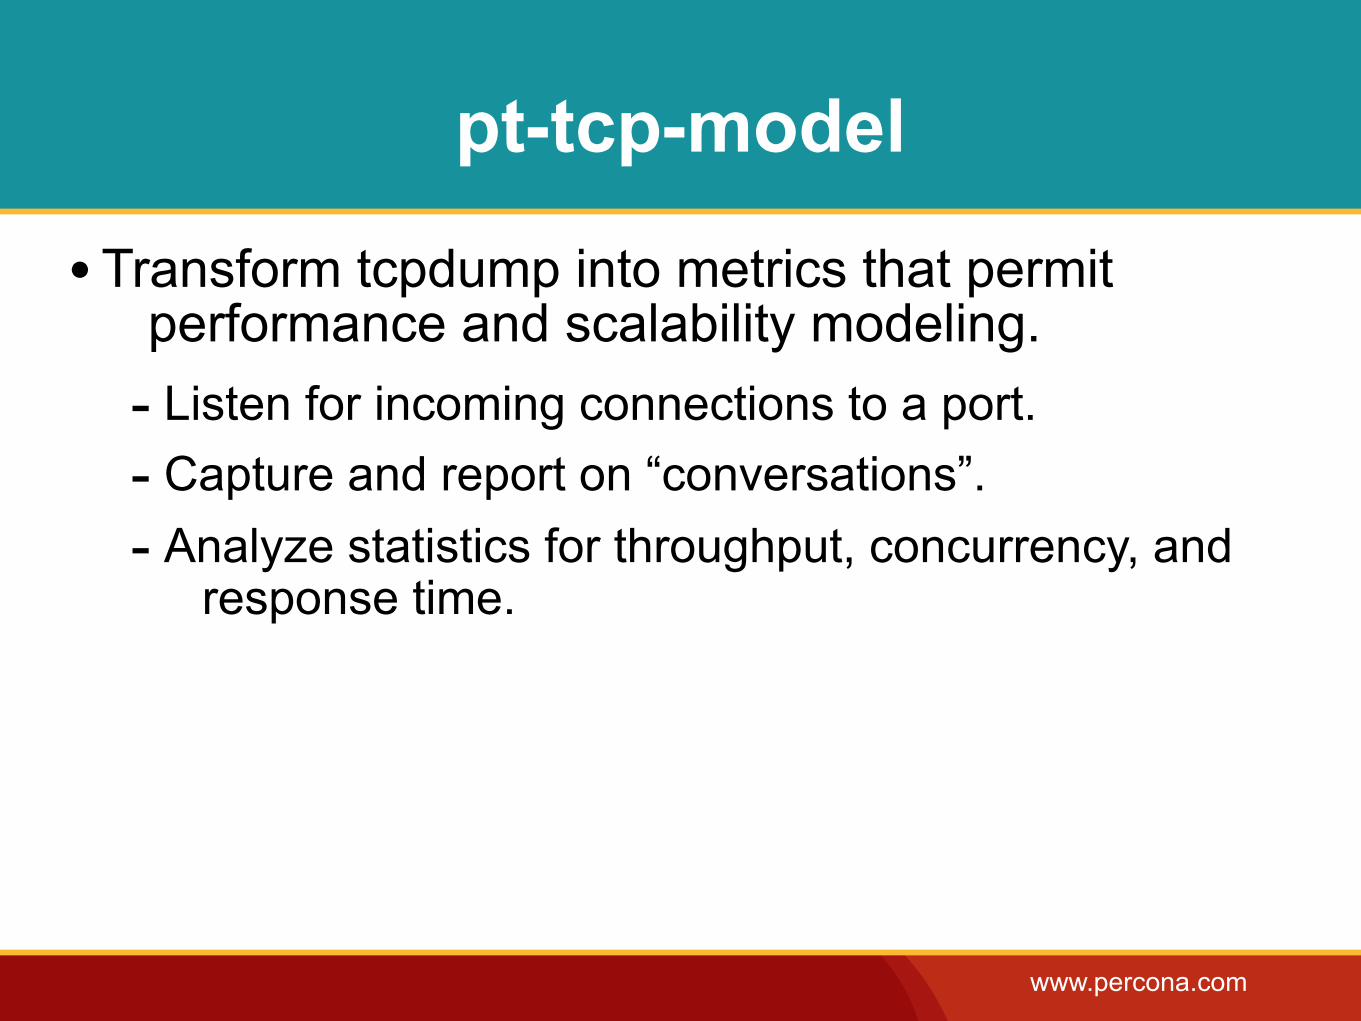
pt-tcp-model
• Transform tcpdump into metrics that permit performance and scalability modeling.
- Listen for incoming connections to a port.- Capture and report on “conversations”.- Analyze statistics for throughput, concurrency, and
response time.

www.percona.com
Utility Tools
‣pt-archiver
‣pt-find
‣pt-kill
‣pt-log-player
www.percona.com
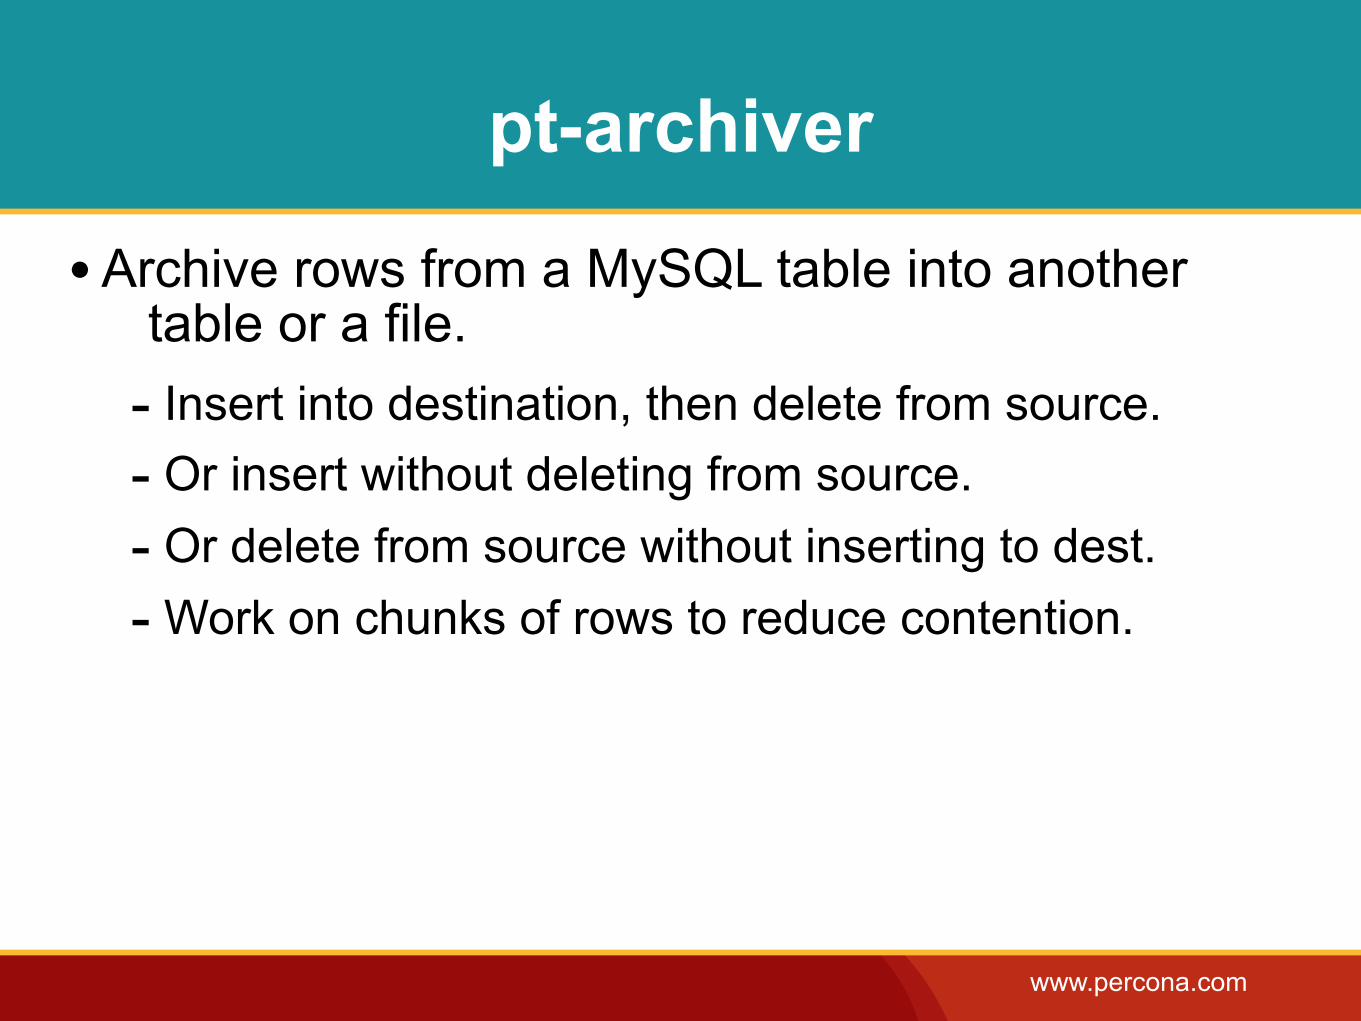
pt-archiver
•Archive rows from a MySQL table into another table or a file.
- Insert into destination, then delete from source.- Or insert without deleting from source.- Or delete from source without inserting to dest.- Work on chunks of rows to reduce contention.
www.percona.com
pt-find
• Find MySQL tables that match certain criteria,and execute actions on them.
- Like GNU find works on files.- So if you enjoy writing find commands,
then this will be great for you.
www.percona.com
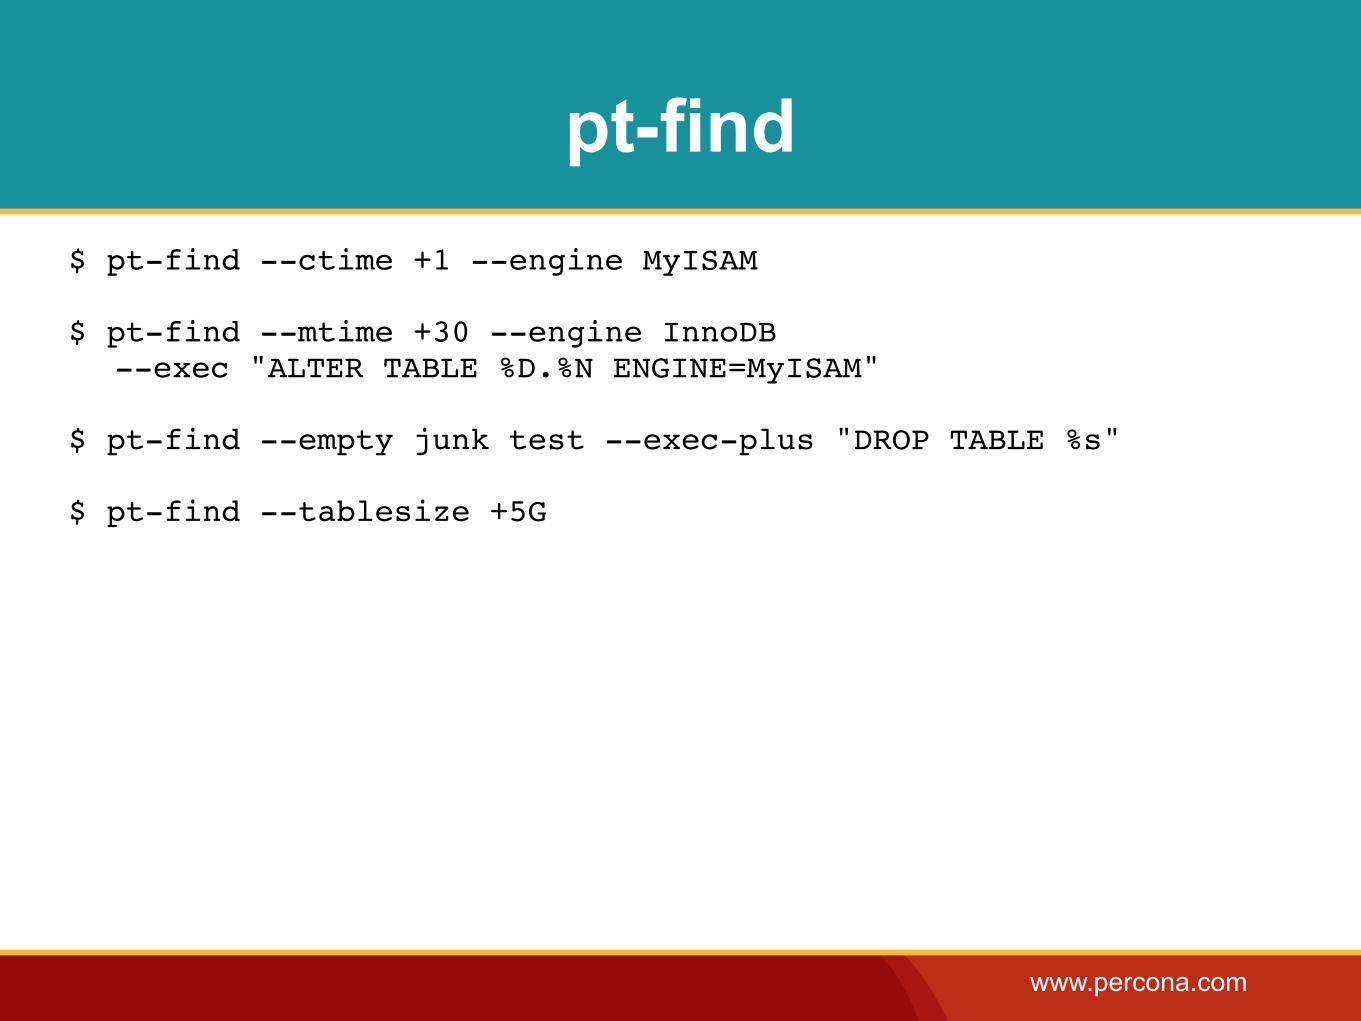
pt-find$ pt-find --ctime +1 --engine MyISAM
$ pt-find --mtime +30 --engine InnoDB --exec "ALTER TABLE %D.%N ENGINE=MyISAM"
$ pt-find --empty junk test --exec-plus "DROP TABLE %s"
$ pt-find --tablesize +5G
www.percona.com
pt-kill
• Find MySQL queries that match certain criteria, and kill them (or print them).
www.percona.com
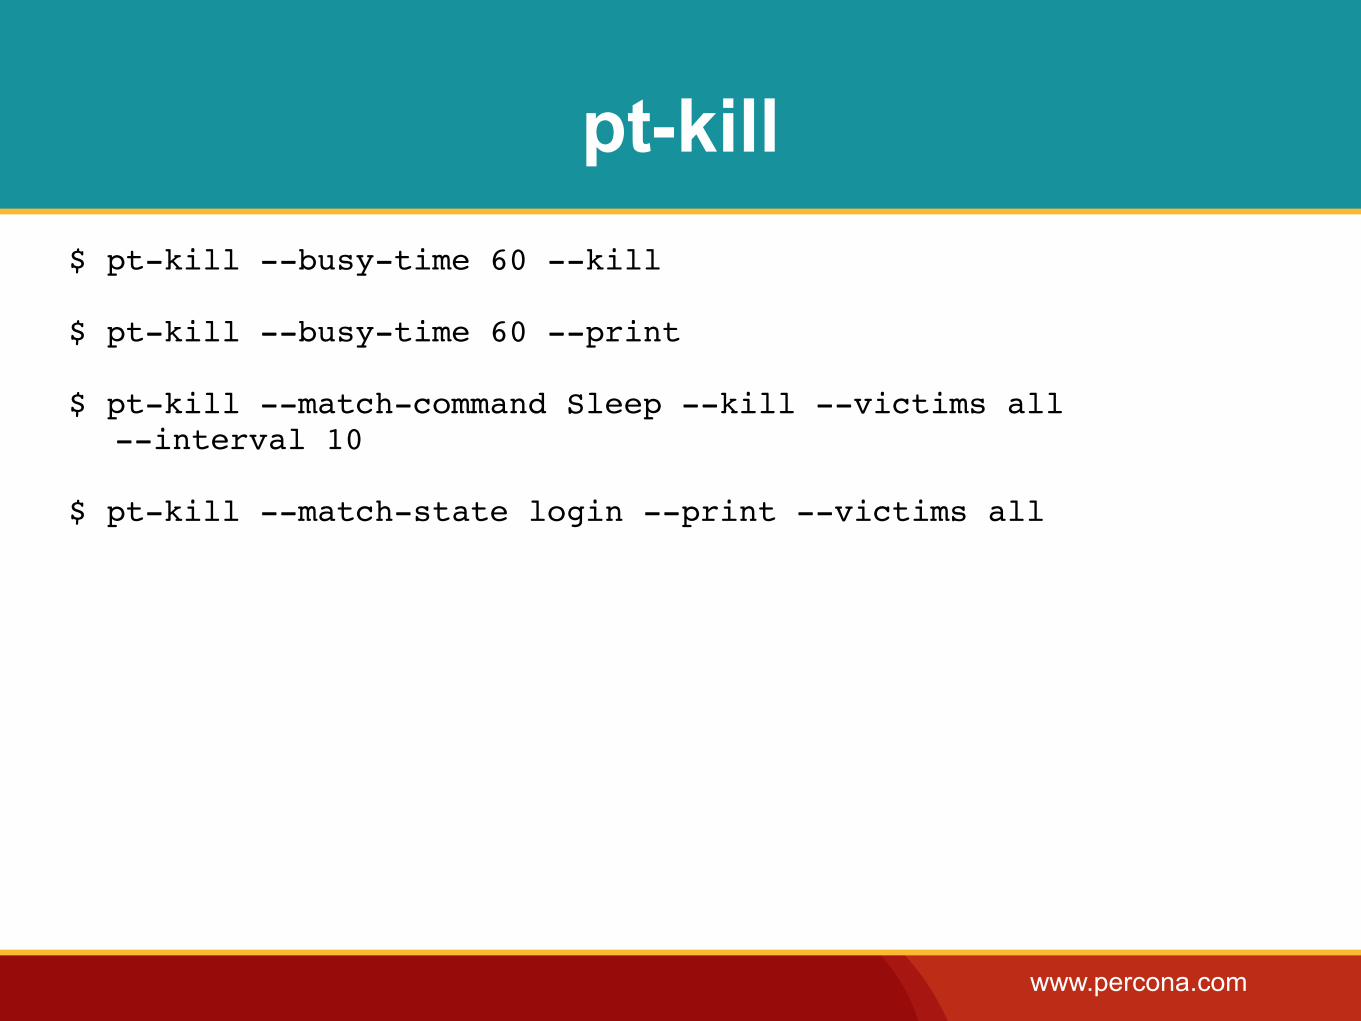
pt-kill$ pt-kill --busy-time 60 --kill
$ pt-kill --busy-time 60 --print
$ pt-kill --match-command Sleep --kill --victims all --interval 10
$ pt-kill --match-state login --print --victims all
www.percona.com
pt-log-player
•Replay MySQL query logs.- Useful to warm the buffer pool based on a natural
sampling of queries.

www.percona.com
That’s All (for today)pt-archiver
pt-collect
pt-config-diff
pt-deadlock-logger
pt-diskstats
pt-duplicate-key-checker
pt-fifo-split
pt-find
pt-fk-error-logger
pt-heartbeat
pt-index-usage
pt-kill
pt-log-player
pt-mext
pt-mysql-summary
pt-online-schema-change
pt-pmp
pt-query-advisor
pt-query-digest
pt-show-grants
pt-sift
pt-slave-delay
pt-slave-find
pt-slave-restart
pt-stalk
pt-summary
pt-table-checksum
pt-table-sync
pt-tcp-model
pt-trend
pt-upgrade
pt-variable-advisor
pt-visual-explain

www.percona.com
Future Plans
•Roadmap- 2.0 series is the focus of current development
•Blueprints- https://blueprints.launchpad.net/percona-toolkit- redesign-pt-stalk: beta available- redesign-pt-table-checksum: beta available
•We’re hiring another developer:- http://www.percona.com/about-us/career/perl-and-shell-developer/

www.percona.com/live
Santa Clara, April 10-12, 2012

www.percona.com
SQL Antipatterns20% discount code: SQLSanFranMeetup
http://www.pragprog.com/titles/bksqla/