Embed Size (px)
DESCRIPTION
RoadFloodPH is a web and mobile application that provides the water level information of a flooded road in the Philippines through the use of a flood sensor, gsm module, SMS API, cloud web server, website and mobile application.
Citation preview
ROAD FLOOD SENSOR WITH WEB AND MOBILE APPLICATION SUPPORT
__________________
A
Design Project
Presented to the
Faculty of the Computer Engineering
Polytechnic University of the Philippines
Sta. Mesa, Manila
_________________
In Partial Fulfillment
of the Requirements for the Degree
Bachelor of Science in Computer Engineering
_________________
by
Remedios G. Ado
Johnver B. Bautista
Kim Carla B. Lleno
Katrina Hazel R. Malagday
Mark Anthony D. Muya
May 2014
ii
ACKNOWLEDGMENT
This project will never be successful without the guidance of the Lord, he who
never fails to do amazing things to the group. To God be all the glory!
The proponents would also like to express their sincerest gratitude to the
following people who accompanied us and nevertheless showed unending support
throughout the completion of this study:
To their parents, and other family members, for giving full support both moral
and financial. Them who continuously push us to achieve greater heights;
Engr. Remedios G. Ado and Engr. Ronald D. Fernando, for their full effort,
support, and guidance as thesis advisers;
To their classmates and friends, for the encouragement especially when times
get though and barely bearable;
To all those who have helped directly or indirectly whose names were not
mentioned, the researchers wish to extend their gratitude and appreciation.
iii
ABSTRACT
Researchers created a prototype that senses water level on a flooded road, and make its
data available over the Internet through the use of web and mobile application, plus
SMS based service. Using ultrasonic sensor, proponents created their own flood level
sensing device which is attached to gizDuino™ (e-Gizmo Mechatronix Central version
of Arduino™, an open source computing platform based on simple input/output board
and the use of standard programming language) to process the sensor’s analog signal
into a usable digital value of distance. Flood height is determined by subtracting the
sensor’s height with respect to the floor minus the sensed distance between the sensor
and the flood water. The derived data from signal analysis is passed to the web server
through the use of GSM/GPRS shield and the Globe Labs API (Application
Programming Interface). Globe Labs API serves as the intermediary application to
deliver SMS messages to SMS subscribers. Flood level data gathered by the prototype
will be presented to the users through the web and mobile application that requires
Internet connection. By subscribing to RoadFloodPH SMS, users could also get real-
time information on monitoring flooded areas even without Internet connection. The
Road Flood Sensor is developed to monitor flood that will help motorists and
pedestrians on the road.
KEY WORDS: Road Flood Sensor, RoadFloodPH, ultrasonic sensor, gizDuino, SMS
based service, flood level, road, flood, mobile, web
iv
TABLE OF CONTENTS
PAGE
TITLE PAGE…...………..……………………………………………………...... i
APPROVAL SHEET...…….……………………………………………………... ii
ACKNOWLEDGMENT…...……………………………………………...…….... iii
ABSTRACT...…………..……………………………………………………….... iv
TABLE OF CONTENTS…………………………………………………............ v
LIST OF FIGURES...…….………………………………………………............. viii
LIST OF TABLES….…………………………………………………………….. x
CHAPTER
I. THE PROBLEM AND ITS BACKGROUND
Introduction……………………………………………………….. 1
Background of the Study…...……………………………………... 2
Statement of the Problem…………………………………………. 3
Theoretical Framework……...……………………………………. 4
Conceptual Framework……...……………………………………. 6
Scopes and Limitations of the Study..…………………………….. 7
Significance of the Study………………………………………….. 9
Definition of Terms.....……………………………………………. 10
v
II. REVIEW OF RELATED LITERATURES AND STUDIES
Foreign Literatures…..………………………………………….... 12
Local Literatures…..…....……………………………………….... 15
Foreign Studies.……..……………………………………………. 26
Local Studies..…………………………………………………….. 29
Synthesis of the Study.……………………………………………. 30
III. RESEARCH METHODOLOGY
Methods of Research ......…............................................................ 33
Sources of Data ……...………………………………………….... 33
Data Gathering Instrument…..……………………………………. 34
Data Gathering Procedures……………………………………...... 35
Statistical Treatment of Data.……………………………………... 36
IV. PRESENTATION AND ANALYSIS OF DATA
Components of the Proposed System……….……………………. 41
Functionality Testing……………………………………………... 54
Block Diagram….……...……………………………………......... 57
Flow Chart….…...……………………………………………..…. 59
Source Code………………………………………………………. 62
Schematic Diagram and Component Analysis……………………. 63
Survey Results ....…………………………………………………. 65
Cost and Benefit Analysis………………………………………… 68
Screenshots ....…………………….....……………………………. 70
vi
V. SUMMARY, CONCLUSIONS, AND RECOMMENDATIONS
Summary…….……………………………………......................... 75
Conclusion…..…………………………………………………..... 76
Recommendation………………………………………………..... 77
BIBLIOGRAPHY……………………………………………………………….... 78
APPENDICES…………………………………………………………………….. 82
Appendix A: Survey Questionnaire ........................................................................ 83
Appendix B: User’s Manual .................................................................................... 85
Appendix C: Materials and Cost .............................................................................. 88
Appendix D: Conformity Sheet ............................................................................... 90
Appendix E: Copyright Forms ................................................................................. 92
Appendix F: Patent Forms ....................................................................................... 95
Appendix G: Resume ............................................................................................... 101
vii
LIST OF FIGURES
FIGURE PAGE
1. Conceptual Framework of the Road Flood Sensor ....…...………………….…. 6
2. Risk / Hazard / Vulnerability Map of Barangay 628 Zone 63…...,………….... 16
3. DOST Water Level Monitoring System Project for EFCOS …..……………... 21
4. Early Warning and Monitoring System ……………..…....…………………… 22
5. Information Dissemination Scheme of Flood Warnings ……………………..... 23
6. Rainfall Advisory codes from DOST-PAGASA …………………...…………. 24
7. MMDA Flood Level Indicator ………………….......................………………. 24
8. The MMDA Flood Gauge ……………………......................................………. 25
9. Classification of Vehicles ……….…………………..........................…………. 25
10. Initial Sketch of Prototype ............……………………………………………. 37
11. Sample Placement of Prototype on Sidewalk ……...………………........……. 37
12. Network and Transmission Model …………………............…………………. 38
13. Data transmission to Users ….……………………………................................ 39
14. Initial Design for Mobile Application named “RoadFloodPH” ….…................ 40
15. Initial Design for Web Application named “RoadFloodPH” ............................. 40
16. Actual placement of the components in the casing ….………........................... 44
17. Individual Circuit Flow Testing …..............................………........................... 54
18. Sample placing of flood sensor on a post ….……….......................................... 55
19. Block Diagram for Charging Circuit Board ….………...................................... 57
20. Block Diagram for Road Flood Water Level Sensing System ….….................. 58
21. Flow Chart of the Web-based SIM Number Authentication Program ............... 59
viii
22. Arduino Code Workflow ….……………...………………................................ 60
23. SMS Authentication & Subscription Process for Unit Subscribers Workflow .. 61
24. SMS Authentication & Subscription Process for RF Unit SIM Workflow ........ 61
25. Web and Mobile Application Data Display Flow Chart ….……….................... 62
26. Schematic Diagram of Charging Circuit Board ….……………......................... 67
27. Initial Page ….……………...…………......................……................................ 70
28. Admin Login …....................……………...………………................................ 70
29. Dashboard (Daily) ….……………...………...........………................................ 71
30. Locations Page ….……………...……………................…................................ 71
31. Reference Page ….……………...………………................................................ 72
32. Unit Registration Page ….……………...………………..................................... 72
33. Unit Information Update ….……………...……………..…................................ 73
34. Screenshots of the Initial Page, View Flood ….……………...…........................ 73
35. Screenshots of the View Flood – MMDA Gauge, Reference ….……………..... 74
36. Screenshots of the Social, Emergency, and About Us pages …........................... 74
ix
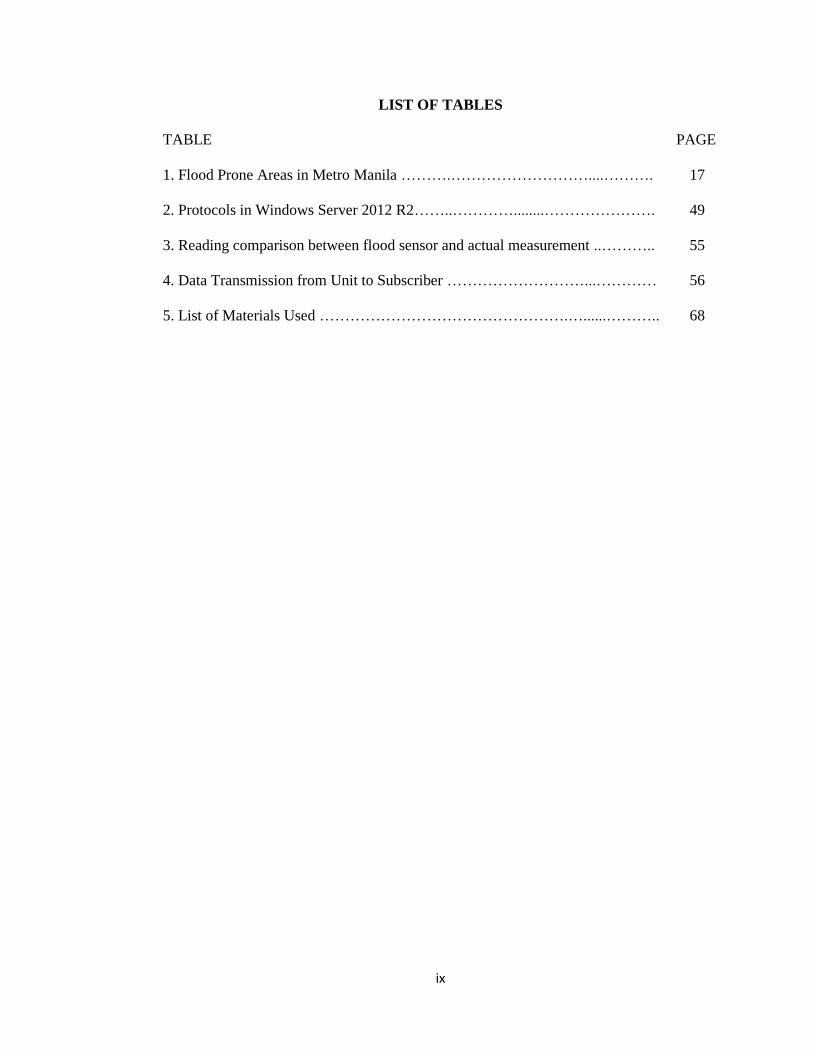
LIST OF TABLES
TABLE PAGE
1. Flood Prone Areas in Metro Manila ……….………………………....………. 17
2. Protocols in Windows Server 2012 R2……..…………........…………………. 49
3. Reading comparison between flood sensor and actual measurement ..……….. 55
4. Data Transmission from Unit to Subscriber ………………………...………… 56
5. List of Materials Used ………………………………………….…......……….. 68
Chapter 1
THE PROBLEM AND ITS BACKGROUND
This chapter will discuss the general concept of the design project entitled “Road
Flood Sensor with Web and Mobile Application Support.” Included in details are the
Introduction, Background of the Study, Statement of the Problem, Theoretical and
Conceptual Framework, Scopes and Limitations and the Significance of the study.
Introduction
In the 2011 Habagat incident, Christopher Lao and his cry “I should have been
informed” became a viral hit on the Internet when he attempted to drive his car on a
flooded part in Quezon City. The incident arises mixed views: other half saying he
should have been able to recognize that he shouldn’t try to drive through the flooded
road while the other half claiming that locals aren’t being given enough information.
Flooded roads have been a problem in Metro Manila for years, causing heavy
flow of traffic. Commuters getting stuck, and motorists getting lost on finding alternate
routes just to go to their destinations have become repetitive during rainy seasons. Time,
effort, and money are wasted when these incidents occur.
Though the government has been extending their efforts to inform the
commuters regarding the situation in flooded areas during rainy seasons, still the
dissemination of information to the locals are not enough.
2
Background of the Study
President Benigno Aquino III stated in his 2013 State of the Nation Address that
the Philippine economy loses an estimated 2.4 billion pesos every day because of Metro
Manila traffic. And this number even goes up whenever motorists get stuck during the
wet season. During rainy seasons, local commuters in Metro Manila have been
expecting to encounter one or two flooded roads along the way. But still, motorists get
stuck on their way for they are not able to get real time information on the situation of
the flooded areas.
Since the boom of the social media, the Metro Manila Development Authority
(MMDA) found ways other than news on the radio and television on how to reach out
to the commuters. This government institution used social media accounts in Facebook
and Twitter to inform motorists about the traffic condition in Metro Manila. This is very
helpful to the locals who always have their smartphones on the go.
According to a survey conducted by Taylor Nelson Sofres, a marketing research
firm, 53 percent of smartphone users in the Philippines comes from Metro Manila.
Among the cities in the country’s capital, Makati City has a large number of smartphone
users considering the fact that it is the business capital of the Philippines.
According to Hossain and Davis, flooding is considered to be one of the most
catastrophic forms of natural disaster. They also added that the adverse effect of
flooding is recognized when it disrupts the road transportation system of a country since
it is considered as a country’s socio-economic lifeline.
3
Metro Manila Development Authority uses different methods in detecting flood
levels in certain roads to inform the commuters. The use of closed-circuit television
(CCTV) cameras and flood height pole indicators are one of the few.
Despite maximizing the use of the Internet and social media, information from
the MMDA are only limited to the current situations on the major roads in Metro Manila.
This work will present a design project that will help provide sufficient real-time
information on the current flood condition on a chosen flood prone area. This project
will also help in facilitating the dissemination of information to the people.
Statement of the Problem
Informing locals about flooded roads during rainy seasons have been a problem
in Metro Manila for years. And to help solve this problem, the design project aims to
develop “Road Flood Sensor with Web and Mobile Application Support.”
Specifically, this study aims to answer the following questions:
1. How can the design project help the locals measure flood height on roads?
2. What mobile and web application can help commuters be informed about
passable and unpassable roads due to flood?
3. How can the design project help the dissemination of information on an
impassable road and its height to the locals during rainy season?
4
Theoretical Framework
Using ultrasonic sensors, proponents can create their own flood level sensing
device which will then be attached to gizDuino™ (e-Gizmo Mechatronix Central
version of Arduino™, an open source computing platform based on simple input/output
board and the use of standard programming language) to process the sensor’s signal into
a usable data input. The derived data from sensor’s signal will be passed to the web
server through the use of GSM/GPRS shield. GSM/GPRS shield is used to establish
communication between a computer and a GSM-GPRS system. Global System for
Mobile communication (GSM) is an architecture used for mobile communication in the
Philippines. GSM requires a Subscriber Identity Module (SIM) card just like mobile
phones to activate communication with the network. It also has International Mobile
Equipment Identity (IMEI) number similar to mobile phones for identification. The
GSM/GPRS shield can send, receive, and delete Short Message Service (SMS)
messages in a SIM. The SIM’s network that we are going to use will be based on signal
strength on the desired testing location.
The microcontroller (gizDuino™ and GSM/GPRS shield) requires finite power
supply to make it work on its stable and functional state. Unstable power supply may
cause the units interrupted, malfunction, or damaged. gizDuino™ needs a power input
of 5 volts or within the range of 5 to 12 volts with an ampere rate of 500 milli-Amperes.
While the GSM/GPRS shield requires a power input of 5 volts or within the range of 5
to 7.5 volts with an ampere rate of 1.5 Amperes. The operating temperature of the
5
SIM900D (ultra-compact and reliable wireless module embedded on GSM/GPRS
shield) ranges from -45 oC to +85 oC.
In the battery charging and power circuit that the proponents will be provided to
power the microcontroller, the circuit will use LM7809 and LM7805 Voltage Regulator
to derive a stable output voltage of 9 volts and 5 volts respectively with up to 1.5 Ampere
current output.
The ultrasonic sensor does have specifications too. The ultrasonic sonar module
requires a power input of 3 volts or within the range of 3 to 5 volts and an ampere rate
of 3.5 milli-Amperes. The sound produced by the sensor is in frequency of 40 kilo-
Hertz. The sensor’s range of detection is from 2 to 350 centimeters (3.5 meters).
In order to disseminate information detected by the prototype, proponents will
develop a web and mobile application. The web platform will be developed using
Hypertext Mark-up Language 5 (HTML5), Cascading Style Sheet 3 (CSS3), and
JavaScript for the client-side programming while Laravel (a PHP Model-View-
Controller Framework) for the server-side scripting. For the mobile Android
application, Java (Android’s native system language) will be used for the development.
Web and database server will be the central computer that stores information
received from the sensors. This will also be the resource needed to view the information
via web browsers or mobile applications.
6
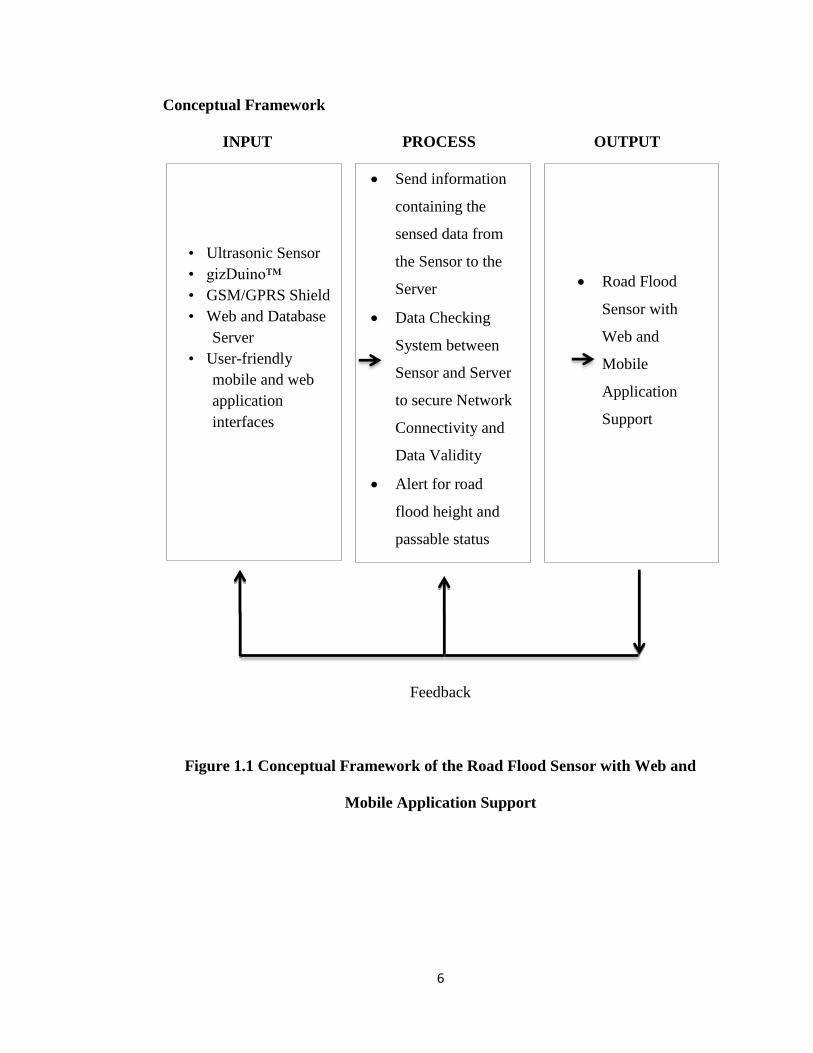
Conceptual Framework
INPUT PROCESS OUTPUT
Feedback
Figure 1.1 Conceptual Framework of the Road Flood Sensor with Web and
Mobile Application Support
• Ultrasonic Sensor
• gizDuino™
• GSM/GPRS Shield
• Web and Database
Server
• User-friendly
mobile and web
application
interfaces
Send information
containing the
sensed data from
the Sensor to the
Server
Data Checking
System between
Sensor and Server
to secure Network
Connectivity and
Data Validity
Alert for road
flood height and
passable status
Road Flood
Sensor with
Web and
Mobile
Application
Support

7
Figure 1.1 illustrates the general flow and structure for the path of this study.
The idea of having the Input-Process-Output system approach was used to describe the
conceptual framework of the study conducted. Based from the figure, the inputs
gathered through information from the specific contributors and software and hardware
requirements were listed to make the design project possible. Then, a process shall take
place. It shall analyze all the inputs provided and act accordingly. The output of the
research process involves a prototype that can sense the water level of flood on a
specified road, a mobile application for motorists and commuters regarding certain
impassable flooded areas, and a web application for web browser viewing in case of
incapability of installing the Android app or make it available for PC viewing and for
authorities to monitor and control what information would be given to the public. A
feedback provides a data which serves as a guide in making changes on the input or
processing activities, thus modifying the outputs for data integrity and helps to have a
better result for the enhancement of the research.
Scopes and Limitations of the Study
The design “Road Flood Sensor with Web and Mobile Application Support,” is
proposed to build a flood level sensor with mobile and web application support.
Conducting this project starts from June 2013 and ends on January 2014.
The device shall contain ultrasonic sensor to sense the water level of flood on
the road and GSM/GPRS shield as a means of communication protocol between the
device and web server. The unit containing the sensor will be placed to the intersection
8
of Anonas and Hippodromo streets for testing. The position of the sensor must be placed
perpendicular to the flood water, otherwise, there will be an imperfect reflection of
ultrasonic waves and cause measurement errors.
The sensor is suggested to be placed on a pole with a height of about 3 to 3.5
meters. The flood sensors and microcontrollers will be powered by a circuit that
converts Alternating Current (AC) to Direct Current (DC). This circuit will also have
the capability of charging a rechargeable battery. In case of AC power outage, the
circuit will automatically rely on the battery for the benefit of continuous operation of
water flood height detection and network data transmission. The back-up battery shall
last for 9 to 10 hours.
Every two inches difference of flood water height level detection through the
analysis of Gizduino will be automatically send the information to the server to have an
initial data to be saved on the server. The server will then request to resend the
information to verify the validity of data. If it is still the same information, then it will
be recorded to the database and ready for dissemination on web, mobile and cellular
phones.
There will also be a web and a mobile application available for the locals who
have their smart phones. The mobile and web application shall contain search fields and
pictorial representation about the metric level of water based on vehicle types and
human body. These applications could only be used with an Internet access. Updates
and notifications will also be automatically extended to Twitter and Facebook. The
design project will also incorporate SMS subscription to be able to inform cellular phone
users without Internet capabilities.
9
The unit needs to be registered using its unit name, SIM number, region where
it will be placed and whether it is for public or private viewing to the web interface for
the monitoring of the unit sensor.
Significance of the Study
This study may prove to be useful to the following groups of individuals.
Commuters. With the mobile application support and SMS advisory service,
notifications on impassable flooded road will be available. Thus, commuters can avoid
getting stuck along the way. It will help the commuters to save money, time, and effort.
Motorists. It would be hard for the motorists to have a long wait on the way due to the
impassability of the flooded road. The mobile and web applications will inform them
the status of the area and will show passable roads which they could take.
Local Government. Upon achieving the actual output of this innovation, it would be
easier for the authorities to monitor and disseminate information to the locals. Officials
could also provide other information or preventive measures to take during the rainy
season.
10
To the Future Researchers. This study about giving information about passable and
impassable roads may serve as a reference for future studies concerning the variables
mentioned. Researchers from different fields are encouraged to make use of the findings
as one of the sources for any related studies in the future.
Definition of Terms
The terms are defined according to their contextual and operational view of
this study.
RoadFloodPH – the name for both web and mobile application of this project study.
GSM Module – It is an electronic device that has capability of sending SMS (Short
Messaging System). GSM stands for “Global System for Mobile”. This will be the
device for communication between the sensing unit and the server (web and database)
with the help of the telecommunication network service.
Web Application – An application provided by the developers to access the flooded
and traffic information via a web browser. Administrative privileges are also present in
this platform.
Mobile Application – An application designed to show significant information about
the flooded areas and the corresponding alternate routes via mobile.
11
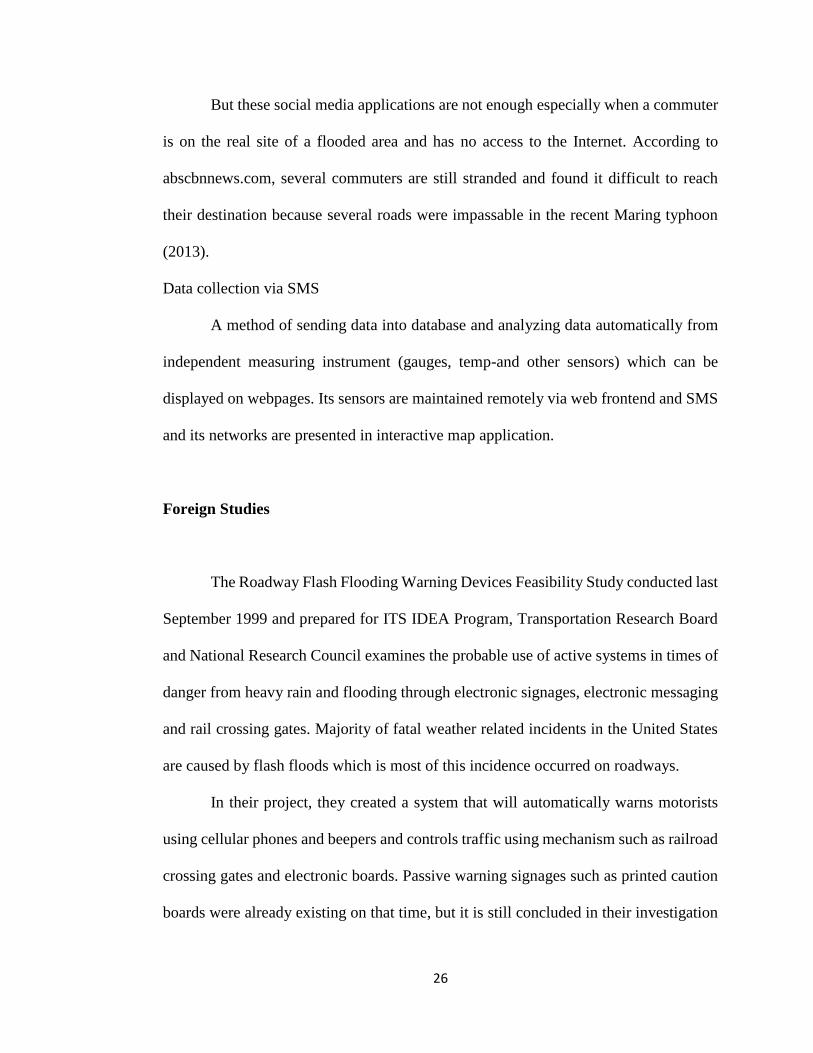
Light Vehicle – vehicle having 6,000 to 14, 000 lb weight. This includes cargo vans,
ambulances, small dump trucks and delivery trucks.
Medium Vehicle – vehicle having 14, 001 to 19, 500 lb weight. This includes small
city delivery trucks and mini buses.
Heavy Vehicle – vehicle having 19, 501 to 33, 000 lb weight. This includes tow trucks,
furniture vans, garbage trucks, medium tractor trailers, cement mixers, fire trucks, large
tour buses, and heavy tractor trailers.
Flood Meter – It is the name for the mobile and web application designed to give
current conditions on flooded roads.
JSON (JavaScript Object Notation) – is a subset of the object literal notation of
JavaScript
App/s – shortcut for application. It is a self-contained program or piece of software
designed to fulfill a particular purpose.
Chapter 2
REVIEW OF RELATED LITERATURES AND STUDIES
Foreign Literatures
The Flood
Flooding is a natural process that can happen at any time in a wide variety of
locations. Flooding from the sea and from rivers is probably best known but prolonged,
intense and localized rainfall can also cause sewer flooding, overland flow and
groundwater flooding according to The Planning System and Flood Risk Management
of Ireland. It is also said that flooding has significant impacts on human activities, it can
threaten people’s lives, their property and the environment. Assets at risk can include
housing, transport and public service infrastructure, and commercial, industrial and
agricultural enterprises. The health, social, economic and environmental impacts of
flooding can be significant and have a wide community impact.
According to the Office of Public Works of Ireland, these are the types of inland
flooding which is caused by prolonged and/or intense rainfall:
1. Overland flow occurs when the amount of rainfall exceeds the infiltration
capacity of the ground to absorb it. This excess water flows overland, ponding
in natural hollows and low-lying areas or behind obstructions. This occurs as a
rapid response to intense rainfall and eventually enters a piped or natural
drainage system.
13
2. River flooding occurs when the capacity of a watercourse is exceeded or the
channel is blocked or restricted, and excess water spills out from the channel
onto adjacent low-lying areas (the floodplain). This can occur rapidly in short
steep rivers or after some time and some distance from where the rain fell in
rivers with a gentler gradient.
3. Flooding from artificial drainage systems results when flow entering a system,
such as an urban storm water drainage system, exceeds its discharge capacity
and the system becomes blocked, and / or cannot discharge due to a high water
level in the receiving watercourse. This mostly occurs as a rapid response to
intense rainfall. Together with overland flow, it is often known as pluvial
flooding. Flooding arising from a lack of capacity in the urban drainage network
has become an important source of flood risk, as evidenced during recent
summers.
4. Groundwater flooding occurs when the level of water stored in the ground rises
as a result of prolonged rainfall to meet the ground surface and flows out over
it, i.e. when the capacity of this underground reservoir is exceeded. Groundwater
flooding tends to be very local and results from interactions of site-specific
factors such as tidal variations. While water level may rise slowly, it may be in
place for extended periods of time. Hence, such flooding may often result in
significant damage to property rather than be a potential risk to life.
5. Estuarial flooding may occur due to a combination of tidal and fluvial flows, i.e.
interaction between rivers and the sea, with tidal levels being dominant in most
cases. A combination of high flow in rivers and a high tide will prevent water
14
flowing out to sea tending to increase water levels inland, which may flood over
river banks.
Effects of Flood to Transportation
Flooding is considered to be one of the most catastrophic forms of natural
disaster. The adverse effect of flooding is recognized when it disrupts the road
transportation system of a country since it is considered as a country’s socio-economic
lifeline (Hossain and Davies, 2004). Road transportation is considered as an integral
part of a nation’s infrastructure since it is used to promote social and economic activities
more than any other form of transportation (Solway, 1999 & Bruton, 1995).
Based on ehow.com’s list on the negative effects of flooding, it is said that
flooding causes traffic problems by cutting off streets, collapsing overpasses and
bridges and causing traffic-light failures. Cars may stall and can even be carried off by
flood waters. Flood waters interrupt gas, electricity and water services and contaminates
the water supply. When transportation system is cut-off due to flooding, other services
like transporting food would not be possible and may create food shortage to the flooded
areas.
Studies indicate that about one foot of water will float approximately 1,500
pounds of vehicle. Combined with frequently fast currents, vehicles can be swept away
and their occupants placed in extreme danger of drowning either in their vehicles or
while trying to escape (Boselly, et al., 1999).
There are specific locations that flooding occurs. These locations are known to
highway agencies and to the local traveling public, but unknown to non-local road users.
In addition, even if the location is a known potential hazard, there is frequently no way
15
of knowing whether the condition is or is not at a given moment in time a hazard.
Motorists therefore enter a situation that they can’t determine is hazardous. Similarly, a
situation that doesn’t look hazardous and can cause the motorist to venture onward, only
to be trapped (Boselly, et al., 1999).
Local Literatures
Flooding in Metro Manila
One of the many reasons why flooding occurs in Metro Manila is because of
population and urbanization. Metro Manila has a population of 12 million and
counting. Urbanization, specifically urban sprawl is a manifestation of all these
millions living together and needing houses, buildings, roads, parking lots and
infrastructure. All these cover ground that used to be open and able to absorb much of
the storm water that fell on the metropolis (Alcazaren, 2013).
According to an article by Paulo Alcazaren of The Philippine Star, Manila is
flooded because it is not only low but it is sinking. Ground water extraction due to
deep wells is causing major areas of the metropolis to sink. The north section of
CAMANAVA and the southern cities from Pasay onwards have sunk from a foot to
over a meter and this has made those areas more vulnerable to floods and storm
surges. Scientists have pointed to the fact that this flattening has increased the reach of
storm surges from the seaside to as much as 20 kilometers inland. So we get it from
both ends in a perfect storm — from the mountains and from the sea. The ground is
16
also sinking due to the weight of all that concrete, buildings and infrastructure due to
urbanization.
Alcazaren also pointed out that it floods because we have less drainage than
before. Reports have it that we have lost almost half of our metropolitan esteros and
canals, Manila has only 20 kilometers of them now. Many have been lost to
development, disappearing without a trace. And the remaining esteros are now
populated with informal settlers, giving way to flood whenever heavy rains occur in
Metro Manila.
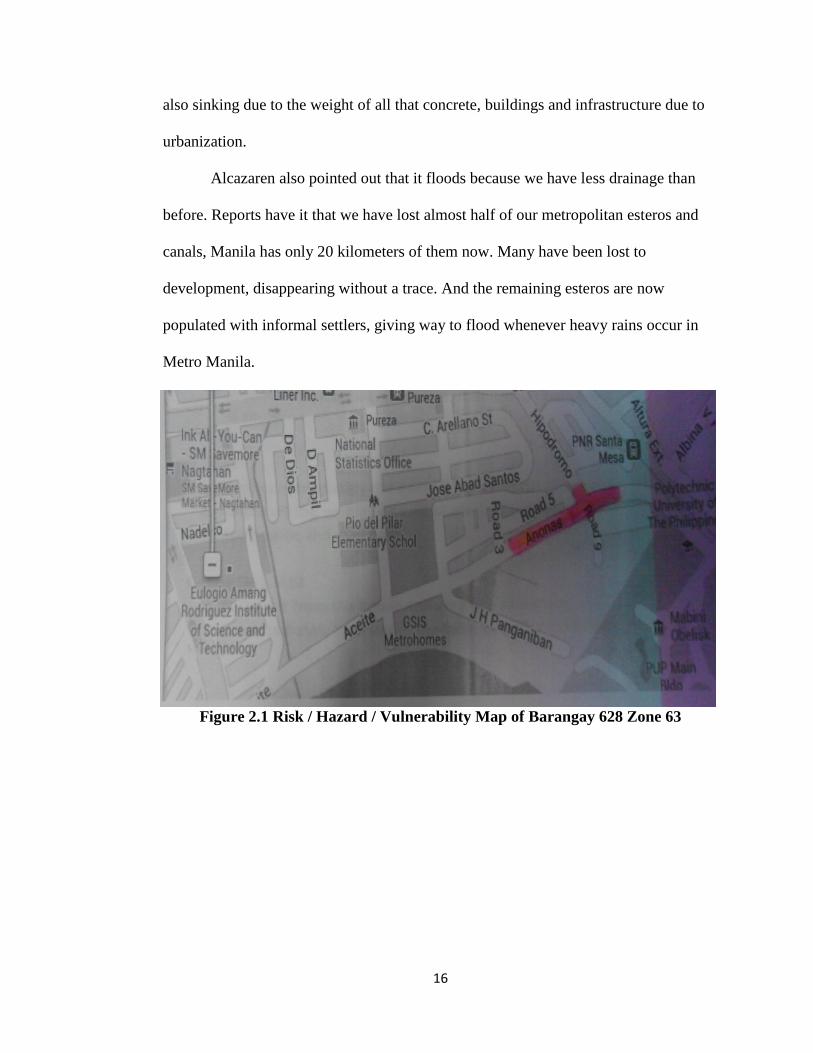
Figure 2.1 Risk / Hazard / Vulnerability Map of Barangay 628 Zone 63
17
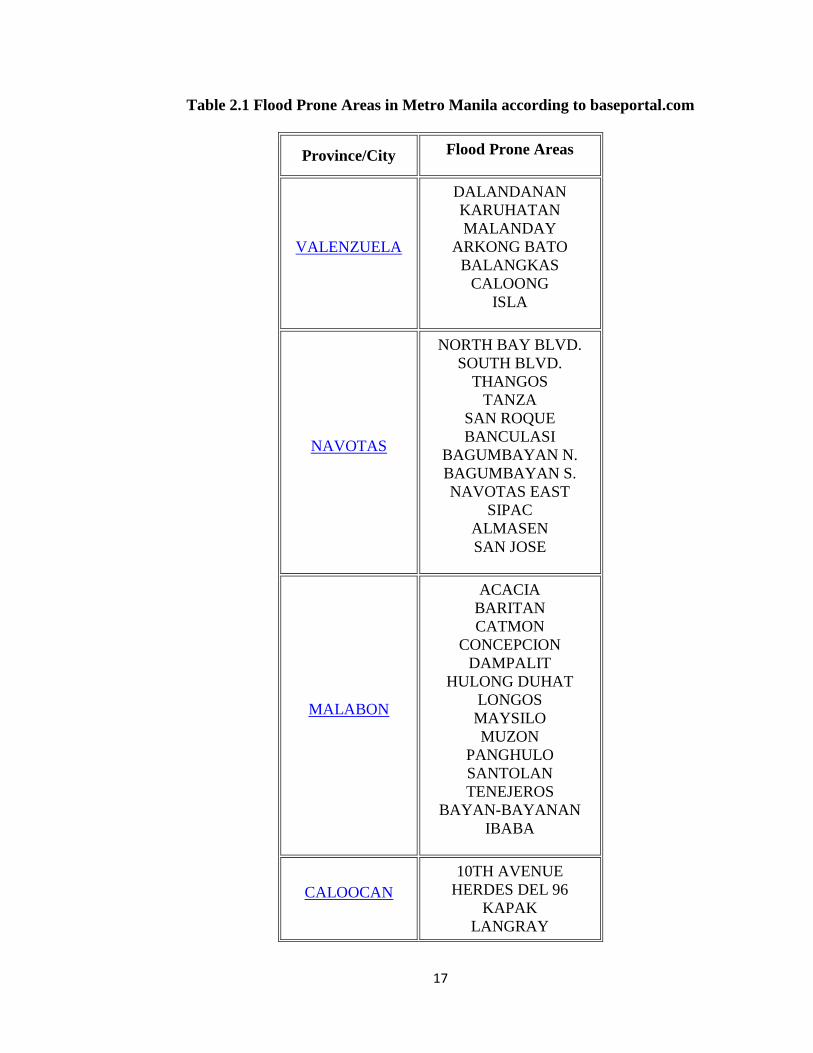
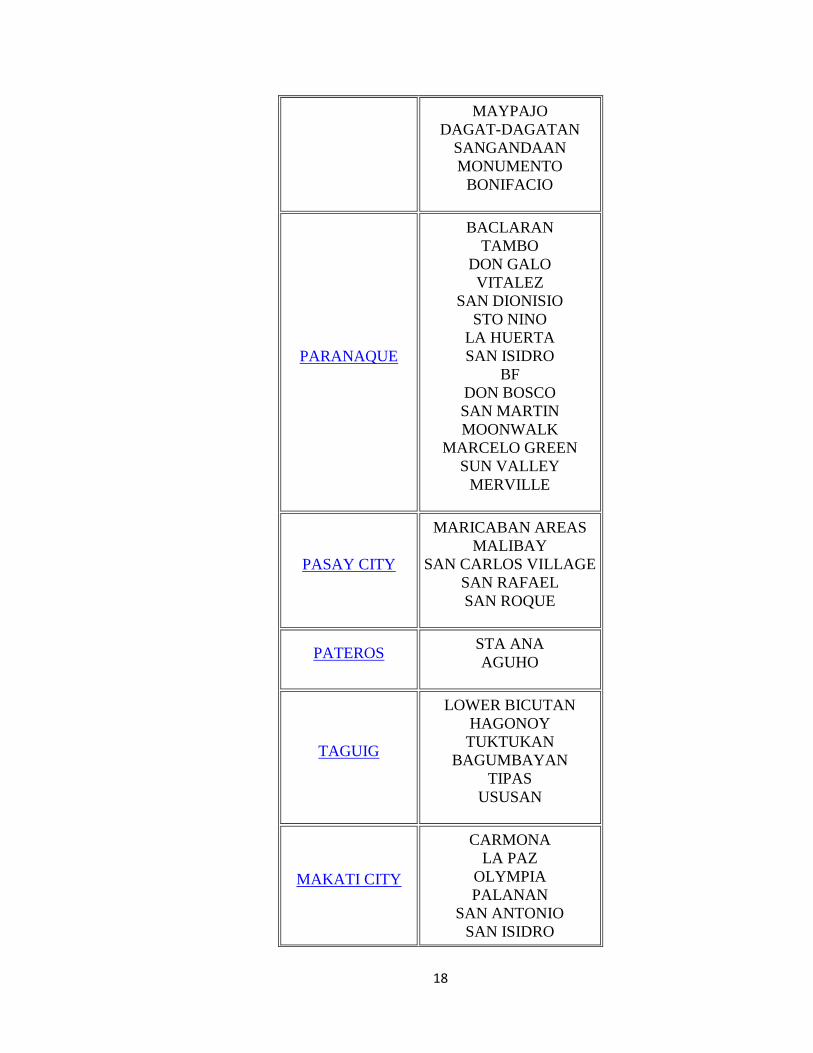
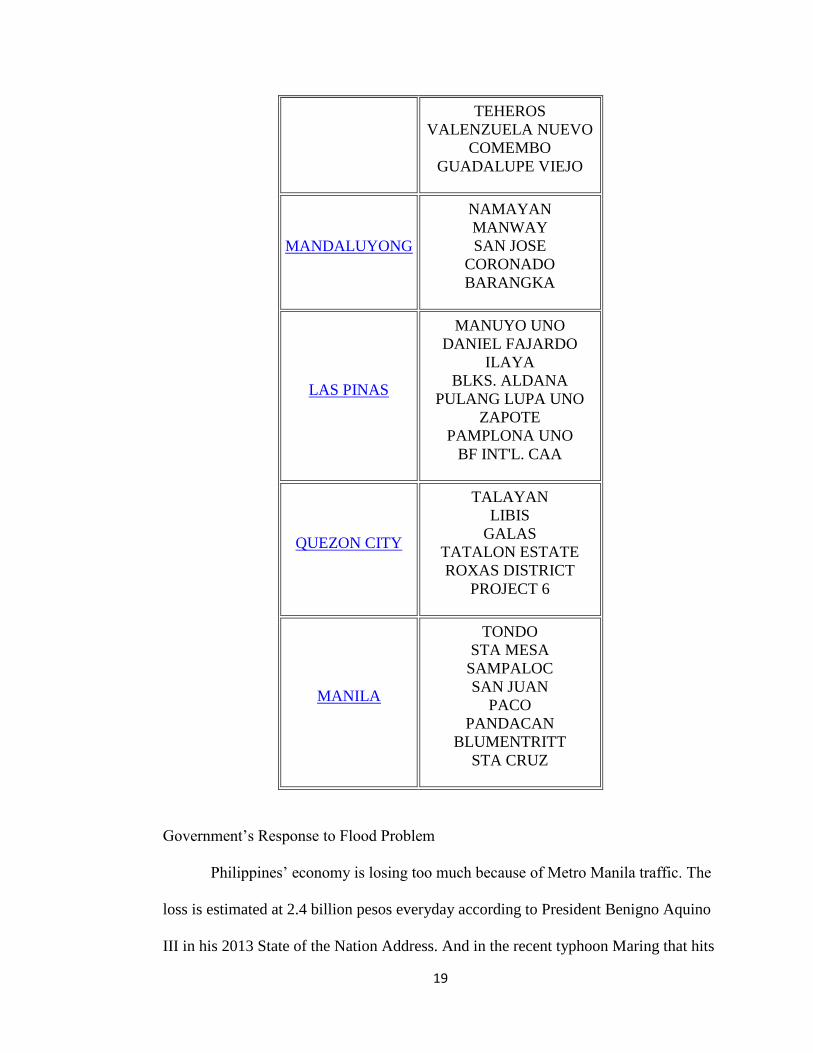
Table 2.1 Flood Prone Areas in Metro Manila according to baseportal.com
Province/City Flood Prone Areas
VALENZUELA
DALANDANAN
KARUHATAN
MALANDAY
ARKONG BATO
BALANGKAS
CALOONG
ISLA
NAVOTAS
NORTH BAY BLVD.
SOUTH BLVD.
THANGOS
TANZA
SAN ROQUE
BANCULASI
BAGUMBAYAN N.
BAGUMBAYAN S.
NAVOTAS EAST
SIPAC
ALMASEN
SAN JOSE
MALABON
ACACIA
BARITAN
CATMON
CONCEPCION
DAMPALIT
HULONG DUHAT
LONGOS
MAYSILO
MUZON
PANGHULO
SANTOLAN
TENEJEROS
BAYAN-BAYANAN
IBABA
CALOOCAN
10TH AVENUE
HERDES DEL 96
KAPAK
LANGRAY
18
MAYPAJO
DAGAT-DAGATAN
SANGANDAAN
MONUMENTO
BONIFACIO
PARANAQUE
BACLARAN
TAMBO
DON GALO
VITALEZ
SAN DIONISIO
STO NINO
LA HUERTA
SAN ISIDRO
BF
DON BOSCO
SAN MARTIN
MOONWALK
MARCELO GREEN
SUN VALLEY
MERVILLE
PASAY CITY
MARICABAN AREAS
MALIBAY
SAN CARLOS VILLAGE
SAN RAFAEL
SAN ROQUE
PATEROS
STA ANA
AGUHO
TAGUIG
LOWER BICUTAN
HAGONOY
TUKTUKAN
BAGUMBAYAN
TIPAS
USUSAN
MAKATI CITY
CARMONA
LA PAZ
OLYMPIA
PALANAN
SAN ANTONIO
SAN ISIDRO
19
TEHEROS
VALENZUELA NUEVO
COMEMBO
GUADALUPE VIEJO
MANDALUYONG
NAMAYAN
MANWAY
SAN JOSE
CORONADO
BARANGKA
LAS PINAS
MANUYO UNO
DANIEL FAJARDO
ILAYA
BLKS. ALDANA
PULANG LUPA UNO
ZAPOTE
PAMPLONA UNO
BF INT'L. CAA
QUEZON CITY
TALAYAN
LIBIS
GALAS
TATALON ESTATE
ROXAS DISTRICT
PROJECT 6
MANILA
TONDO
STA MESA
SAMPALOC
SAN JUAN
PACO
PANDACAN
BLUMENTRITT
STA CRUZ
Government’s Response to Flood Problem
Philippines’ economy is losing too much because of Metro Manila traffic. The
loss is estimated at 2.4 billion pesos everyday according to President Benigno Aquino
III in his 2013 State of the Nation Address. And in the recent typhoon Maring that hits
20
the country, the damage is pegged at 67 million pesos (ph.news.yahoo.com, 2013).
Because of these tremendous loses, the government increased the allocated budget for
weather forecasting.
With PAGASA’s new equipment, (wind profiler, Doppler radar, and
supercomputer), weather forecasting has been more accurate than before. It now has
Rainfall Warning System and the codes are easier to disseminate and understand
(Castillo, 2013). All of these are part of DOST’s Project NOAH as a response to the
call of President Benigno S. Aquino III for more accurate, integrated, and responsive
disaster prevention and mitigation system. Real-time weather forecasting is now
accessible through this project. Officials can now quickly announce school and work
suspension because of these information from PAGASA.
Also, DOST had accomplished 26% completion rate on June 2012 of their
deployment of 50 water level flood monitoring stations inside and out of Metro Manila
that monitors flood height levels on Marikina-Pasig River for their EFCOS Restoration
and Rehabilitation Initiative. The water level monitoring apparatus of the project are
equipped of solar panel, ultrasonic sensor, GSM, EFCOS Rain Gauge, Data Logger,
Server, and web visualizations (geographical via Google Maps, graphical, and tabular
views). This project has the following features: water level sensor, real-time data
collection (10-minute data collection via cellular network through SMS or text
messaging and Central Server/Back-up System), flood forecasting model and online
data visualization for decision support. This project was able to develop a system which
make use of the ultrasonic sensor device to accurately measure and determine the rate
of change of flood water level using the principle same to radar and sonar through
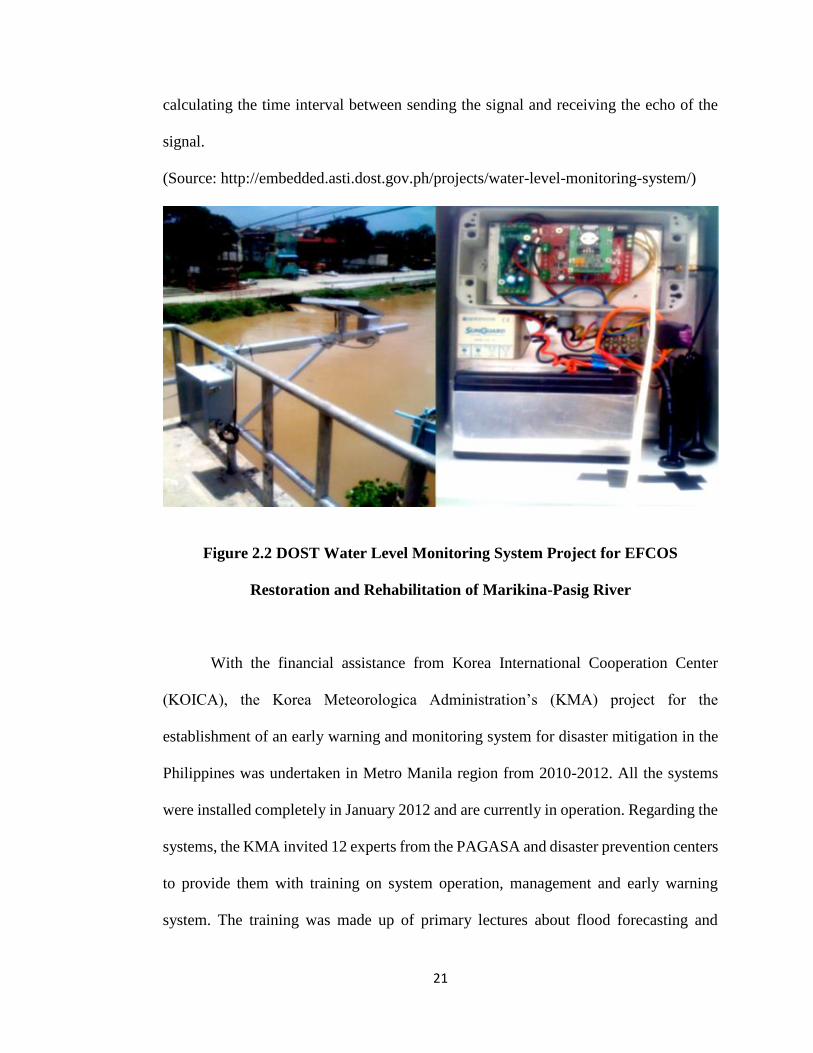
21
calculating the time interval between sending the signal and receiving the echo of the
signal.
(Source: http://embedded.asti.dost.gov.ph/projects/water-level-monitoring-system/)
Figure 2.2 DOST Water Level Monitoring System Project for EFCOS
Restoration and Rehabilitation of Marikina-Pasig River
With the financial assistance from Korea International Cooperation Center
(KOICA), the Korea Meteorologica Administration’s (KMA) project for the
establishment of an early warning and monitoring system for disaster mitigation in the
Philippines was undertaken in Metro Manila region from 2010-2012. All the systems
were installed completely in January 2012 and are currently in operation. Regarding the
systems, the KMA invited 12 experts from the PAGASA and disaster prevention centers
to provide them with training on system operation, management and early warning
system. The training was made up of primary lectures about flood forecasting and
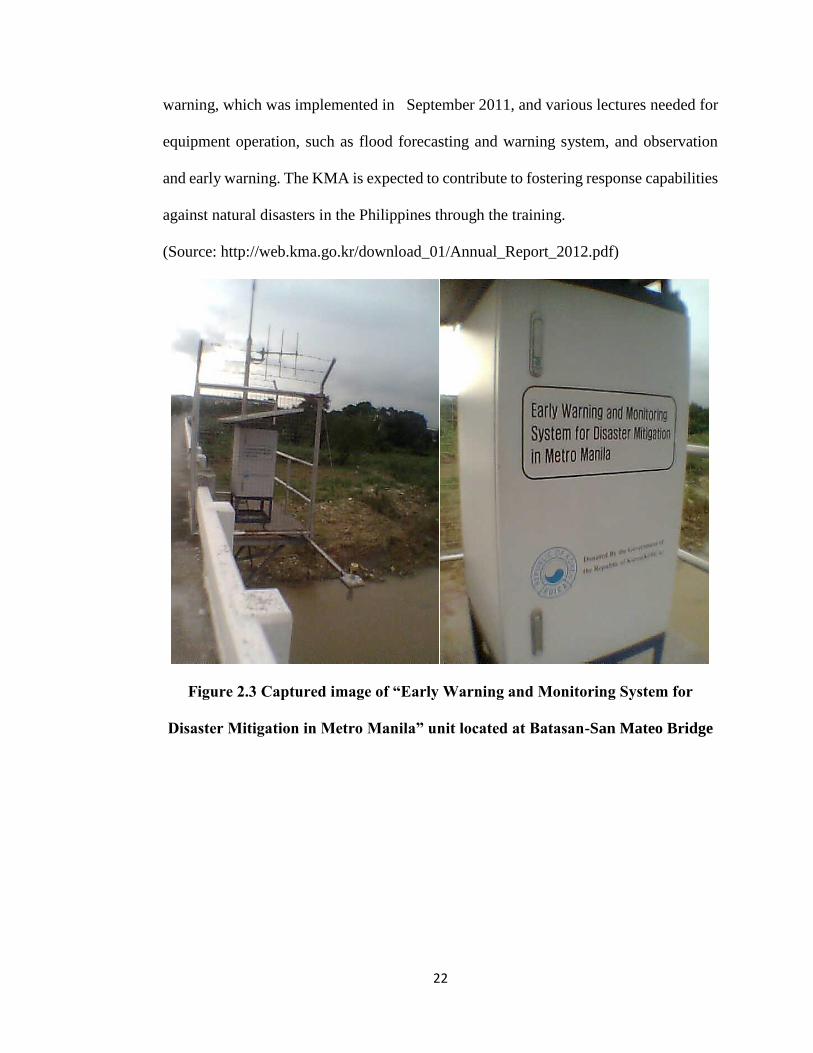
22
warning, which was implemented in September 2011, and various lectures needed for
equipment operation, such as flood forecasting and warning system, and observation
and early warning. The KMA is expected to contribute to fostering response capabilities
against natural disasters in the Philippines through the training.
(Source: http://web.kma.go.kr/download_01/Annual_Report_2012.pdf)
Figure 2.3 Captured image of “Early Warning and Monitoring System for
Disaster Mitigation in Metro Manila” unit located at Batasan-San Mateo Bridge
23
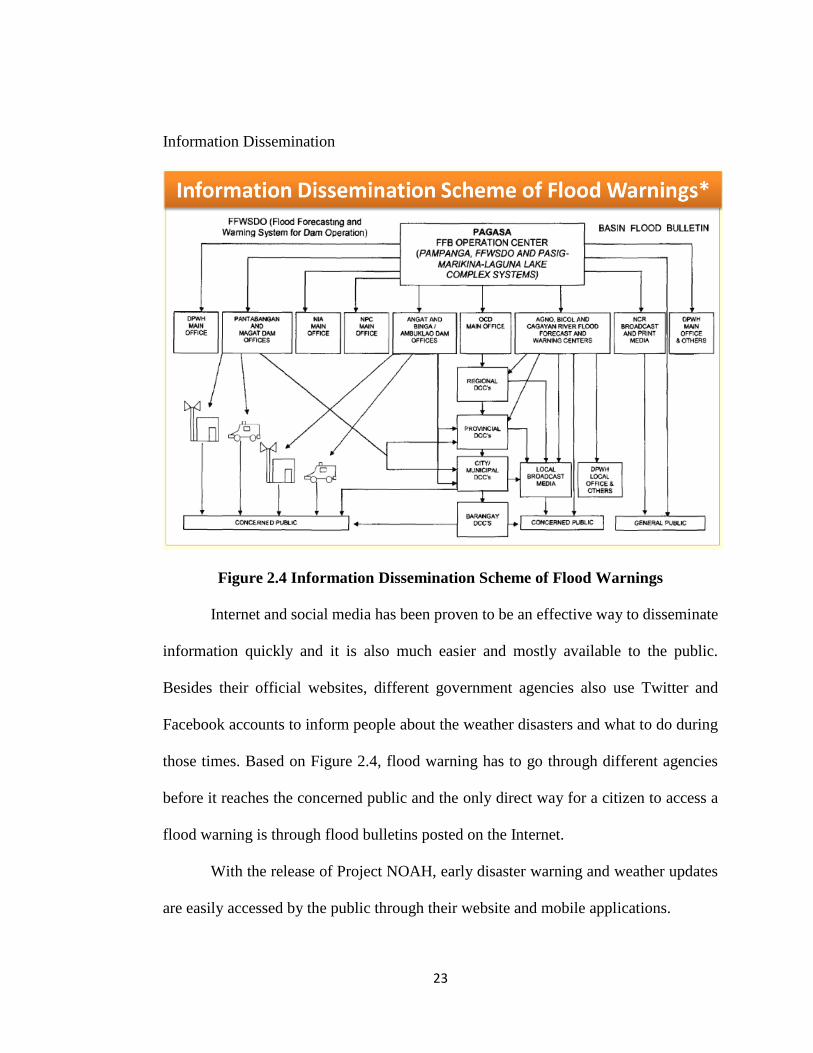
Information Dissemination
Figure 2.4 Information Dissemination Scheme of Flood Warnings
Internet and social media has been proven to be an effective way to disseminate
information quickly and it is also much easier and mostly available to the public.
Besides their official websites, different government agencies also use Twitter and
Facebook accounts to inform people about the weather disasters and what to do during
those times. Based on Figure 2.4, flood warning has to go through different agencies
before it reaches the concerned public and the only direct way for a citizen to access a
flood warning is through flood bulletins posted on the Internet.
With the release of Project NOAH, early disaster warning and weather updates
are easily accessed by the public through their website and mobile applications.
24
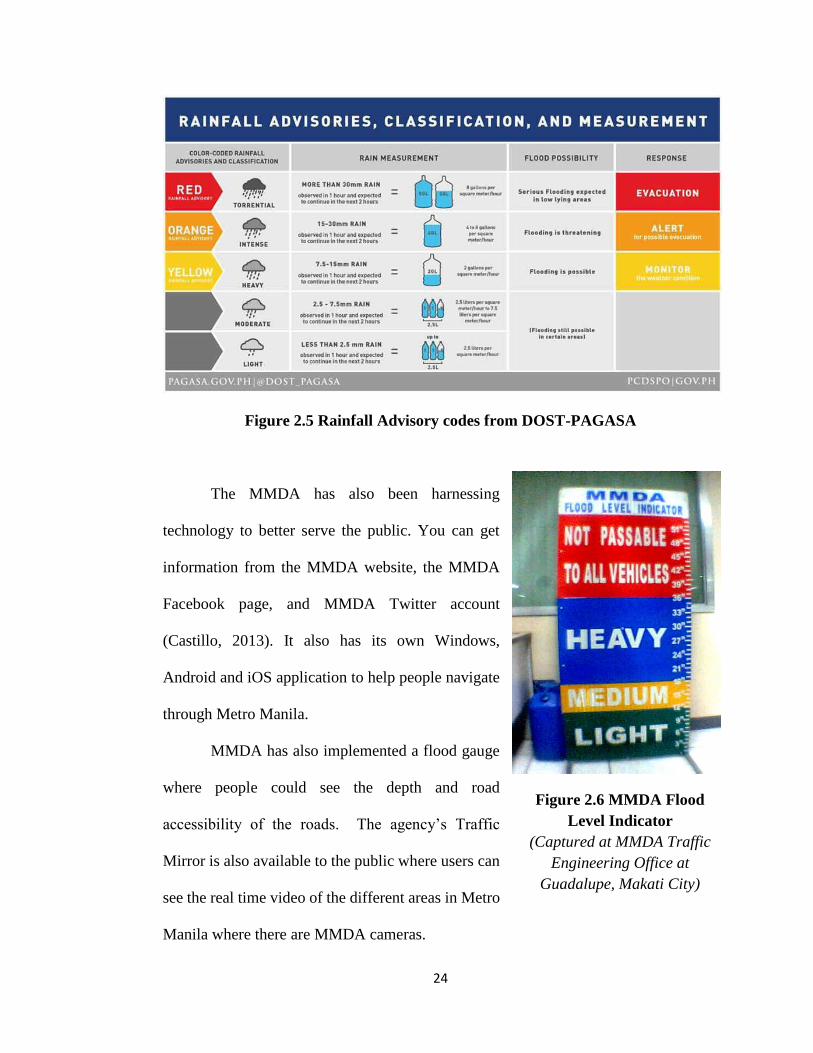
Figure 2.5 Rainfall Advisory codes from DOST-PAGASA
The MMDA has also been harnessing
technology to better serve the public. You can get
information from the MMDA website, the MMDA
Facebook page, and MMDA Twitter account
(Castillo, 2013). It also has its own Windows,
Android and iOS application to help people navigate
through Metro Manila.
MMDA has also implemented a flood gauge
where people could see the depth and road
accessibility of the roads. The agency’s Traffic
Mirror is also available to the public where users can
see the real time video of the different areas in Metro
Manila where there are MMDA cameras.
Figure 2.6 MMDA Flood
Level Indicator
(Captured at MMDA Traffic
Engineering Office at
Guadalupe, Makati City)
25
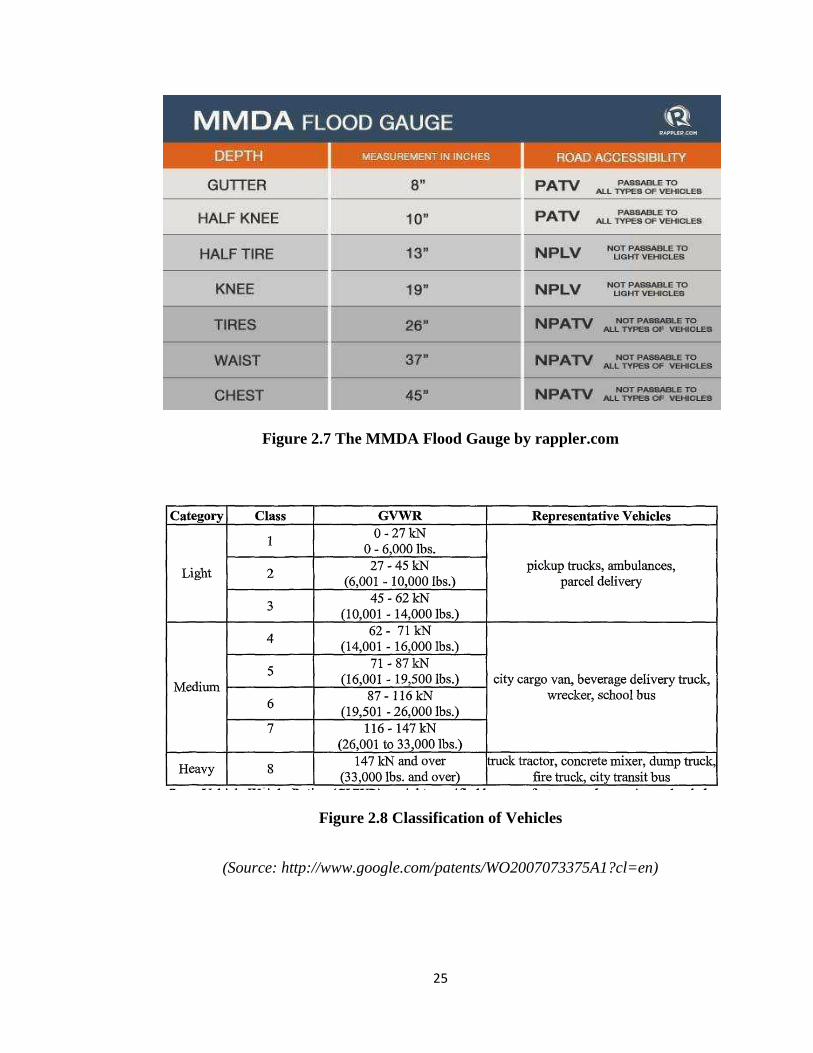
Figure 2.7 The MMDA Flood Gauge by rappler.com
Figure 2.8 Classification of Vehicles
(Source: http://www.google.com/patents/WO2007073375A1?cl=en)
26
But these social media applications are not enough especially when a commuter
is on the real site of a flooded area and has no access to the Internet. According to
abscbnnews.com, several commuters are still stranded and found it difficult to reach
their destination because several roads were impassable in the recent Maring typhoon
(2013).
Data collection via SMS
A method of sending data into database and analyzing data automatically from
independent measuring instrument (gauges, temp-and other sensors) which can be
displayed on webpages. Its sensors are maintained remotely via web frontend and SMS
and its networks are presented in interactive map application.
Foreign Studies
The Roadway Flash Flooding Warning Devices Feasibility Study conducted last
September 1999 and prepared for ITS IDEA Program, Transportation Research Board
and National Research Council examines the probable use of active systems in times of
danger from heavy rain and flooding through electronic signages, electronic messaging
and rail crossing gates. Majority of fatal weather related incidents in the United States
are caused by flash floods which is most of this incidence occurred on roadways.
In their project, they created a system that will automatically warns motorists
using cellular phones and beepers and controls traffic using mechanism such as railroad
crossing gates and electronic boards. Passive warning signages such as printed caution
boards were already existing on that time, but it is still concluded in their investigation
27
that the ignorance and carelessness of the motorist in checking the road signages makes
it worthless and brings them into danger. They prefer to use railroad crossing gates,
though they did not implement it due to its cost, because of time consumption of
preparing road barriers by road facilitators and sometimes removed by the motorists.
The researchers of this project identified different types of sensors to be used as
part of the method of detecting water height over-the-road. The sensors they used are
pressure transducers, ultrasonic device, beam of light, in-pavement sensor and video
cameras.
WebGIS, another study related to flood monitoring, is a foreign geographical
information system on the Internet that allows user to view and analyze data in a
geographical context simply by using a web browser. Through their webpage, users can
register for the SMS service and configure one or several gauges in their portfolio. It
can localize mobile objects via GPS and SMS tracking. Appropriate short messages will
be sent when a certain pre-defined threshold has been reached.
In year 2005, a study written for the “Journal of Theoretical and Applied
Information Technology” in Indonesia authored by S. Jatmiko, A. B. Mutiara, and M.
Indriati entitled “Prototype of Water Level Detection System with Wireless” had given
a conclusive output of using ultrasonic sensor, microcontroller, software program and
an LCD display.
In year 2009, Dr. Daniela Rus and Elizabeth Basha from Massachusetts Institute
of Technology (MIT) produced a study and sensor prototype for their project entitled
“Wireless Sensor Network Provides Early Flood Detection for Underserved Countries”.
The MIT researchers conducted the prototype testing on Aguan River in northeastern
28
Honduras. The research has been supported by Microsoft External Research Division
providing their financial, hardware, software and expertise that makes the project
possible. Their target is to research about an efficient flood sensor (Gumstix Sensor, a
pressure sensor) that can be affordable for the developing countries. They came up with
a prototype sensor that costs all-in-all about $200 apiece. But they said, it can be reduced
up to $50 or even $10 per unit due to economic scale. The prototype used rain and
temperature sensors with sensor network consisting of two communication tiers: 144
MHz Computation, Office and Community nodes, and 900 MHz Sensor nodes.
A good example of a mobile application developed in the US for flood
monitoring is the (Southern Nevada) Clark County Regional Flood Control District's
FloodSpot app. It contains interactive flood zone maps, weather reports, report floods
with geo-tagged photo/video upload, push notifications for reported flash floods,
alternate routes, and facts & tips on flood safety. Another international mobile app
called Flood Alert also allows users to get real time updates on flood warnings near
them, at locations important to them and for the rest of England and Wales. Some of its
features are it can give flood warning near to the user through geo-location. It can also
give flood warnings for specific locations wherein users can register for an account
where they can save important locations, such as homes and local businesses. In
addition, Flood Alert can show the current flood warnings in each region allowing the
user to monitor flooding events on a national scale. A valuable feature of the application
is specific information on the flood event which can help users understand their current
risk and the expected future changes. It also provides information on when the alert was
raised and last updated.
29
Local Studies
A study conducted by John Manuel B. Vergel about Real-time hourly
forecasting with Armax models with application for real-time flood operation at Angat
reservoir (2010) shows that these real-time flood forecasting systems are formulated for
issuing flood warning in real-time in order to prepare the evacuation plan during the
flood. The effectiveness of real-time flood forecasting system in reducing flood damage
is dependent on the robustness of the rainfall-runoff model.
The study titled Flood Detection Service helps its user to detect the level of flood
within a certain area through the use of different colors indicated on the chosen roads.
It also allows its user to gather information on how flooded a certain area is. In this
study, the subscribers are informed through text.
There are also other studies that do flood forecasting. The FFWSDO or The
Flood Forecasting and Warning System for Angat Dam Operation establishes
telemetered flood forecasting warning system that provides necessary information on
the water level of the existing five major dams in Luzon. These information forewarn
the people in the flood plains downstream of these dam sites of the impending release
of impounded water through spillways during typhoons. The information are sent
through SMS.
Another study from former PUP Computer Engineering students aimed to
monitor the flooded level along Pureza Street using an MCU-based system. Sensors are
placed and sent readings through text.
30
There are already different web and mobile applications that enables users to be
informed on flooded areas. With the initiative of Project NOAH (Nationwide
Operational Assessment of Hazards), an extended app called Flood Patrol enables
citizens to report flooded areas. Users could upload pictures of the flooded area and the
report will be pushed through the central data of Project NOAH. There is also another
mobile app that accesses extensive data from Project NOAH and DOST called Arko. It
contains flood mapping, remote monitoring and weather advisory. Another local
website that shows flood hazard maps in the Philippines is called nababaha.com. But it
does not show the current flooding in the given areas.
Synthesis
Based from the past and almost recent on-going studies presented above from
the research the proponents conducted, there were several similarities and differences
with the proposed Road Flood Sensor with Web and Mobile Application Support for
Alternate Routing and Traffic Advisory. Most of the studies presented monitors flood,
whether on the road or through dam reservoirs, and sends the information through text.
Some of the studies also has web application support but no mobile support for smart
phones.
Most similar to the proposed design is the Roadway Flash Flooding Warning
Devices Feasibility Study (1999). Our project will have flood sensors too to detect the
flood water level on the road. The sensor will also use an independent controlling unit
(gizDuino™ board) for both sensing and sending information. The unit will reside on a
31
low-lying street with historical data of flooding to programmatically analyze the current
water level on the said station. Likewise, we will develop web and mobile application
that will let administrators to manage the console of dissemination and sensing.
The main difference with our study and the study conducted by Boselly,
Kniepkamp, and Holan is this design will not only monitor road floods but will also
support user via web and mobile applications. This project will use the latest technology
which is mobile application for smart phones and SMS flood advisory subscription. The
mobile application will be integrated to Facebook and Twitter API to post or tweet
available flood water level information to social network. Also, researchers will not use
rail crossing gates due to its high cost, though it is much recommended and a brilliant
idea to make it as controlling unit for traffic. Our application will include an alternate
routing information by broadcasting the current status of the stationed road.
The research conducted in Indonesia by Jatmiko, Mutiara and Indriati is
identical to one part of our project. The research proposed to create more complicated
software applications. They used win32 application for monitoring flood sensors and
data presentation while our project will be using web and mobile application.
For the MIT Research, they created a sensor network that used long-distance
communication as a protocol for transmission of data. Also, they used rain, temperature
sensors and a water level sensor while our project used a flood sensor which will use an
ultrasonic sensor for flood level sensing.
Different local websites and mobile apps such as nababaha.com, Flood Patrol,
and Arko enables users to check flood advisories and flood mapping. Just like this
project’s web and mobile application support, these applications also give information
32
about flood. The only difference is that those applications gets their data from the
Project NOAH database and from the existing method Metro Manila has in gathering
flood information on certain areas (i.e. through citizen reporting, and CCTV monitoring
on certain areas) while RoadFloodPH, could get data directly from the flood sensor
device of this project study.

Chapter 3
METHODOLOGY
This chapter describes and explains the methodology deployed in this study.
Methods of Research
The research design that was mainly used in this study is the descriptive method.
Descriptive method is a fact-finding study with adequate and accurate interpretation of
the findings. It is said to describe with emphasis of what actually exist such as current
conditions, practices, situations, or any phenomena. Also some of the several methods
used were survey method and interview method. These methods help the researchers to
formulate solutions to the raised problems of this project.
Sources of Data
This project aims to create flood sensor with mobile and web applications
support that will provide motorists and commuters about flooded roads.
34
The respondents for the survey will be fifty (100) people randomly chosen from
ages 15 to 60 years old. They shall be selected by non-probability sampling and shall be
composed of males and females. The proponents shall conduct interviews one-on-one
or with a small group. The interviewees would be coming from professionals and
officials who work on different agencies that address to issues such as risk-reduction,
and natural calamities.
Direct observation of the performance of the flood sensors is an excellent means
of gathering data. Observations are usually done in combination with another data
gathering method that is used to fill in the gaps and answer questions.
Data Gathering Instrument
The proponents formulated survey questionnaires and interview questions for
data gathering. These tools would help the researches to acquire data that will be used
in the study.
Survey questionnaires would also be used in the data gathering. These are
carefully formulated, set, and arranged by the researchers. The questionnaires will be
given to the respondents which will also be collected back to systematically evaluate
and tabulate the respondent’s answer.
The researchers would be visiting various non-government and government
agencies (such as MMDA, DOST, local governments) and would be conducting series
35
of interviews based on the needed information to be collected. Schedules for interviews
would be varying according to the response of the professionals or officials who are in-
charge with issues like risk-reduction, flood and other natural calamities. Interviews will
be recorded in proper recording equipment. The conducted interviews, authorized by
the respondents, will serve as legal references for the researchers.
All these data collecting paraphernalia were solely used for the purpose of the
study.
Data Gathering Procedures
The researchers will seek approval from the concerned government and non-
government agencies to make the study possible. Random people will also be asked to
answer the survey questionnaires upon their approval.
Survey questionnaires will be given to random people to check the significance
of the study to be conducted. Researchers will also be conducting interviews to different
professionals and officials who work in agencies related to the design project. The data
which will be collected during the said process will help them to evaluate the specific
opinions and ideas of the people related to the topic in order to make appropriate
generalizations.
After creating the prototype and the supporting Internet-based applications,
testing of the sensors and web/mobile applications will undergo. In case that the time to
36
test the sensors where there are no flooding in the designated areas, simulations will be
done. The researchers will seek pieces of advice from flood experts to create flood
simulations.
The findings from this research will be compared to the other findings and
official reports based on the interviews and survey processes.
Statistical Treatment of Data
The following statistical treatments were used to treat the data:
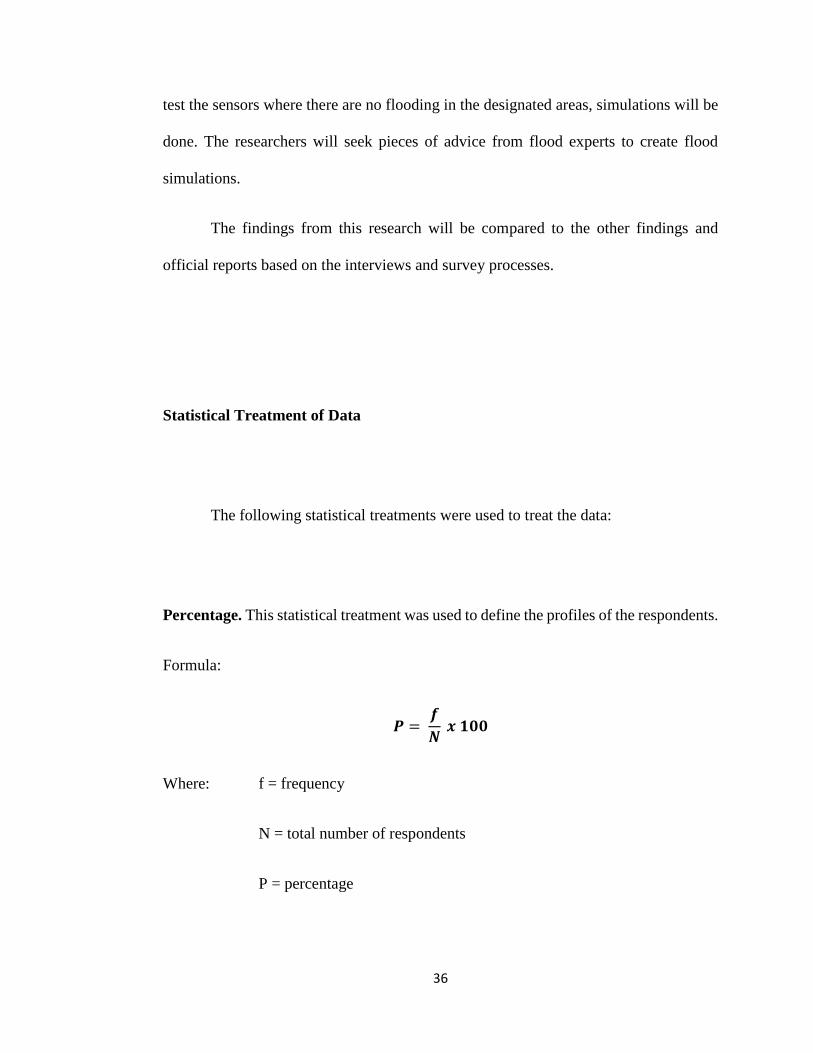
Percentage. This statistical treatment was used to define the profiles of the respondents.
Formula:
𝑷 = 𝒇
𝑵 𝒙 𝟏𝟎𝟎
Where: f = frequency
N = total number of respondents
P = percentage
37
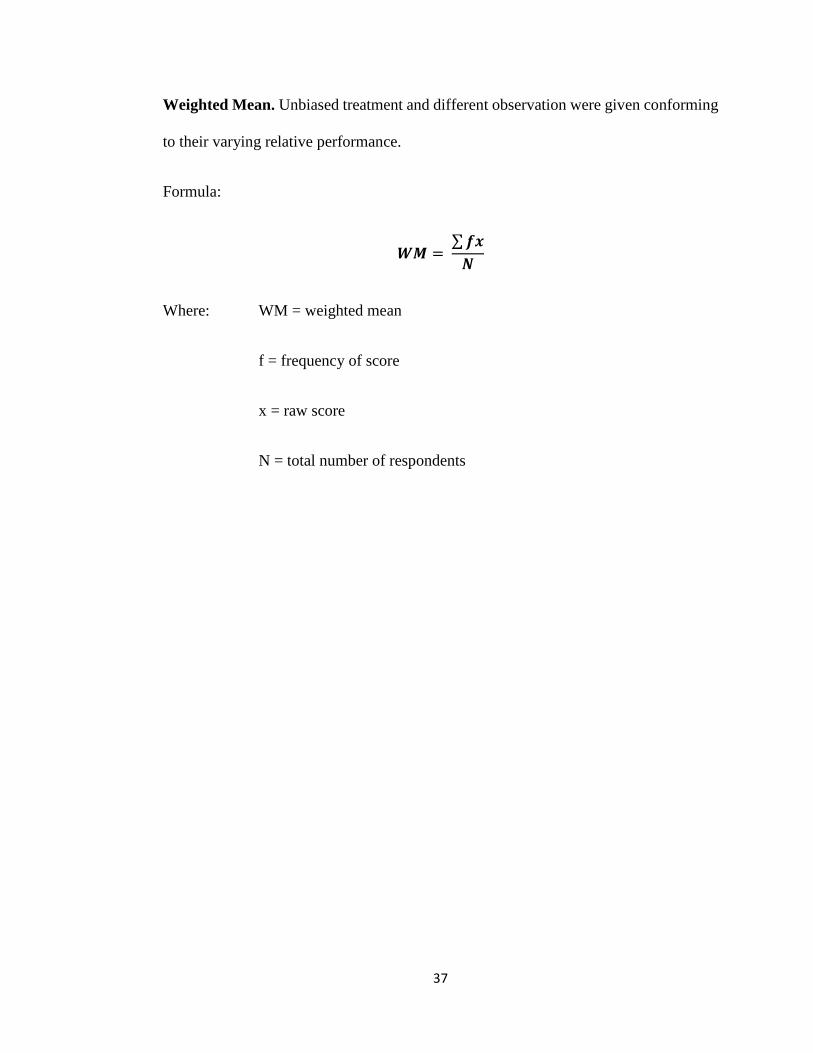
Weighted Mean. Unbiased treatment and different observation were given conforming
to their varying relative performance.
Formula:
𝑾𝑴 = ∑ 𝒇𝒙
𝑵
Where: WM = weighted mean
f = frequency of score
x = raw score
N = total number of respondents
38
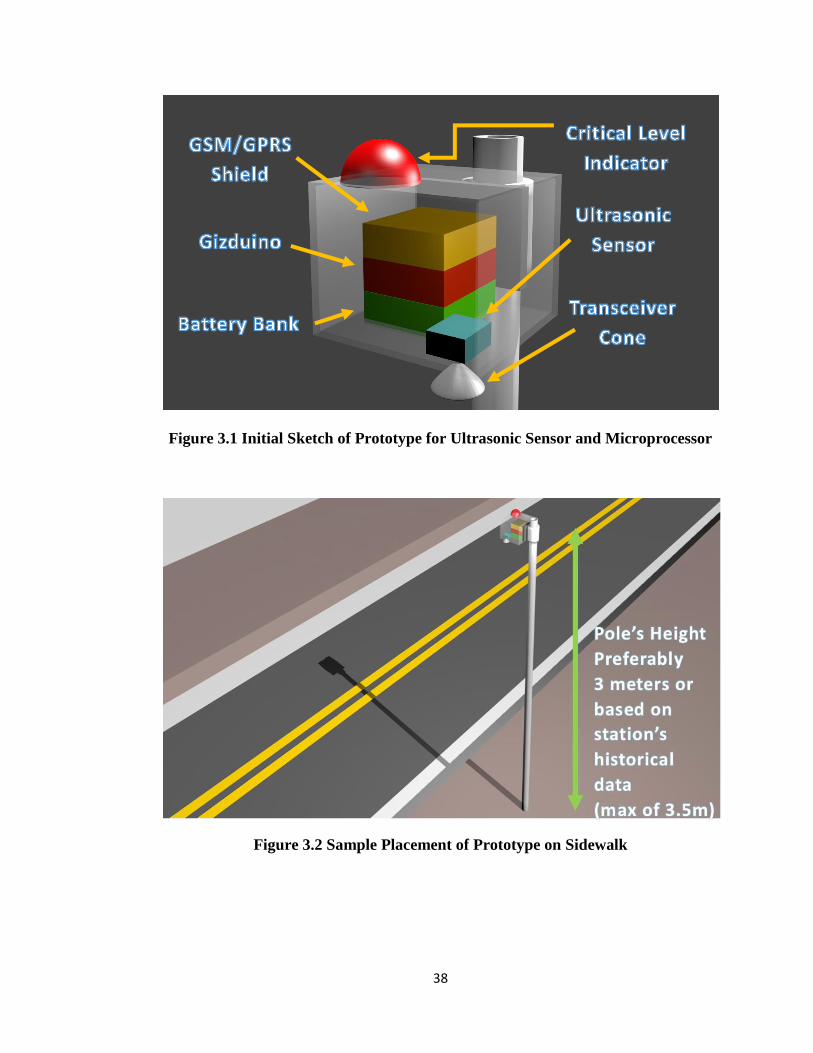
Figure 3.1 Initial Sketch of Prototype for Ultrasonic Sensor and Microprocessor
Figure 3.2 Sample Placement of Prototype on Sidewalk
39
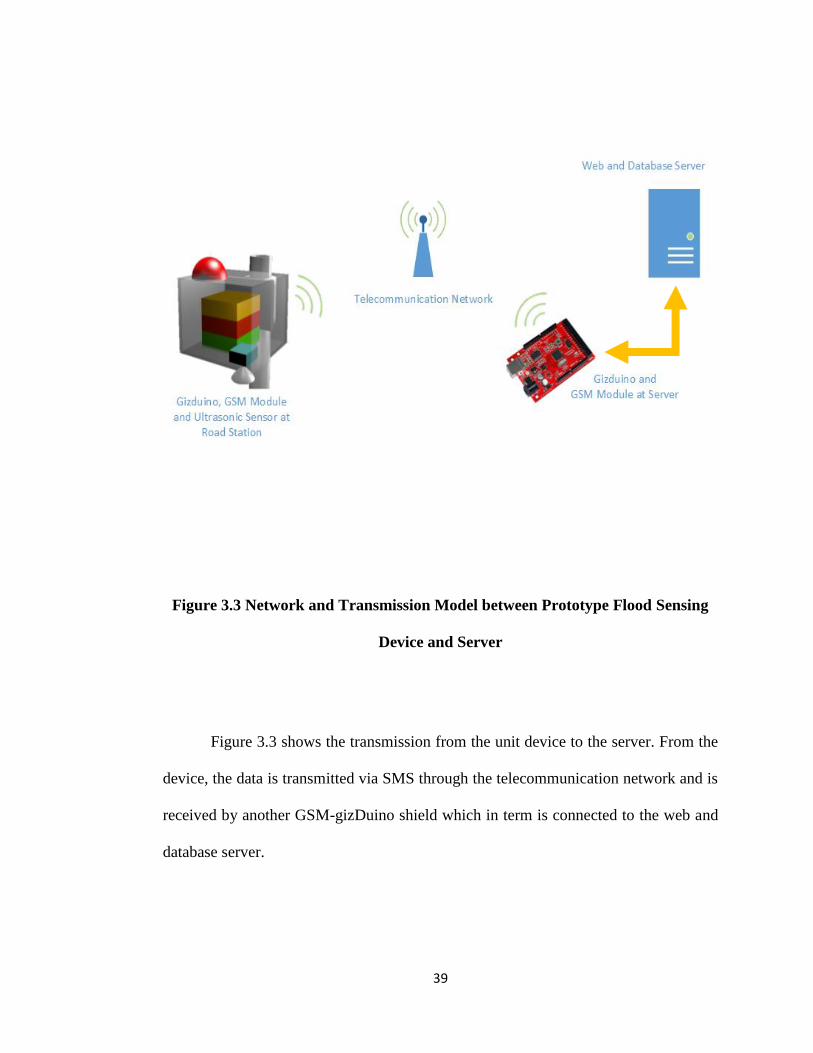
Figure 3.3 Network and Transmission Model between Prototype Flood Sensing
Device and Server
Figure 3.3 shows the transmission from the unit device to the server. From the
device, the data is transmitted via SMS through the telecommunication network and is
received by another GSM-gizDuino shield which in term is connected to the web and
database server.
40
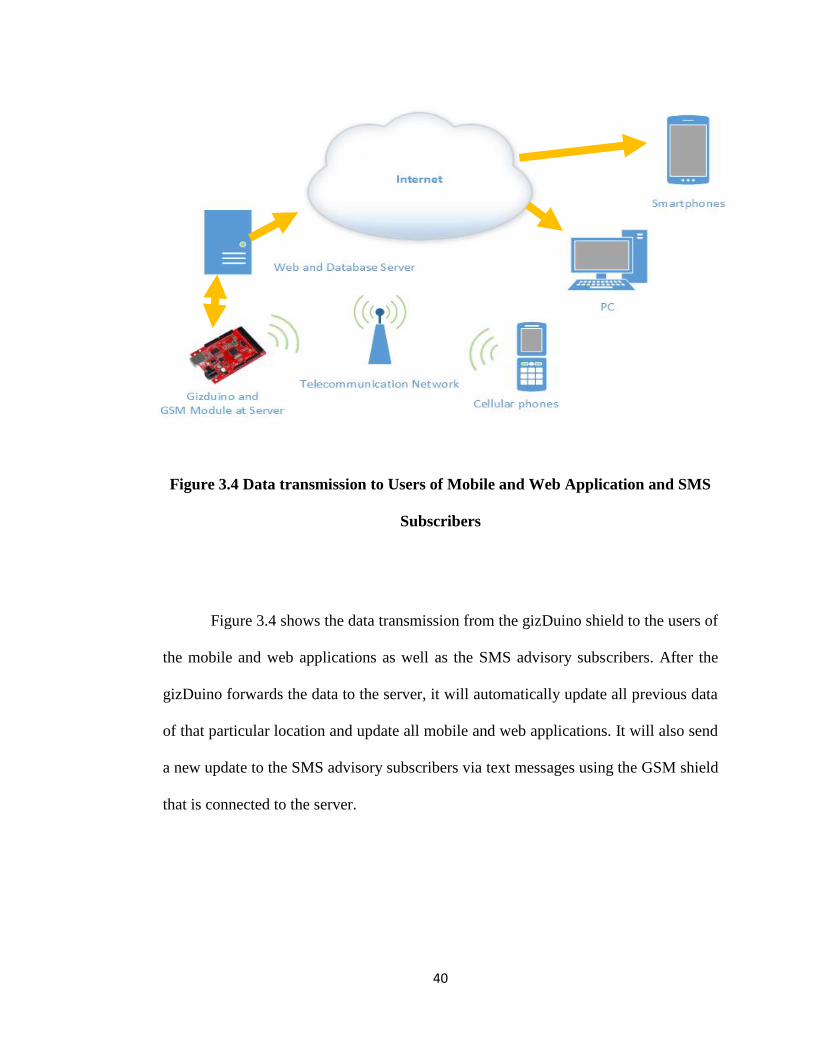
Figure 3.4 Data transmission to Users of Mobile and Web Application and SMS
Subscribers
Figure 3.4 shows the data transmission from the gizDuino shield to the users of
the mobile and web applications as well as the SMS advisory subscribers. After the
gizDuino forwards the data to the server, it will automatically update all previous data
of that particular location and update all mobile and web applications. It will also send
a new update to the SMS advisory subscribers via text messages using the GSM shield
that is connected to the server.
41
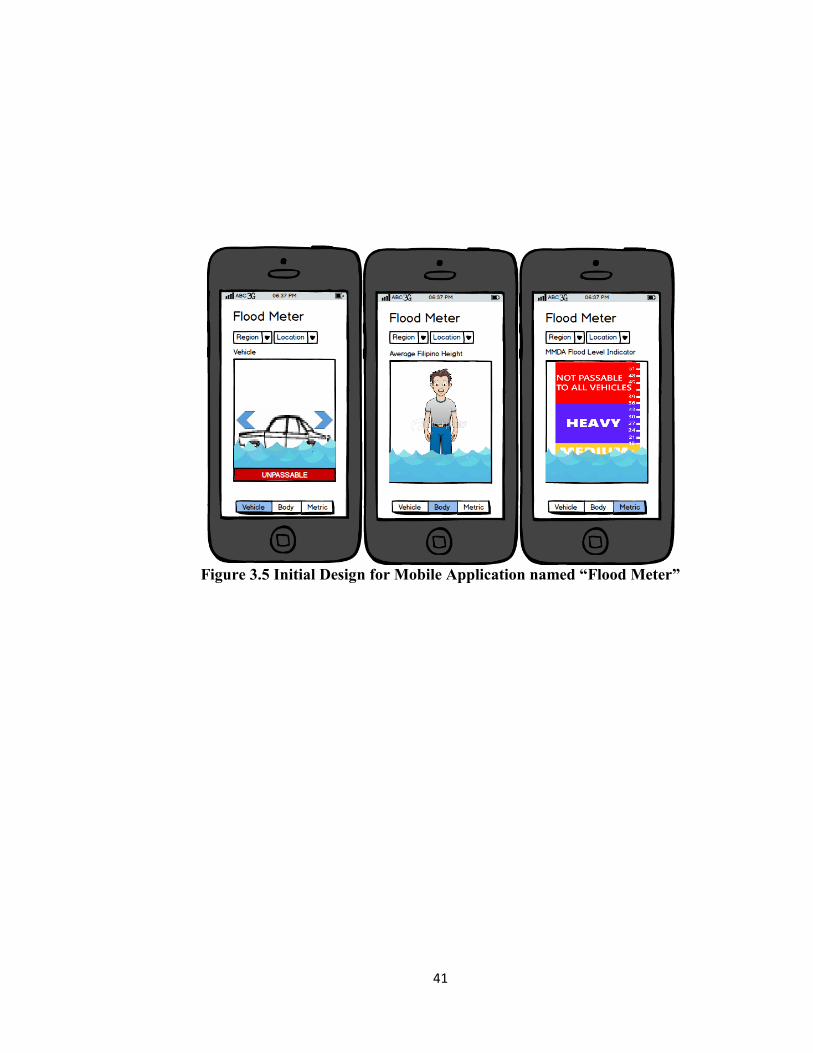
Figure 3.5 Initial Design for Mobile Application named “Flood Meter”
42
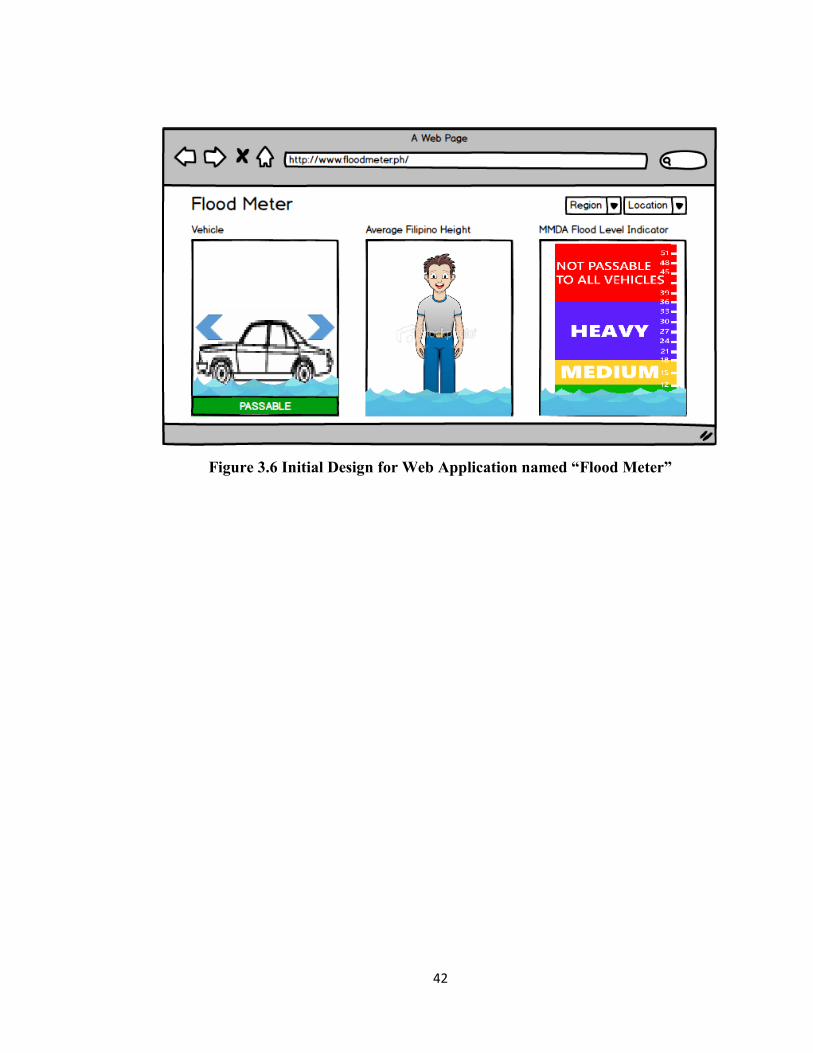
Figure 3.6 Initial Design for Web Application named “Flood Meter”
Chapter 4
PRESENTATION, ANALYSIS AND INTERPRETATION OF DATA
This chapter presents the components of the system, implementation of the
hardware design, fabrication of components, circuitry designs, diagrams, and overall
cost of the implemented system. This will give an overview of the overall proposed
system in terms of procedures and figures presented.
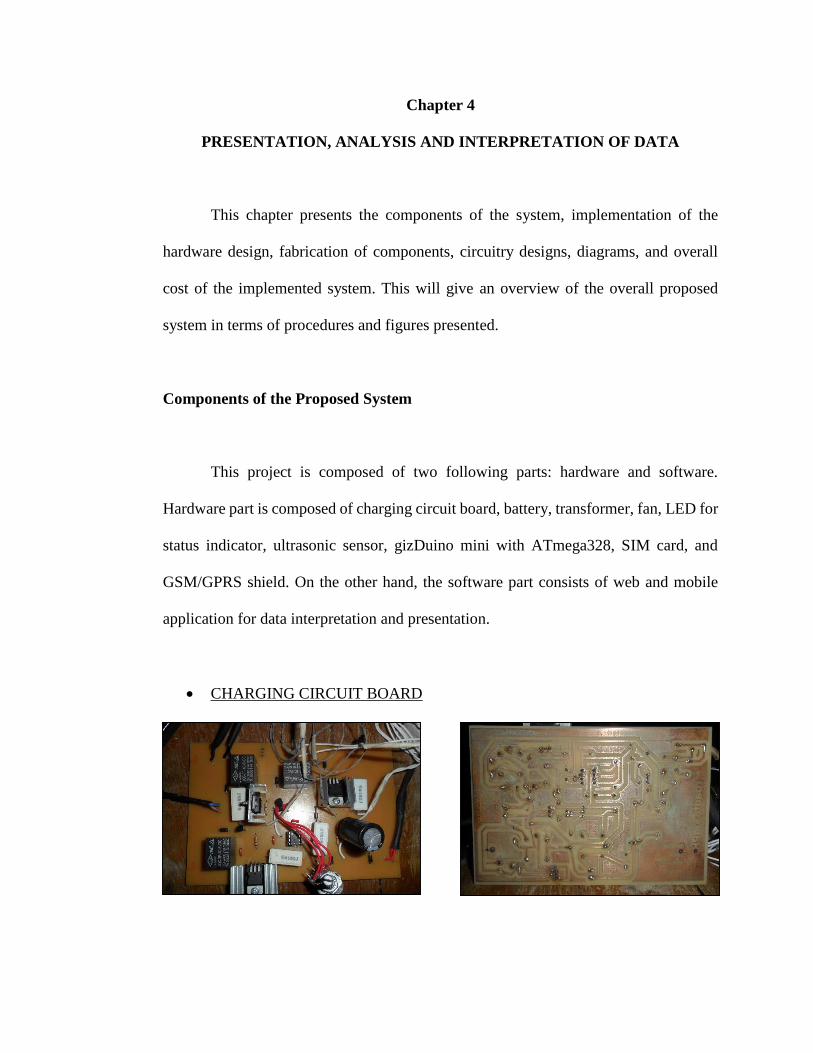
Components of the Proposed System
This project is composed of two following parts: hardware and software.
Hardware part is composed of charging circuit board, battery, transformer, fan, LED for
status indicator, ultrasonic sensor, gizDuino mini with ATmega328, SIM card, and
GSM/GPRS shield. On the other hand, the software part consists of web and mobile
application for data interpretation and presentation.
CHARGING CIRCUIT BOARD
44
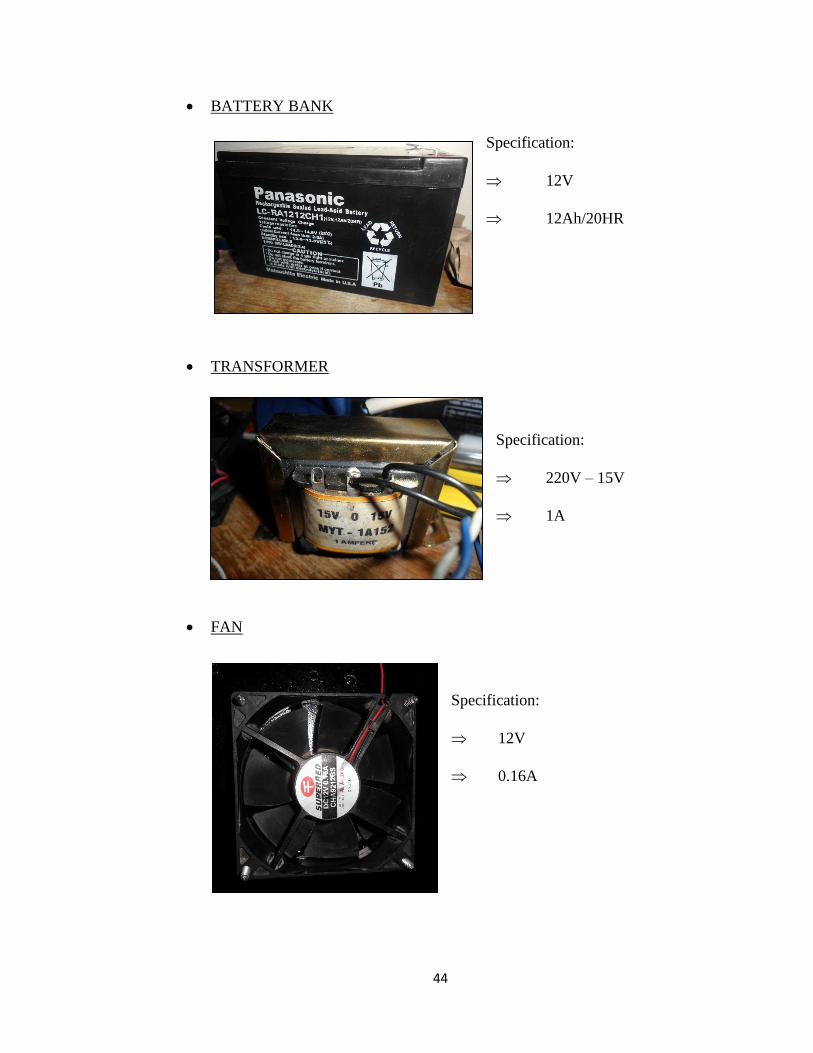
BATTERY BANK
Specification:
12V
12Ah/20HR
TRANSFORMER
Specification:
220V – 15V
1A
FAN
Specification:
12V
0.16A
45
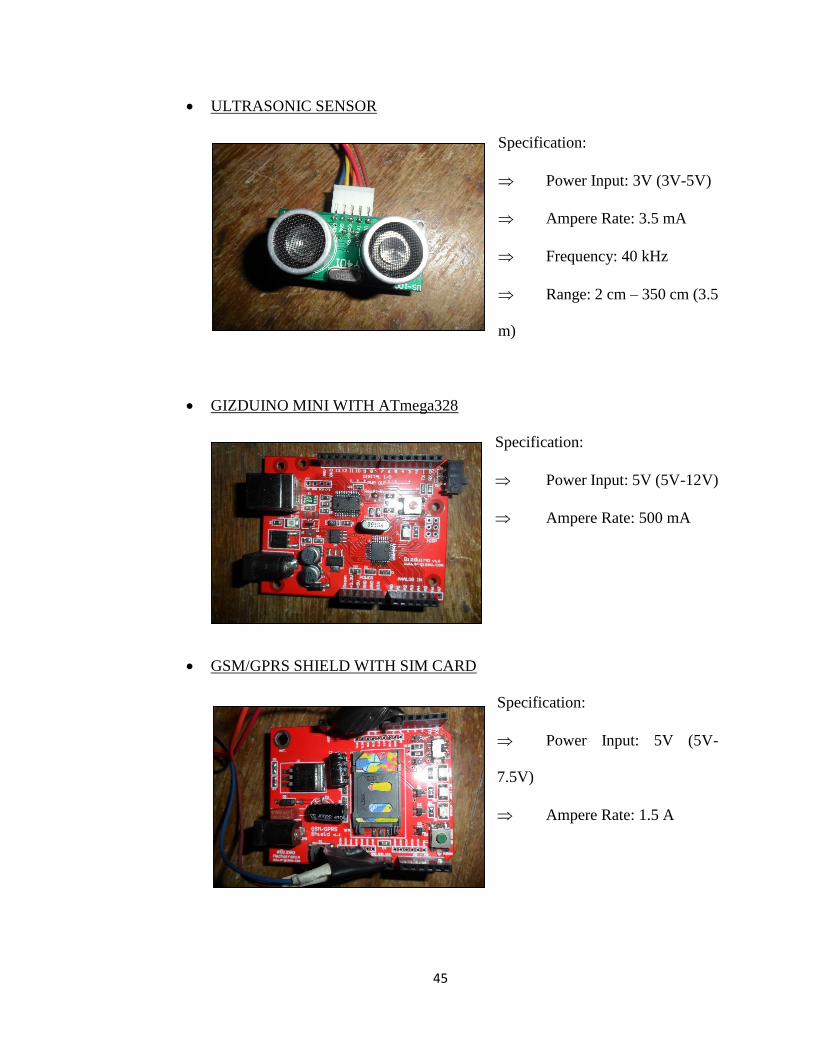
ULTRASONIC SENSOR
Specification:
Power Input: 3V (3V-5V)
Ampere Rate: 3.5 mA
Frequency: 40 kHz
Range: 2 cm – 350 cm (3.5
m)
GIZDUINO MINI WITH ATmega328
Specification:
Power Input: 5V (5V-12V)
Ampere Rate: 500 mA
GSM/GPRS SHIELD WITH SIM CARD
Specification:
Power Input: 5V (5V-
7.5V)
Ampere Rate: 1.5 A
46
LED FOR STATUS INDICATOR
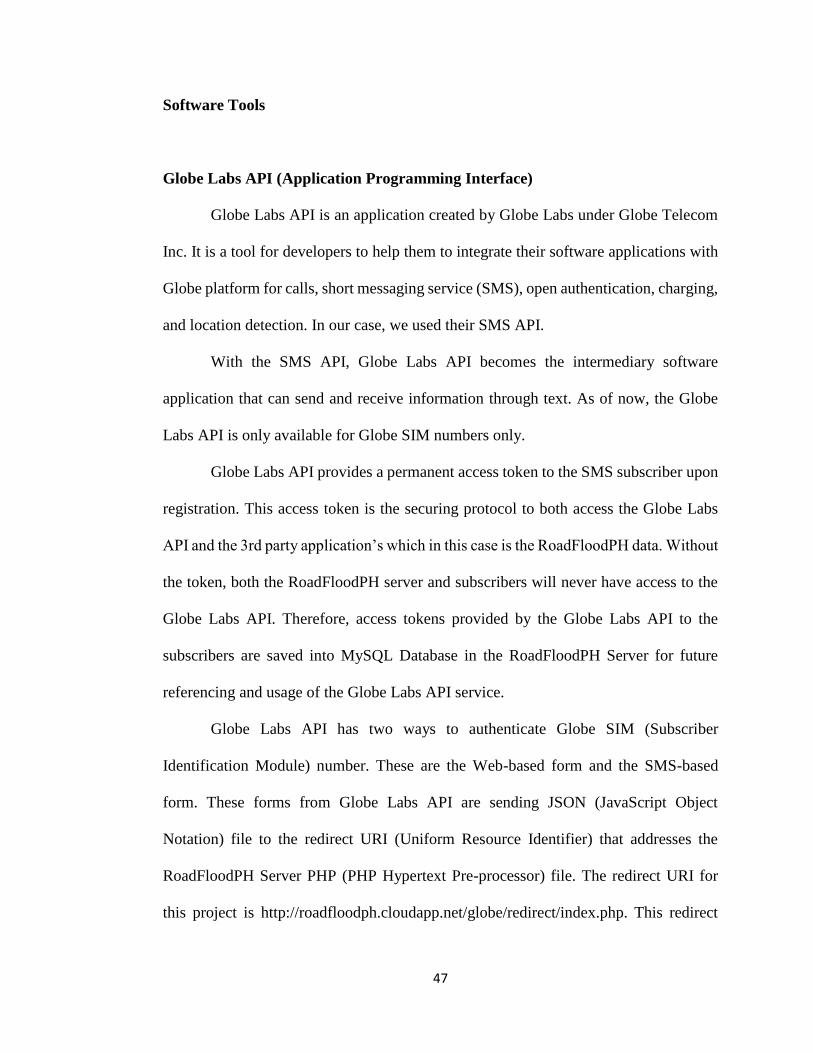
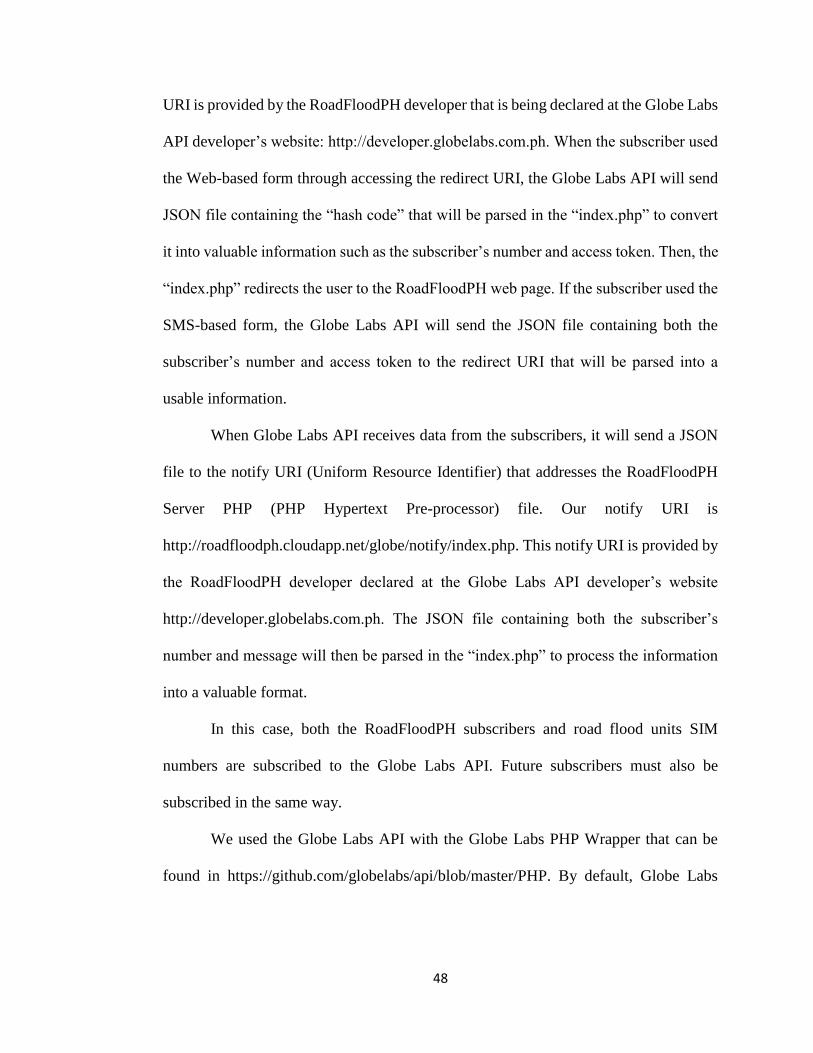
CASING
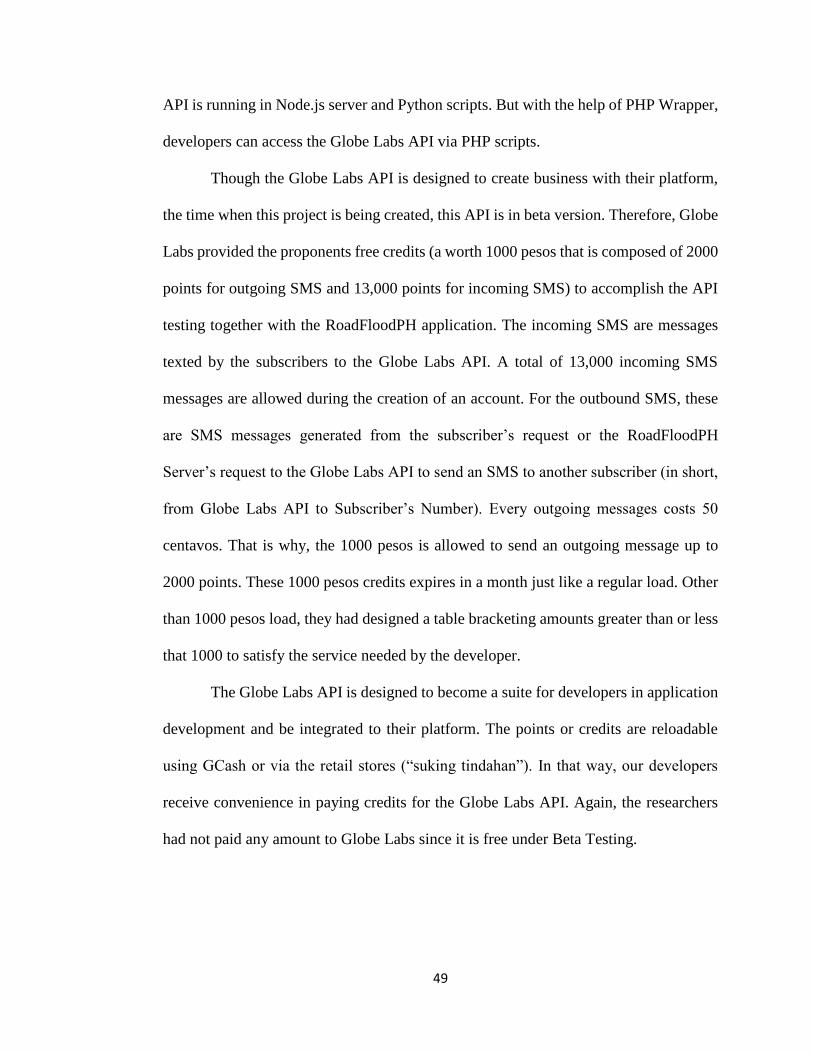
Hardware Component Placement
Figure 4.1 Actual placement of the components in the casing
47
Software Tools
Globe Labs API (Application Programming Interface)
Globe Labs API is an application created by Globe Labs under Globe Telecom
Inc. It is a tool for developers to help them to integrate their software applications with
Globe platform for calls, short messaging service (SMS), open authentication, charging,
and location detection. In our case, we used their SMS API.
With the SMS API, Globe Labs API becomes the intermediary software
application that can send and receive information through text. As of now, the Globe
Labs API is only available for Globe SIM numbers only.
Globe Labs API provides a permanent access token to the SMS subscriber upon
registration. This access token is the securing protocol to both access the Globe Labs
API and the 3rd party application’s which in this case is the RoadFloodPH data. Without
the token, both the RoadFloodPH server and subscribers will never have access to the
Globe Labs API. Therefore, access tokens provided by the Globe Labs API to the
subscribers are saved into MySQL Database in the RoadFloodPH Server for future
referencing and usage of the Globe Labs API service.
Globe Labs API has two ways to authenticate Globe SIM (Subscriber
Identification Module) number. These are the Web-based form and the SMS-based
form. These forms from Globe Labs API are sending JSON (JavaScript Object
Notation) file to the redirect URI (Uniform Resource Identifier) that addresses the
RoadFloodPH Server PHP (PHP Hypertext Pre-processor) file. The redirect URI for
this project is http://roadfloodph.cloudapp.net/globe/redirect/index.php. This redirect
48
URI is provided by the RoadFloodPH developer that is being declared at the Globe Labs
API developer’s website: http://developer.globelabs.com.ph. When the subscriber used
the Web-based form through accessing the redirect URI, the Globe Labs API will send
JSON file containing the “hash code” that will be parsed in the “index.php” to convert
it into valuable information such as the subscriber’s number and access token. Then, the
“index.php” redirects the user to the RoadFloodPH web page. If the subscriber used the
SMS-based form, the Globe Labs API will send the JSON file containing both the
subscriber’s number and access token to the redirect URI that will be parsed into a
usable information.
When Globe Labs API receives data from the subscribers, it will send a JSON
file to the notify URI (Uniform Resource Identifier) that addresses the RoadFloodPH
Server PHP (PHP Hypertext Pre-processor) file. Our notify URI is
http://roadfloodph.cloudapp.net/globe/notify/index.php. This notify URI is provided by
the RoadFloodPH developer declared at the Globe Labs API developer’s website
http://developer.globelabs.com.ph. The JSON file containing both the subscriber’s
number and message will then be parsed in the “index.php” to process the information
into a valuable format.
In this case, both the RoadFloodPH subscribers and road flood units SIM
numbers are subscribed to the Globe Labs API. Future subscribers must also be
subscribed in the same way.
We used the Globe Labs API with the Globe Labs PHP Wrapper that can be
found in https://github.com/globelabs/api/blob/master/PHP. By default, Globe Labs
49
API is running in Node.js server and Python scripts. But with the help of PHP Wrapper,
developers can access the Globe Labs API via PHP scripts.
Though the Globe Labs API is designed to create business with their platform,
the time when this project is being created, this API is in beta version. Therefore, Globe
Labs provided the proponents free credits (a worth 1000 pesos that is composed of 2000
points for outgoing SMS and 13,000 points for incoming SMS) to accomplish the API
testing together with the RoadFloodPH application. The incoming SMS are messages
texted by the subscribers to the Globe Labs API. A total of 13,000 incoming SMS
messages are allowed during the creation of an account. For the outbound SMS, these
are SMS messages generated from the subscriber’s request or the RoadFloodPH
Server’s request to the Globe Labs API to send an SMS to another subscriber (in short,
from Globe Labs API to Subscriber’s Number). Every outgoing messages costs 50
centavos. That is why, the 1000 pesos is allowed to send an outgoing message up to
2000 points. These 1000 pesos credits expires in a month just like a regular load. Other
than 1000 pesos load, they had designed a table bracketing amounts greater than or less
that 1000 to satisfy the service needed by the developer.
The Globe Labs API is designed to become a suite for developers in application
development and be integrated to their platform. The points or credits are reloadable
using GCash or via the retail stores (“suking tindahan”). In that way, our developers
receive convenience in paying credits for the Globe Labs API. Again, the researchers
had not paid any amount to Globe Labs since it is free under Beta Testing.
50
Facebook API
Facebook API is an application software that enables developers to connect their
apps to Facebook. Proponents used their PHP SDK (Software Development Kit) to
enable the RoadFloodPH application to share flood updates into the RoadFloodPH
Facebook Page.
The trigger in posting to Facebook is the Globe Labs API. When the Globe Labs
API throws data to the notify URI, the PHP script will be triggered to use the posting
script of the Facebook API.
Windows Azure
Windows Azure is an open and flexible cloud platform that enables developers
to quickly build, deploy and manage applications across a global network of Microsoft-
managed data centers. Anyone can build applications using any language, tool or
framework. And it can integrate to any public cloud applications with the developer’s
existing IT environment.
In this case, researchers used Window Azure to create a virtual machine that will
be available in the Internet to stand as the web and database hosting computer server for
the RoadFloodPH application. Windows Azure has a free trial access within 90 days for
a regular software tester. But, the proponents got a privilege account from Microsoft,
PUP’s software partner company, which is called BizSpark. BizSpark is a privilege
business account for start-ups. It provides access to business software tools for 3 years
such as the MSDN (Microsoft Developers Network) subscription and Windows Azure.
These subscriptions are being paid by the BizSpark account.
51
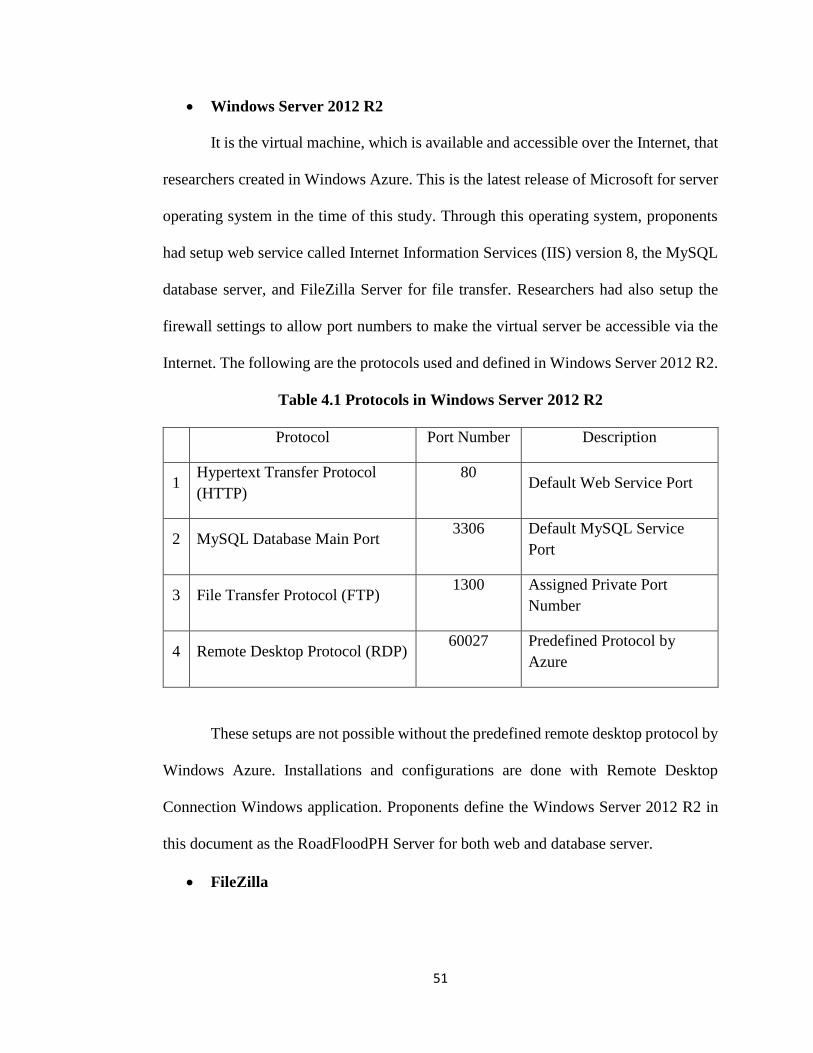
Windows Server 2012 R2
It is the virtual machine, which is available and accessible over the Internet, that
researchers created in Windows Azure. This is the latest release of Microsoft for server
operating system in the time of this study. Through this operating system, proponents
had setup web service called Internet Information Services (IIS) version 8, the MySQL
database server, and FileZilla Server for file transfer. Researchers had also setup the
firewall settings to allow port numbers to make the virtual server be accessible via the
Internet. The following are the protocols used and defined in Windows Server 2012 R2.
Table 4.1 Protocols in Windows Server 2012 R2
Protocol Port Number Description
1 Hypertext Transfer Protocol
(HTTP)
80 Default Web Service Port
2 MySQL Database Main Port 3306 Default MySQL Service
Port
3 File Transfer Protocol (FTP) 1300 Assigned Private Port
Number
4 Remote Desktop Protocol (RDP) 60027 Predefined Protocol by
Azure
These setups are not possible without the predefined remote desktop protocol by
Windows Azure. Installations and configurations are done with Remote Desktop
Connection Windows application. Proponents define the Windows Server 2012 R2 in
this document as the RoadFloodPH Server for both web and database server.
FileZilla
52
FileZilla is an open-source software application tool that is capable of
transferring files from the local computer to the server (Windows Server 2012 R2).
FileZilla uses File Transfer Protocol (FTP) with the default value of 21. But, for security
reasons, researchers assigned private port number in the FTP setup.
FileZilla has two types, the client application and the server application. The
client application must be installed in the local computer while the server application to
the server side. Through the client application, the researchers can transfer files from
the local computer to the RoadFloodPH Server. For the FileZilla server application,
proponents defined in its setting the directories accessible by the FileZilla client and
also defined username and password that will allow the access to these directories.
Developers also setup in the FileZilla server settings of all the possible configurations
the client can do with these directories such as creation, deletion, and modification of
directory and files.
Proponents used FileZilla to transfer the RoadFloodPH web files such as the
HTML (Hypertext Mark-up Language), JS (JavaScript), CSS (Cascading Style Sheets),
and PHP (PHP Hypertext Pre-processor) from the local computer to the RoadFloodPH
server.
Internet Information Services (IIS) 8
IIS is the provider and manager of all the requests in the web and database
protocol. It is the resource locator (images, HTML, CSS and JS) and caller to server
side interpreter (PHP, server-side scripts that has access to MySQL database). By
default, IIS is preconfigured to process server-side scripts in ASP (Active Server Pages)
53
format but proponents used PHP, instead, with respect to the knowledge and skills and
the availability of PHP wrapper of the Globe Labs API.
Microsoft Web Platform Installer
In a Windows Server, the default installed web and database services are ASP
and SQL Server. But, Windows made it possible to integrate famous open-source
applications to its Windows environment integrated to IIS.
Researchers used Microsoft Web Platform Installer application to install PHP
and MySQL in our RoadFloodPH Server. With this installer application, all
configurations needed to integrate the IIS web service with PHP and MySQL are
automatically performed.
PHP: Hypertext Pre-processor (PHP)
PHP is a widely-used open source general-purpose scripting language that is
especially suited for web development and can be embedded into HTML.
The proponents used PHP for all the server-side scripting. Alteration and
retrieving of data to and from the database are performed using the PHP scripts.
MySQL
MySQL is the world’s most popular open source database, enabling the cost-
effective delivery of reliable, high-performance and scalable Web-based and embedded
database applications.
Proponents used MySQL as the database platform for RoadFloodPH
application.
Web Browsers
54
Researchers used Internet Explorer, Google Chrome, and Mozilla Firefox to test
and view the web application. Test results show that all the features of the web app
working in these three leading web browser.
JQuery Framework
JQuery is a fast, small, and feature-rich JavaScript library. It makes things like
HTML document traversal and manipulation, event handling, animation, and Ajax
much simpler with an easy-to-use API that works across a multitude of browsers. With
a combination of versatility and extensibility, jQuery has changed the way that millions
of people write JavaScript.
Researchers used JQuery as a framework in our JavaScript files and make use
of the modern styles of scripting and animations.
JQuery Mobile Framework
It is a JQuery Framework for developing mobile applications. Proponents used
this framework to easily create the mobile app version of RoadFloodPH.
Arduino IDE (Integrated Development Environment)
Proponents used Arduino IDE to compile and upload our codes to Gizduino mini
with ATmega328. Its environment codes are in C or C++ language.
System Implementation (Hardware)
I. PROCEDURES IN THE DESIGN AND FABRICATION OF THE CIRCUIT
OR DEVICE
55
The first stage was creating the circuit for the back-up power voltage regulator.
The proponents etched, mounted the components of the circuit, and tested if it is
functioning properly. The proponents then started researching of the actual prototype.
Researchers had done series of canvassing and designing on how the components will
be placed in a casing. Proponents sketched designs and asked metal experts in making
the case of the prototype. Once the casing is done, the proponents then mounted all the
components after testing if each of the parts are properly functioning.
After checking and validating each components if they are properly functioning
when integrated together, the researchers then proceeded to the designing and coding of
the program needed for the water level sensing. The researchers troubleshoot and
consider certain adjustments on the sensor and on how the water level readings will be
presented on both web and mobile application support.
The researchers also started coding the GUI (Graphical User Interface) of both
web and mobile application. Once both GUIs are completed, proponents started coding
the backend part of the applications where data from the sensors are passed through the
servers and presented through both web and mobile applications.
Lastly, the final stage of implementation of the system was the testing based on
the sensory evaluation. The researchers tested the sensor with different water levels.
Proponents also tested the circuit when the AC source is cut and uses the battery as
back-up power source.
56
II. FUNCTIONALITY TESTING
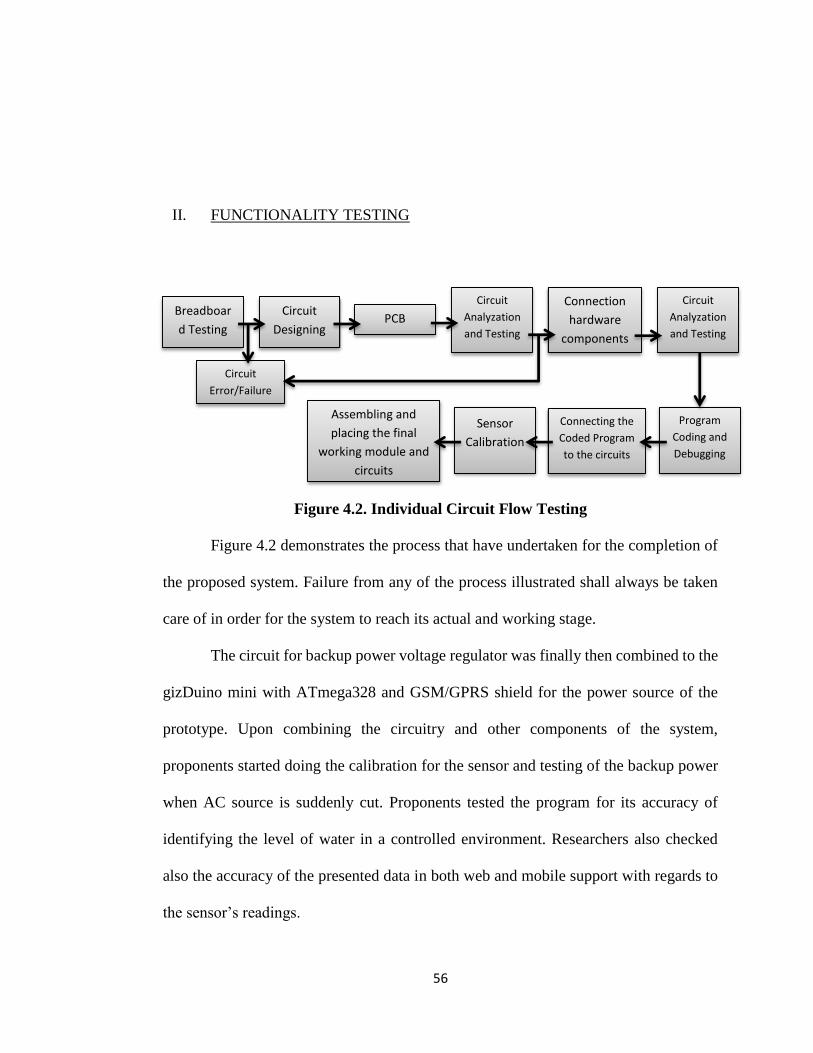
Figure 4.2. Individual Circuit Flow Testing
Figure 4.2 demonstrates the process that have undertaken for the completion of
the proposed system. Failure from any of the process illustrated shall always be taken
care of in order for the system to reach its actual and working stage.
The circuit for backup power voltage regulator was finally then combined to the
gizDuino mini with ATmega328 and GSM/GPRS shield for the power source of the
prototype. Upon combining the circuitry and other components of the system,
proponents started doing the calibration for the sensor and testing of the backup power
when AC source is suddenly cut. Proponents tested the program for its accuracy of
identifying the level of water in a controlled environment. Researchers also checked
also the accuracy of the presented data in both web and mobile support with regards to
the sensor’s readings.
Breadboar
d Testing
Circuit
Designing PCB
Etching
Circuit
Analyzation
and Testing
Connection
hardware
components
Circuit
Analyzation
and Testing
Program
Coding and
Debugging
Connecting the
Coded Program
to the circuits
Sensor
Calibration
Assembling and
placing the final
working module and
circuits
Circuit
Error/Failure
57
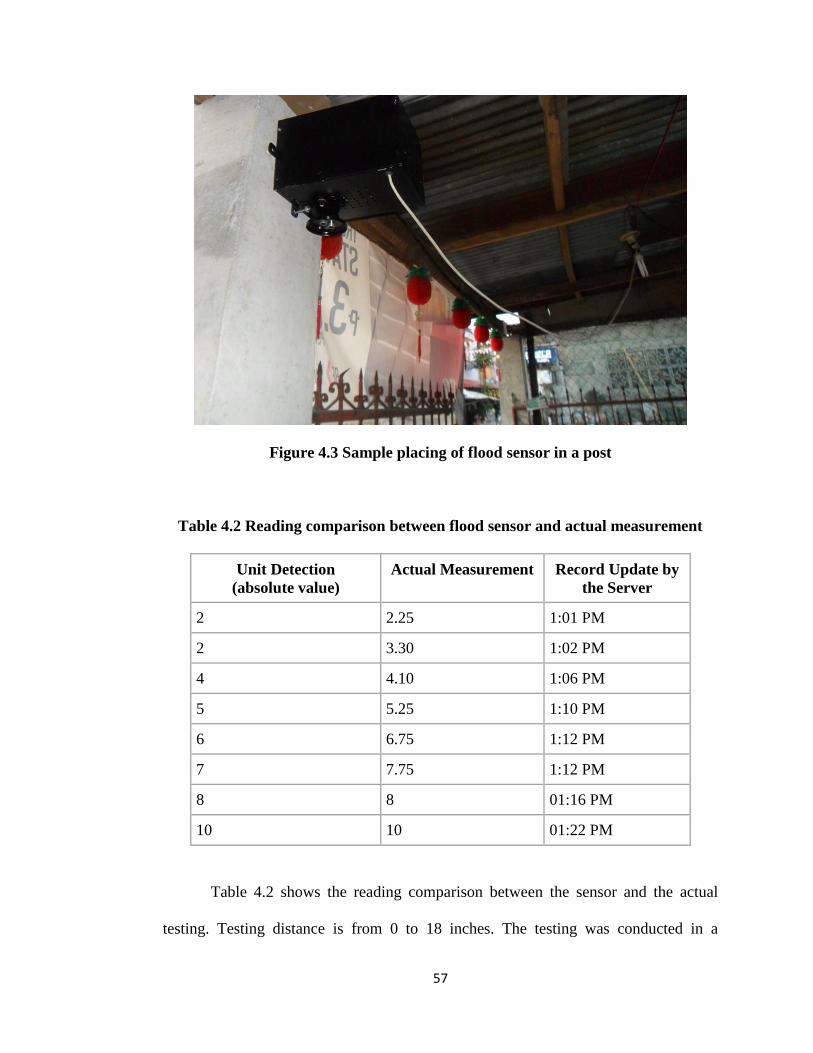
Figure 4.3 Sample placing of flood sensor in a post
Table 4.2 Reading comparison between flood sensor and actual measurement
Unit Detection
(absolute value)
Actual Measurement Record Update by
the Server
2 2.25 1:01 PM
2 3.30 1:02 PM
4 4.10 1:06 PM
5 5.25 1:10 PM
6 6.75 1:12 PM
7 7.75 1:12 PM
8 8 01:16 PM
10 10 01:22 PM
Table 4.2 shows the reading comparison between the sensor and the actual
testing. Testing distance is from 0 to 18 inches. The testing was conducted in a
58
controlled setup that contains a water drum then the researchers varies the amount of
water to correspond different water level height. The testing was conducted on February
7, 2014.
The average percentage error of the flood sensor reading is 7.1730%.
Computation:
𝐴𝑣𝑒𝑟𝑎𝑔𝑒 𝑃𝑒𝑟𝑐𝑒𝑛𝑡𝑎𝑔𝑒 𝐸𝑟𝑟𝑜𝑟 =
𝐴𝑣𝑒𝑟𝑎𝑔𝑒 𝑇𝑟𝑢𝑒 𝑉𝑎𝑙𝑢𝑒−𝐴𝑣𝑒𝑟𝑎𝑔𝑒 𝐸𝑥𝑝𝑒𝑟𝑖𝑚𝑒𝑛𝑡𝑎𝑙 𝑉𝑎𝑙𝑢𝑒
𝐴𝑣𝑒𝑟𝑎𝑔𝑒 𝑇𝑟𝑢𝑒 𝑉𝑎𝑙𝑢𝑒𝑥 100
𝐴𝑉𝑃 = (2+2+4+5+6+7+8+10)−(2.25+3.30+4.10+5.25+6.75+7.75+8+10)
(2+2+4+5+6+7+8+10)𝑥 100
𝐴𝑉𝑃 = 47.4−44
47.4𝑥 100
𝐴𝑉𝑃 = 7.1730%
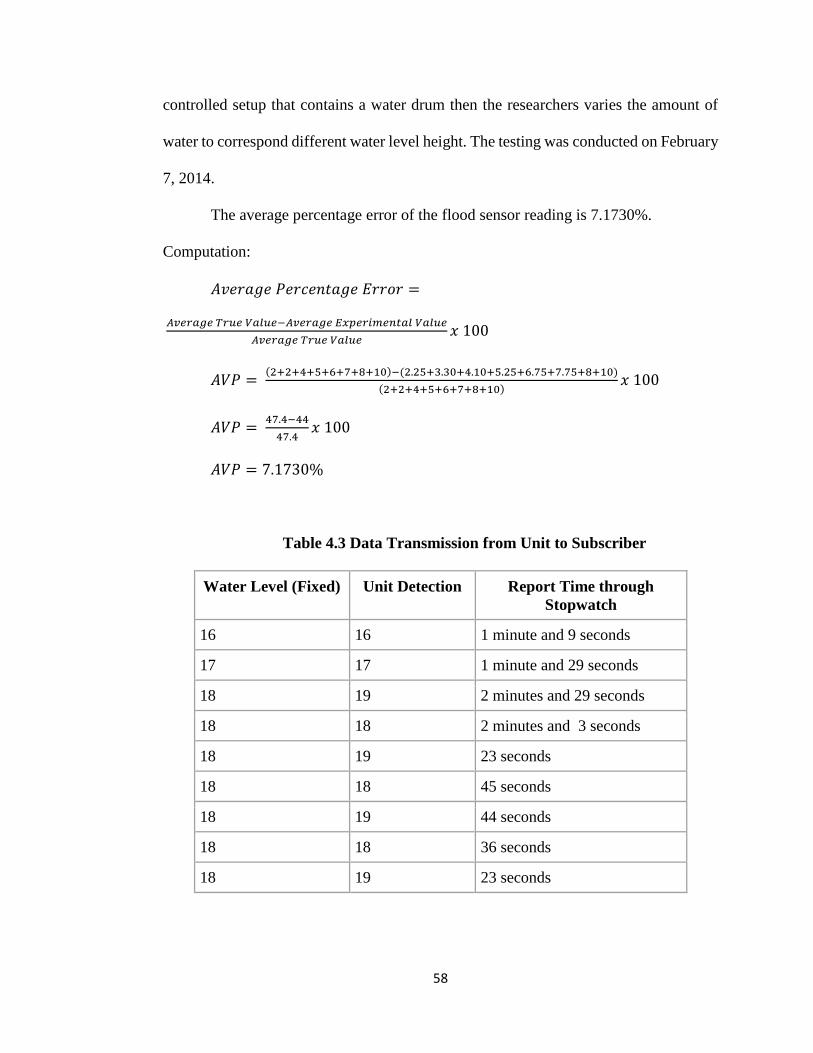
Table 4.3 Data Transmission from Unit to Subscriber
Water Level (Fixed) Unit Detection Report Time through
Stopwatch
16 16 1 minute and 9 seconds
17 17 1 minute and 29 seconds
18 19 2 minutes and 29 seconds
18 18 2 minutes and 3 seconds
18 19 23 seconds
18 18 45 seconds
18 19 44 seconds
18 18 36 seconds
18 19 23 seconds

59
Table 4.3 shows how responsive the API to report about its detection. The
Report Time includes the "RESEND" protocol of the unit device and the RoadFloodPH
Server.
Block Diagram
Figure 4.4 Block Diagram for Charging Circuit Board
From an AC source of 220 Volts, it will pass thru a step-down transformer that
will give of 15 Volts of AC that will be converted into 15 Volts of DC by the bridge
rectifier. The voltage will then be smoothed out by 4, 700 capacitor. After which the
555 Timer will then compare whether the voltage in the battery is to be charge or not.
The 555 timer’s Control Voltage (pin 5) will compare the battery voltage to the Zener
diode’s voltage on whether to continue charging the circuit or not. If the battery voltage
is greater than 13 Volts, comparator output goes high and will set the flip-flop while
turning off the transistor and relay, and thus cutting off the battery charging; if the
battery voltage is below 8.9 Volts (set by us using variable resistor) the lower
comparator will then reset the flip-flop, turning on the transistor and relay, enabling the
battery charging. The regulated voltage of 8 volts will then be passed thru the relay and
into the battery.
60
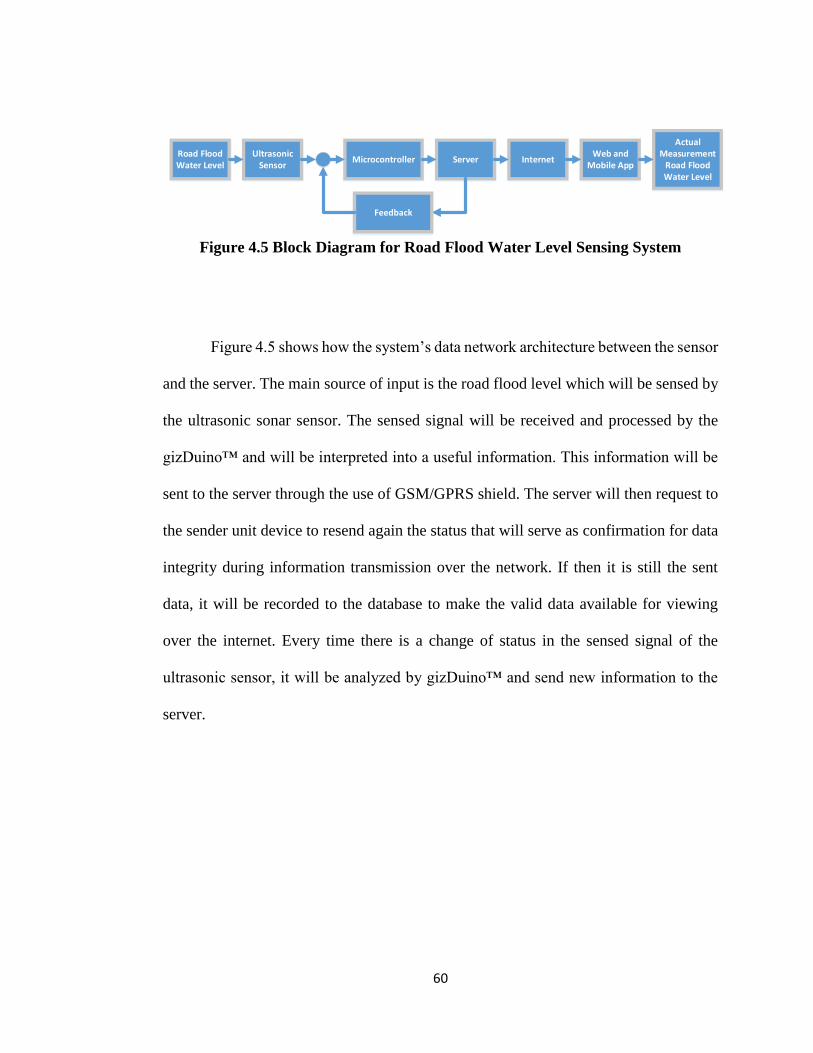
Figure 4.5 Block Diagram for Road Flood Water Level Sensing System
Figure 4.5 shows how the system’s data network architecture between the sensor
and the server. The main source of input is the road flood level which will be sensed by
the ultrasonic sonar sensor. The sensed signal will be received and processed by the
gizDuino™ and will be interpreted into a useful information. This information will be
sent to the server through the use of GSM/GPRS shield. The server will then request to
the sender unit device to resend again the status that will serve as confirmation for data
integrity during information transmission over the network. If then it is still the sent
data, it will be recorded to the database to make the valid data available for viewing
over the internet. Every time there is a change of status in the sensed signal of the
ultrasonic sensor, it will be analyzed by gizDuino™ and send new information to the
server.
Road Flood Water Level
Ultrasonic Sensor
Microcontroller ServerWeb and
Mobile App
Actual Measurement
Road Flood Water Level
Internet
Feedback
LED
Array
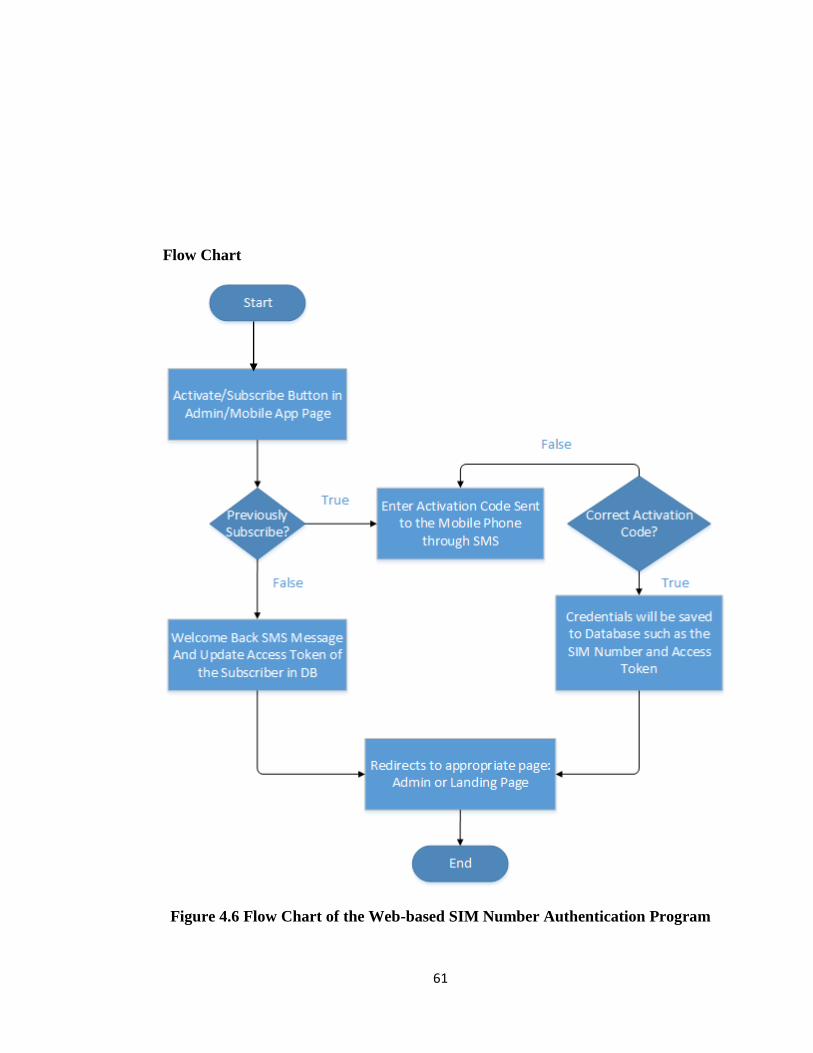
61
Flow Chart
Figure 4.6 Flow Chart of the Web-based SIM Number Authentication Program
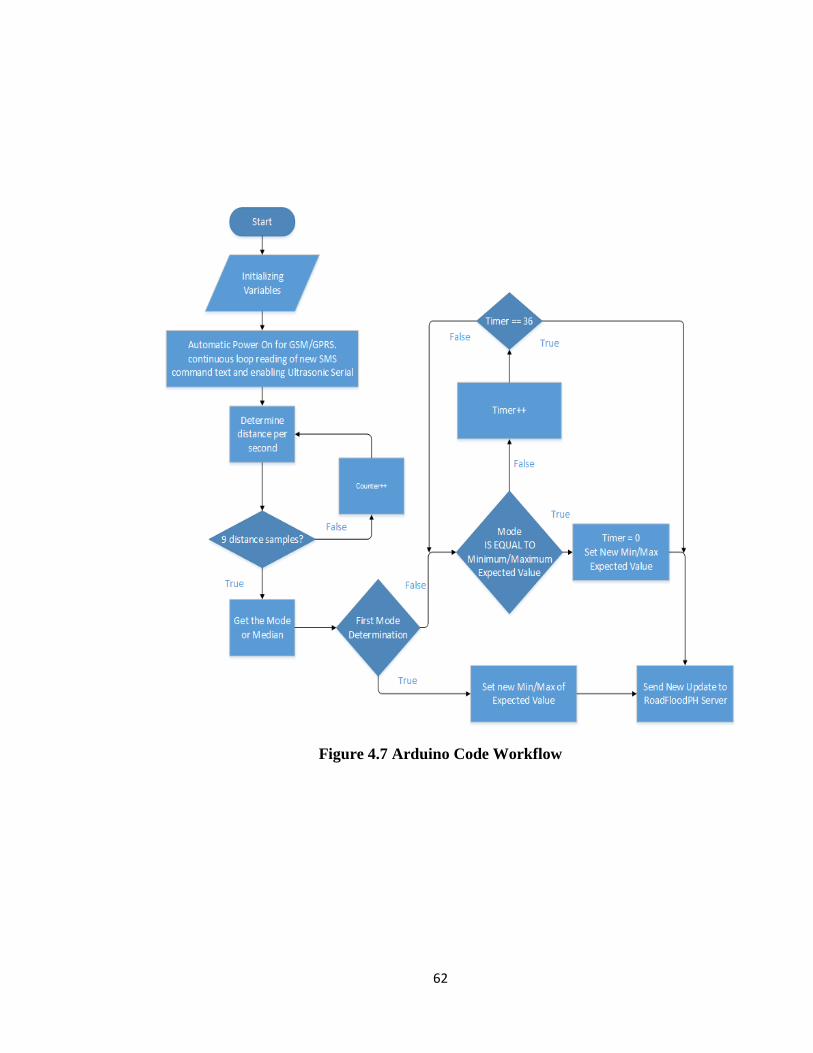
62
Figure 4.7 Arduino Code Workflow
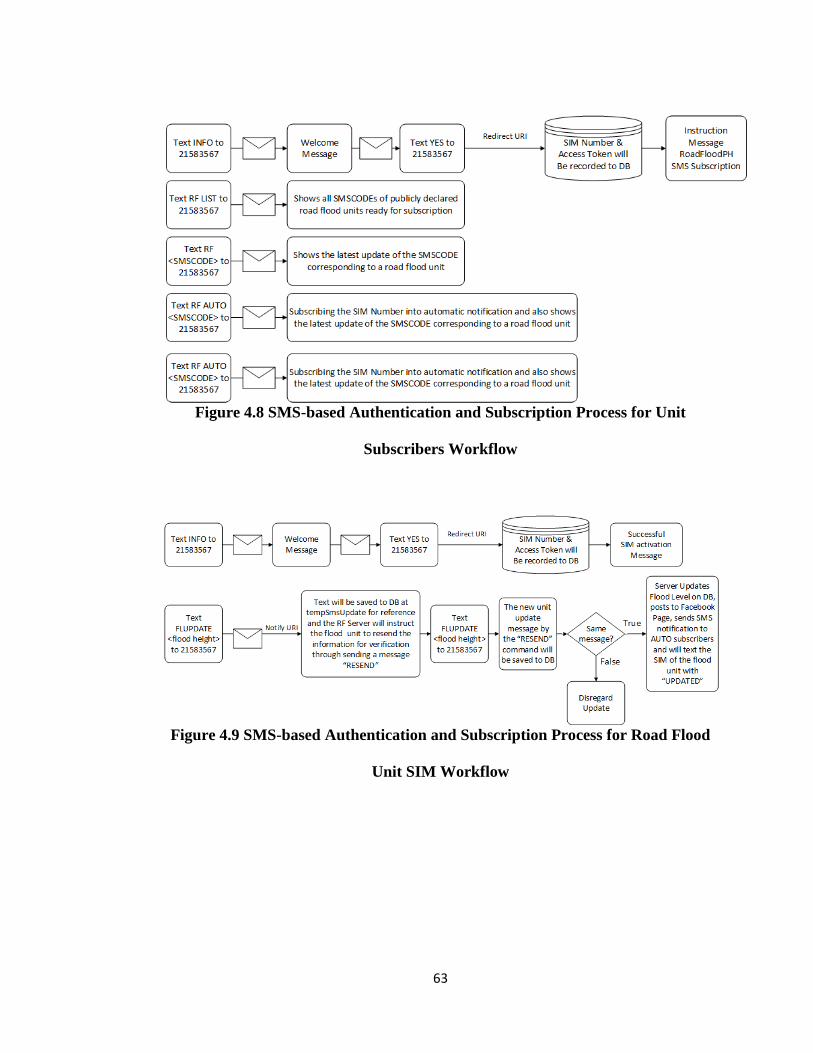
63
Figure 4.8 SMS-based Authentication and Subscription Process for Unit
Subscribers Workflow
Figure 4.9 SMS-based Authentication and Subscription Process for Road Flood
Unit SIM Workflow
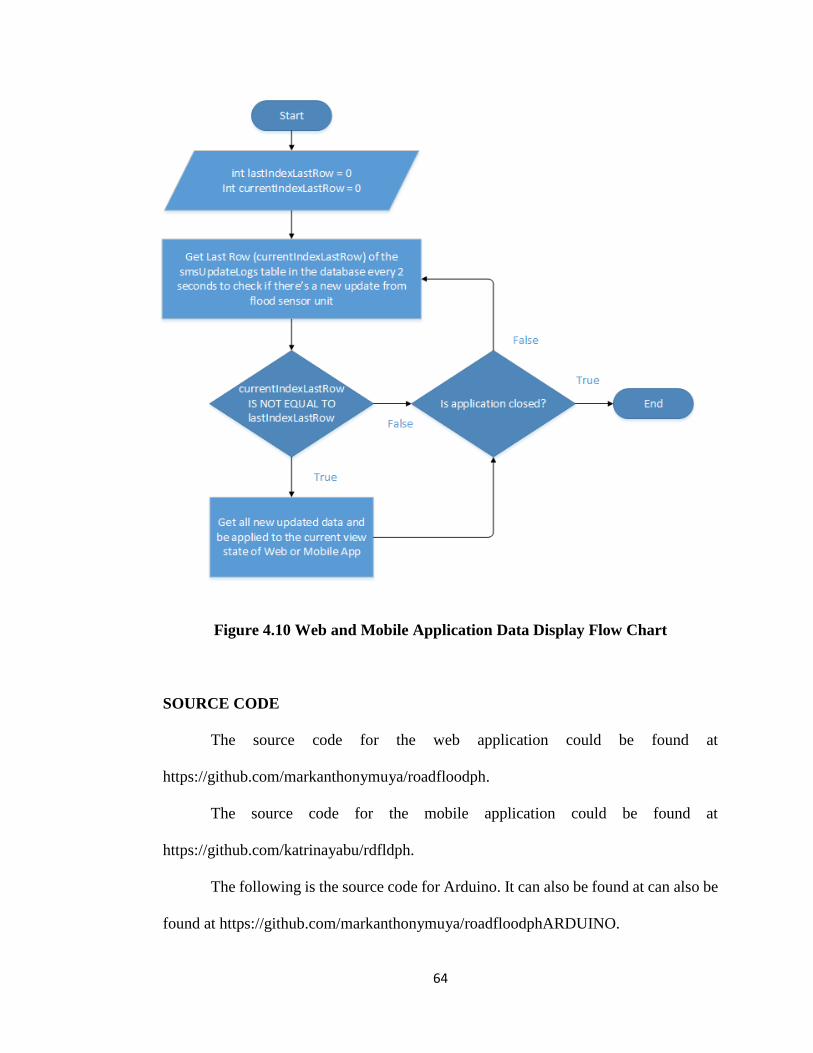
64
Figure 4.10 Web and Mobile Application Data Display Flow Chart
SOURCE CODE
The source code for the web application could be found at
https://github.com/markanthonymuya/roadfloodph.
The source code for the mobile application could be found at
https://github.com/katrinayabu/rdfldph.
The following is the source code for Arduino. It can also be found at can also be
found at https://github.com/markanthonymuya/roadfloodphARDUINO.
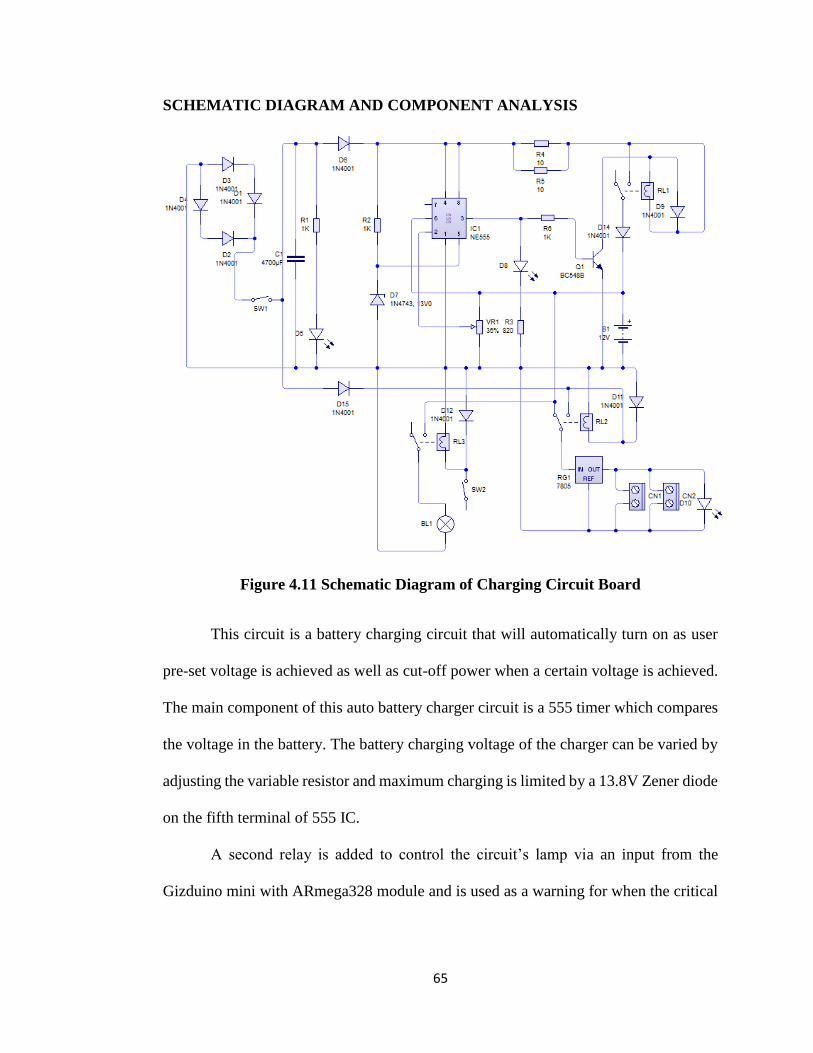
65
SCHEMATIC DIAGRAM AND COMPONENT ANALYSIS
Figure 4.11 Schematic Diagram of Charging Circuit Board
This circuit is a battery charging circuit that will automatically turn on as user
pre-set voltage is achieved as well as cut-off power when a certain voltage is achieved.
The main component of this auto battery charger circuit is a 555 timer which compares
the voltage in the battery. The battery charging voltage of the charger can be varied by
adjusting the variable resistor and maximum charging is limited by a 13.8V Zener diode
on the fifth terminal of 555 IC.
A second relay is added to control the circuit’s lamp via an input from the
Gizduino mini with ARmega328 module and is used as a warning for when the critical
66
water level is achieved. The third relay is used to give the Gizduino module two option
for its source: either direct from the converted AC source or from a DC battery source.
Base from this, the circuit is supplied by both the AC source as well as the 12V
battery that it charges. From the AC source the input voltage is stepped down by the
220-12V step down transformer that is then rectified by the bridge rectifier. As the 555
timer compares the voltage from the Zener diode to the voltage of the battery to know
whether to continue charging or to cut of the circuit. The voltage regulator supplies an
output of 5V to the gizDuino mini with ATmega328 and GSM/GPRS Shield.
Positive terminal of the upper comparator of 555 is connected with 13V in order
to turn OFF the charger if the battery charges above 13V. This 13V is obtained by
connecting a 13V zener in series with a resistor.
If the battery voltage is greater than 13V, comparator output goes high and flip
flop will be set. This turns OFF the transistor and the relay. If the battery voltage is
below the preset voltage (set by proponents), lower comparator will reset the flip flop.
This turns ON the transistor and the relay will switch to charge the battery. The recharge
voltage (preset voltage) can set by varying the variable resistor. Power ON is indicated
by a red LED and charger ON status is indicated by a green LED.
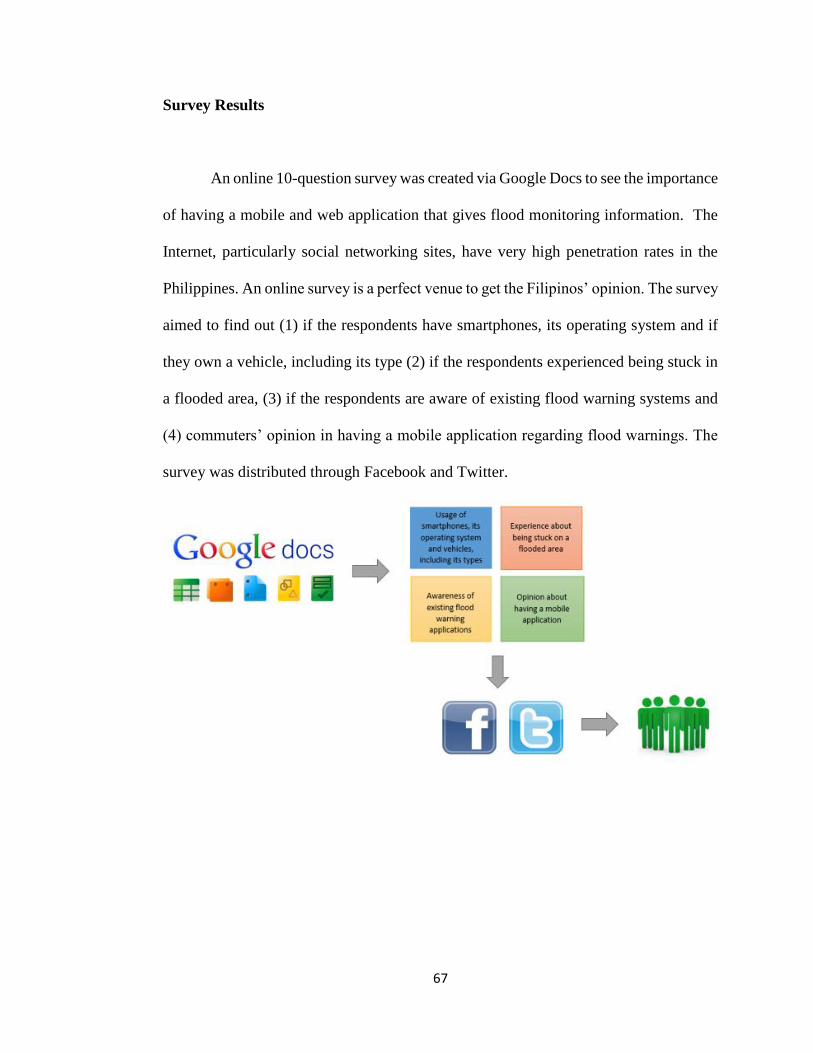
67
Survey Results
An online 10-question survey was created via Google Docs to see the importance
of having a mobile and web application that gives flood monitoring information. The
Internet, particularly social networking sites, have very high penetration rates in the
Philippines. An online survey is a perfect venue to get the Filipinos’ opinion. The survey
aimed to find out (1) if the respondents have smartphones, its operating system and if
they own a vehicle, including its type (2) if the respondents experienced being stuck in
a flooded area, (3) if the respondents are aware of existing flood warning systems and
(4) commuters’ opinion in having a mobile application regarding flood warnings. The
survey was distributed through Facebook and Twitter.
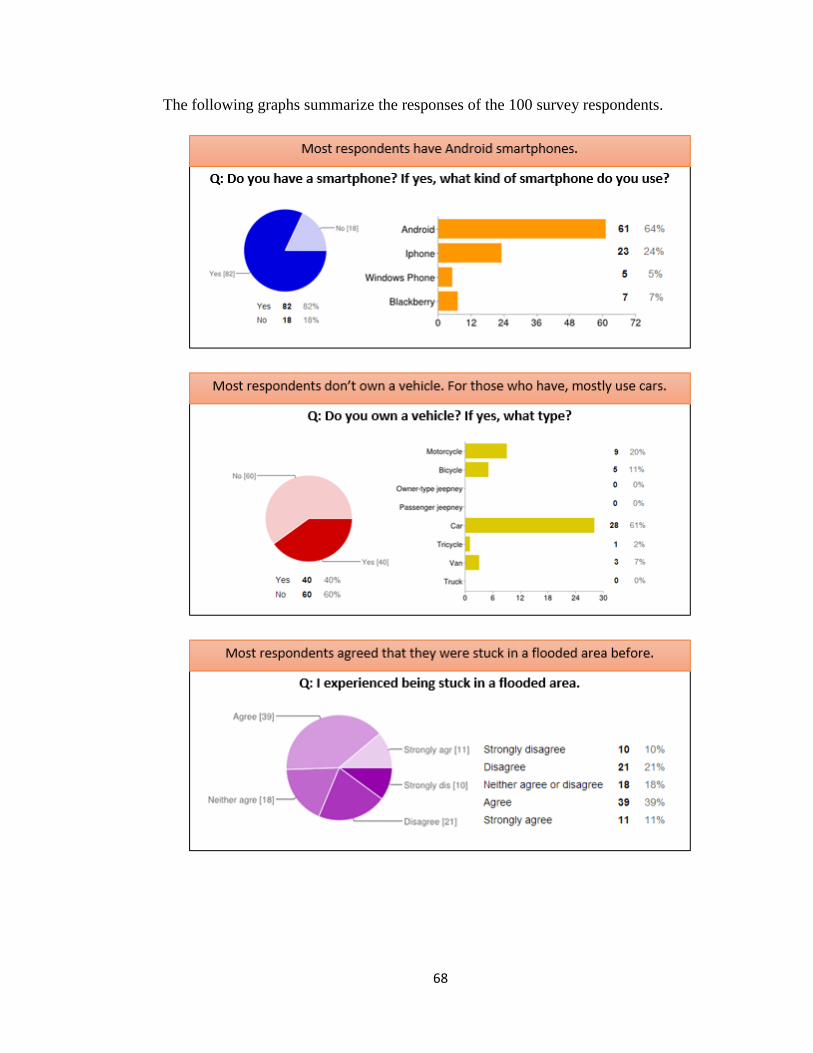
68
The following graphs summarize the responses of the 100 survey respondents.
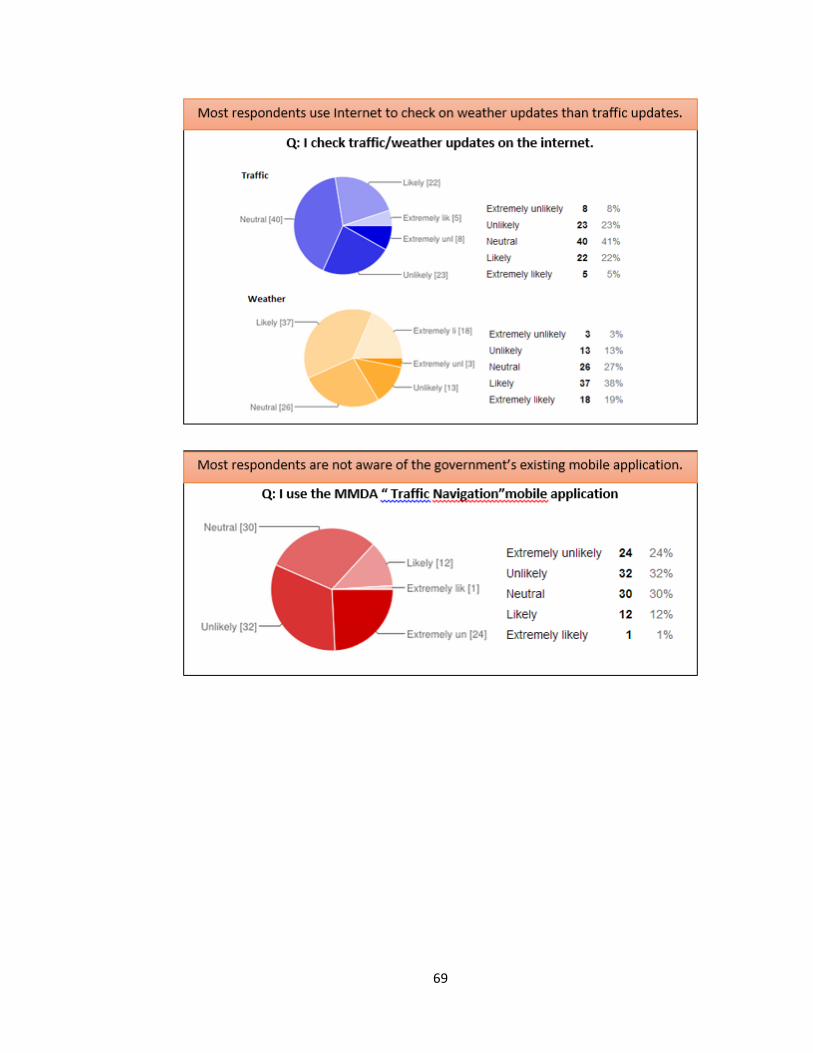
69

70
Cost and Benefit Analysis
This includes the materials used in the implementation of the design project.
Table 4.4 List of Materials Used
Material Quantity Cost
10 Ohms 10W Resistor 2 pcs. P 10.00/pc
1K Ohms Resistor 3 pcs. P 0.25/pc
820 Ohms Resistor 1pc. P 0.25
10K Ohms Variable Resistor 1 pc. P 10.00
1N4001 Diode 10 pcs. P 1.00/pc
1N4743, 13V0 Zener Diode 1 pc. P 2.50
4.7KuF Capacitor 1 pc. P 35.00
7806(6V, 1A) voltage Regulator 1 pc. P 20.00
NE555 Bipolar Timer 1 pc. P 10.00
BC548B NPN Transistor 1 pc. P 2.50
6V Relay 3pcs. P 18.00
LED(RED, GREEN) 3 pcs. P 1.00/pc
Transformer (220V-15V AC) 1 pc. P 160.00
IC Holder(8-pin) 1 pc. P 5.00
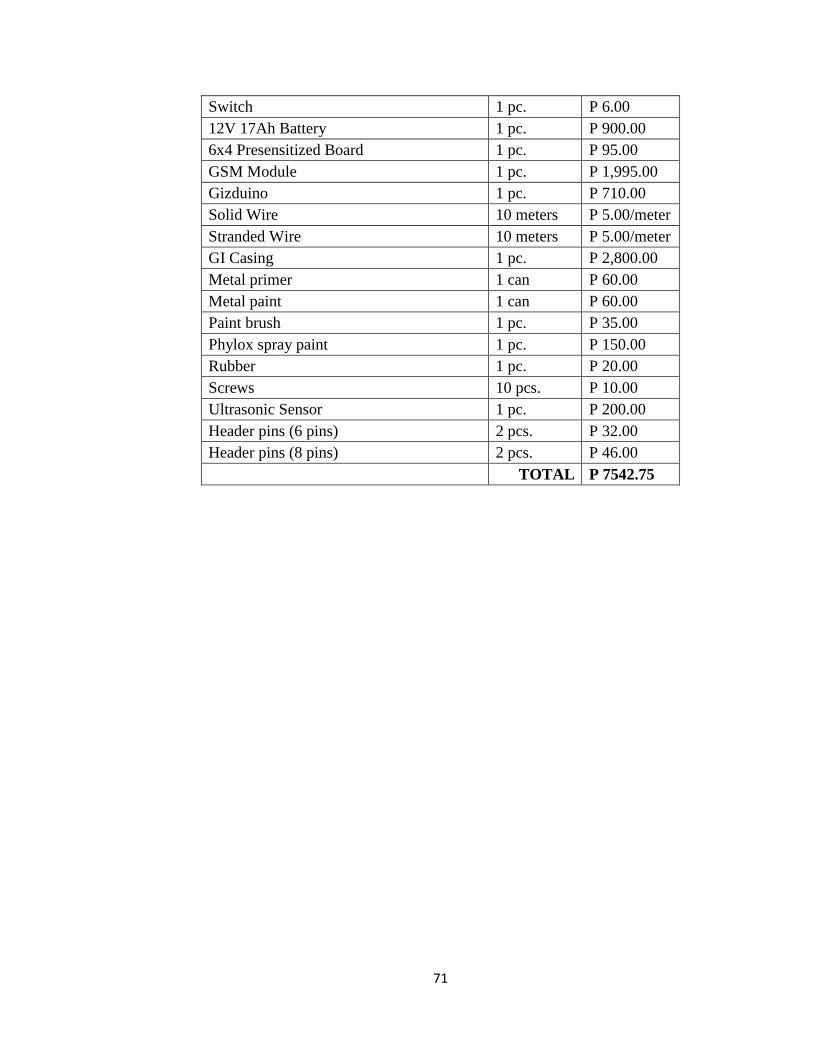
71
Switch 1 pc. P 6.00
12V 17Ah Battery 1 pc. P 900.00
6x4 Presensitized Board 1 pc. P 95.00
GSM Module 1 pc. P 1,995.00
Gizduino 1 pc. P 710.00
Solid Wire 10 meters P 5.00/meter
Stranded Wire 10 meters P 5.00/meter
GI Casing 1 pc. P 2,800.00
Metal primer 1 can P 60.00
Metal paint 1 can P 60.00
Paint brush 1 pc. P 35.00
Phylox spray paint 1 pc. P 150.00
Rubber 1 pc. P 20.00
Screws 10 pcs. P 10.00
Ultrasonic Sensor 1 pc. P 200.00
Header pins (6 pins) 2 pcs. P 32.00
Header pins (8 pins) 2 pcs. P 46.00
TOTAL P 7542.75
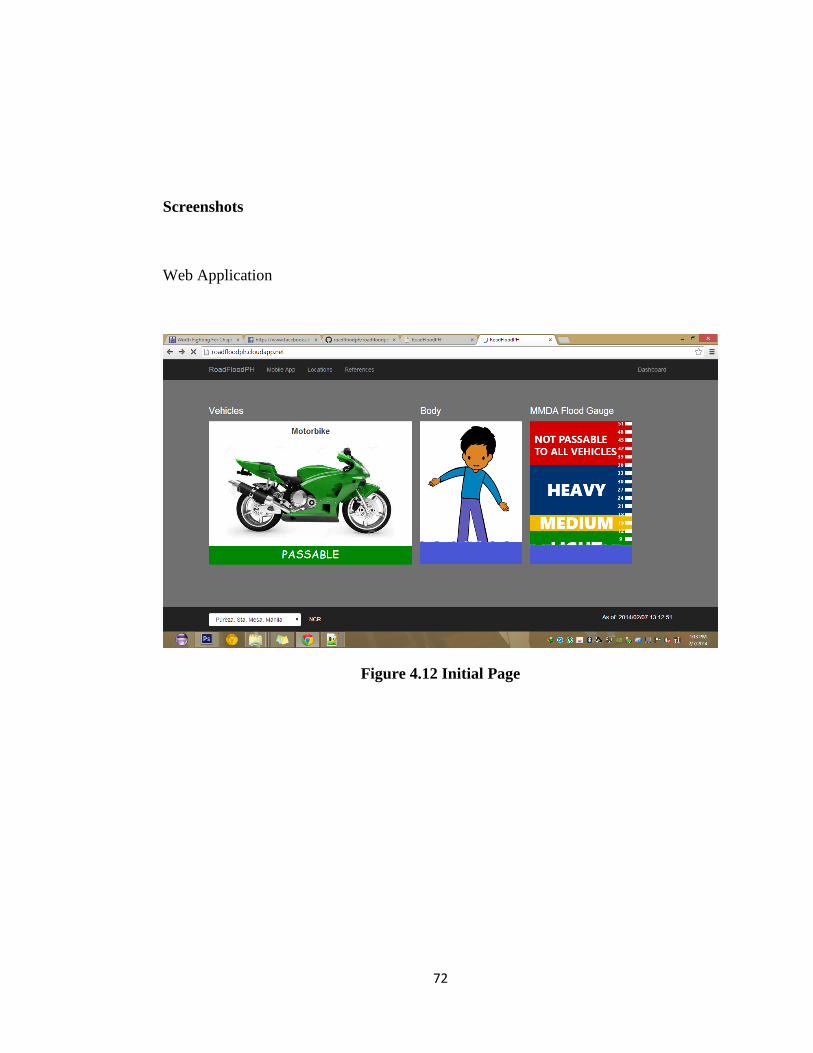
72
Screenshots
Web Application
Figure 4.12 Initial Page
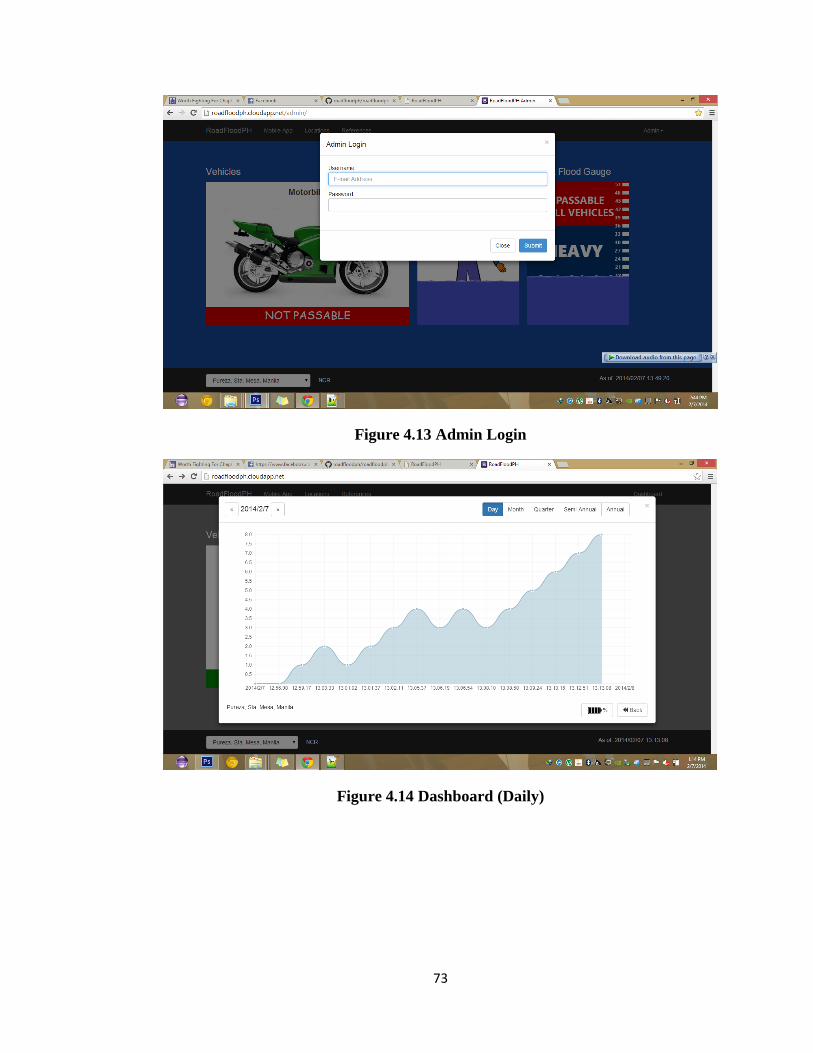
73
Figure 4.13 Admin Login
Figure 4.14 Dashboard (Daily)

74
Figure 4.15 Locations Page
Figure 4.16 Reference Page
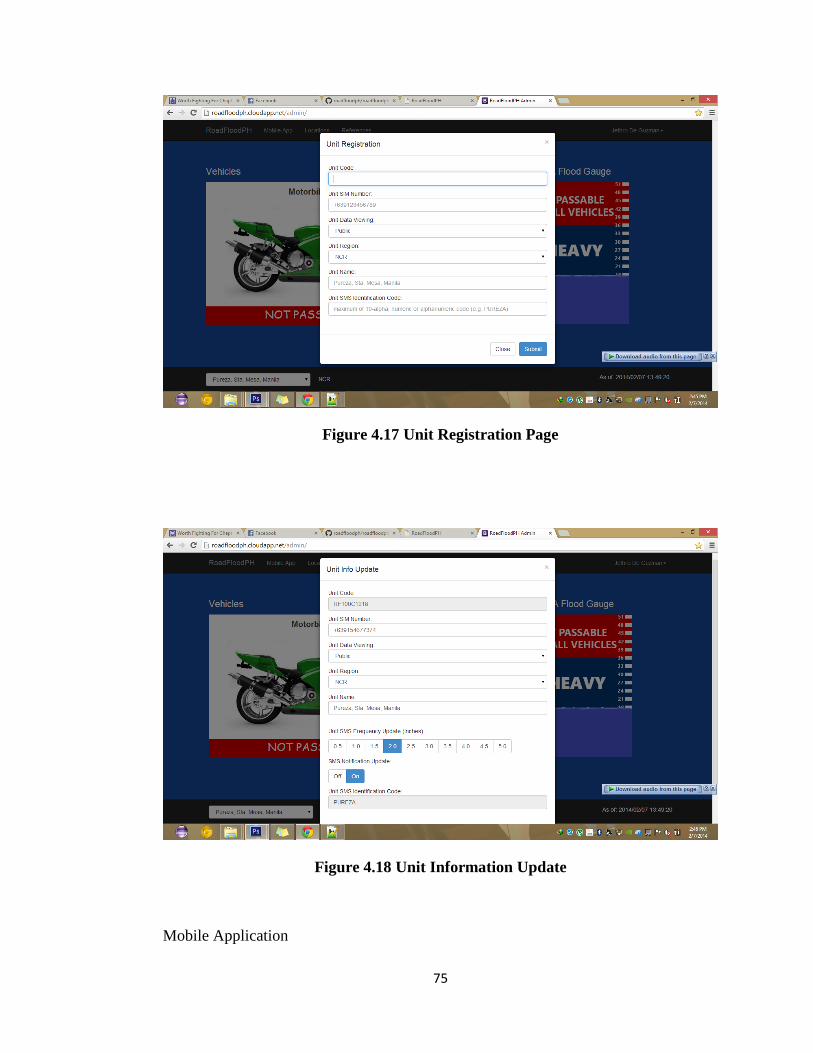
75
Figure 4.17 Unit Registration Page
Figure 4.18 Unit Information Update
Mobile Application
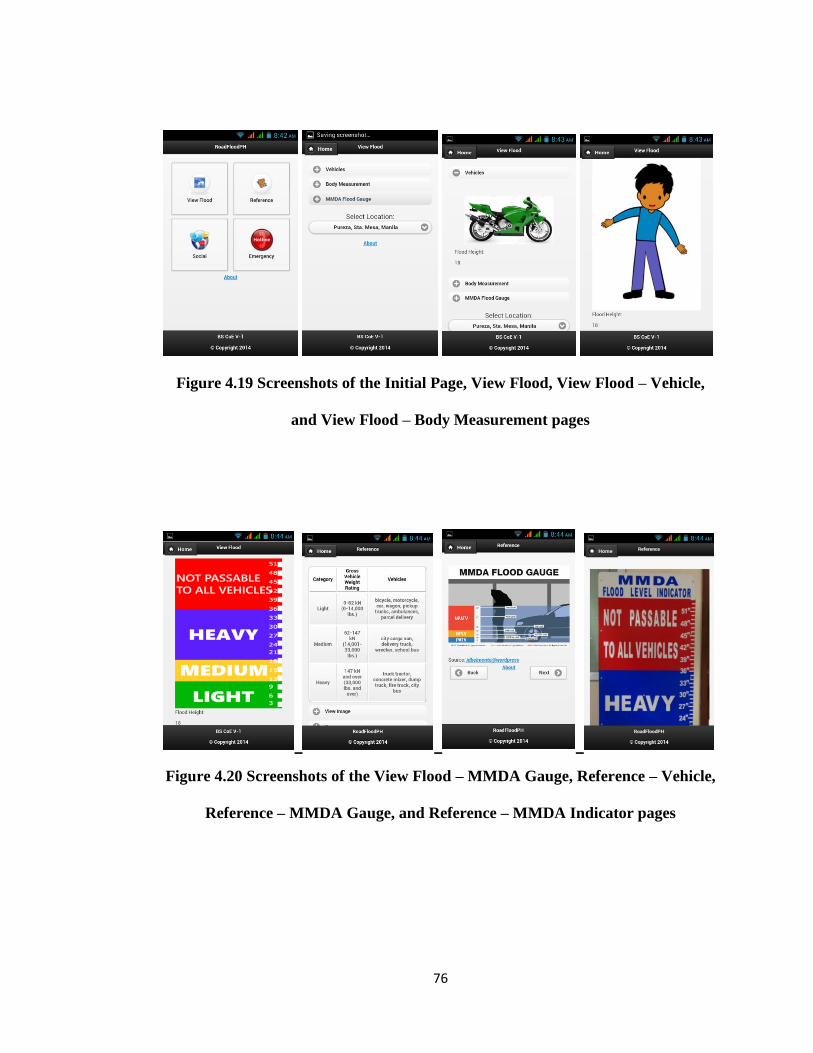
76
Figure 4.19 Screenshots of the Initial Page, View Flood, View Flood – Vehicle,
and View Flood – Body Measurement pages
Figure 4.20 Screenshots of the View Flood – MMDA Gauge, Reference – Vehicle,
Reference – MMDA Gauge, and Reference – MMDA Indicator pages
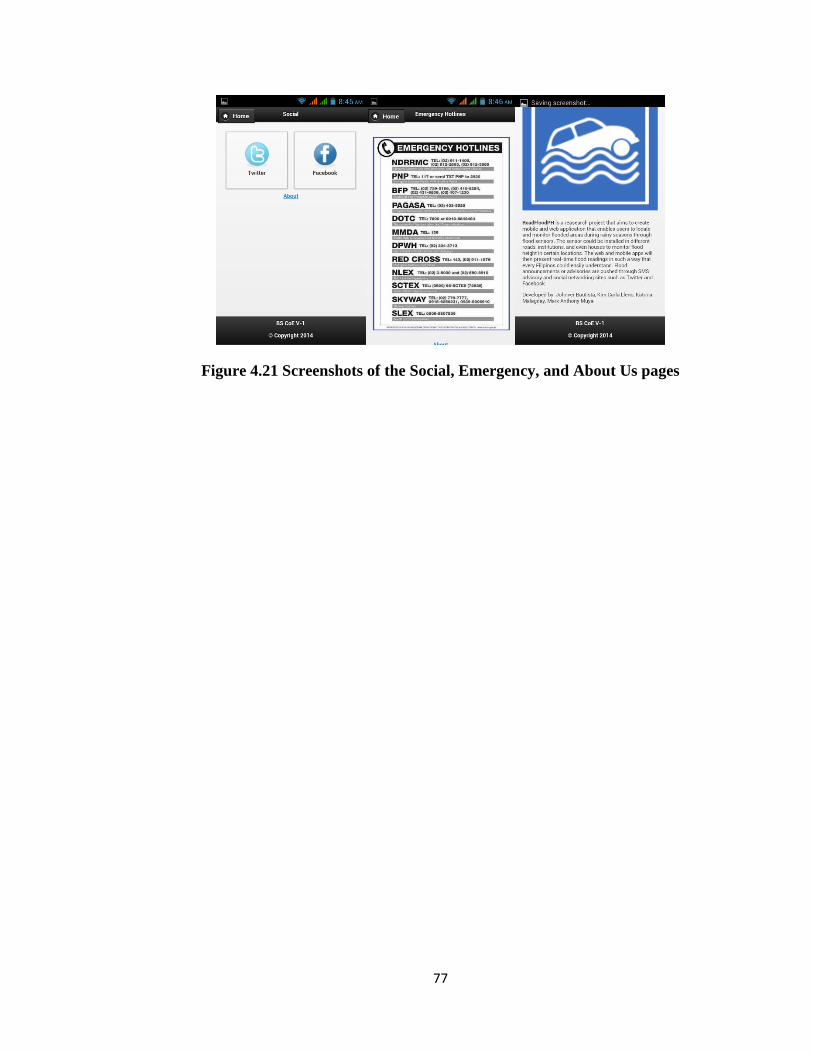
77
Figure 4.21 Screenshots of the Social, Emergency, and About Us pages
Chapter 5
SUMMARY, CONCLUSIONS AND RECOMMENDATIONS
This chapter presents the final findings, ideas, concepts and added recommendations
for future development regarding the composition of the whole system.
Summary
The study is about a road flood sensor that automatically sends flood level
through SMS and data then interpreted through RoadFloodPH mobile and web
applications as well as SMS subscription. It seeks to develop and answer the following
questions:
4. How can the design project help the locals measure flood height on roads?
5. What mobile and web application can help commuters be informed about
passable and unpassable roads due to flood?
6. How can the design project help the dissemination of information on an
impassable road and its height to the locals during rainy season?
Proponents did researching through different government agencies and through
comparisons of different flood monitoring devices and web/mobile applications.
Researchers reviewed how the government distributes flood related information
79
specifically through Project NOAH as well as how locals perceive early flood warning
announcements. The comparisons were done to give us basis in making the prototype.
Next, proponents search information on the accuracy of ultrasonic sensors that shall
determine the flood level reading. Upon completion, researchers executed accuracy
testing of the flood sensor and the responsiveness of the web and mobile applications
support.
Conclusion
Based from the existing means of reporting flooded roads in the Philippines, the
proponents have concluded that the flood sensor could measure the height of flood and
the measurement data can be distributed to different users that have access to the web
and mobile apps. Instead of the existing ways of measuring and reporting flooded areas,
which are through CCTV cameras and the Flood Patrol Application (extended app of
Project NOAH), using this device will save time and effort and has real-time update.
The RoadFloodPH apps also indicate passable and impassable roads and will help
commuters to avoid getting stuck in an impassable road by accessing them. The flood
sensor could be portable and installed not only on roads but as well as different
institutions that experience flooding. By accessing the apps and subscribing to
RoadFloodPH SMS, users could easily get real-time information on monitoring flooded
areas.
80
Recommendation
The prototype itself of the device can really be still enhanced; its composition,
color or even making it more minimal.
It is strongly recommended to have a smaller battery bank.
In setting up the flood sensor, it is recommended to put fence to avoid garbage
from getting read by the sensor.
It is also recommended to have another sensor, a water sensor, to be attached at
the bottom of the post so that the ultrasonic sensor will only be activated when
water is detected.
The data or flood reading gathered by the sensor is recommended to be pushed
through Project NOAH since the existing way of collecting flood level data in
certain areas are only through the Flood Patrol application and CCTV cameras
deployed in certain areas as well as MMDA partnered citizen reporters.
It is highly recommended that the sensor must be setup in a post beside a
sidewalk with partnership with a local government.