Embed Size (px)
Citation preview

Participation of Smallholders in Production and Marketing of Commercial Crops: The
Case of Sesame in Diga
Geremew Kefyalew, Kindie Getnet, Wassie Berhanu, Katherine Snyder and Simon Langan
MSc thesis (International Economics) Addis Ababa University
December 2012

Outline
1. Introduction
2. Sesame production and marketing in Diga
3. The study Setting
4. Results and discussion
5. Conclusions and recommendations

1. Introduction
• Agriculture the underpinning of Ethiopian economy
. employment (>85%) . export (>90%) . GDP(>42%)

• Dominated by smallholder sub-sector . covers > 95 % of agricultural output .Major source of agricultural growth . characterized by: . rainfed (only 13 % irrigated) . subsistence . low productivity

• Government priority (PASDEP, ADLI, GTP)
. Productivity growth
. Smallholder commercialization (market –
oriented crop productions)

• Advantage of market-oriented crops
. livelihood diversification
. export-revenue
. poverty reduction

2. Sesame production and marketing in Diga
• Diga– One of the N4 sites– high potential for agriculture (land, water, market
access)– Mixed crop-livestock farming system– Livelihood improvement could be assisted through
better participation of smallholders in sesame production and marketing

• The scene in sesame production and marketing- Smallholders differently respond to the available potential and opportunities- Currently only about 29% of the potential arable land cultivated under sesame

3. The study setting
A. The research questions. What factors, in addition to water, determine livelihood improvement from cash crop production?
. Is production potential supported with market potential, market access, and market participation?
B. Hypothesis - Water translate to livelihood development through production and
market participation - Other internal and external factors influence the possibility to
change the production potentials into livelihood advantages
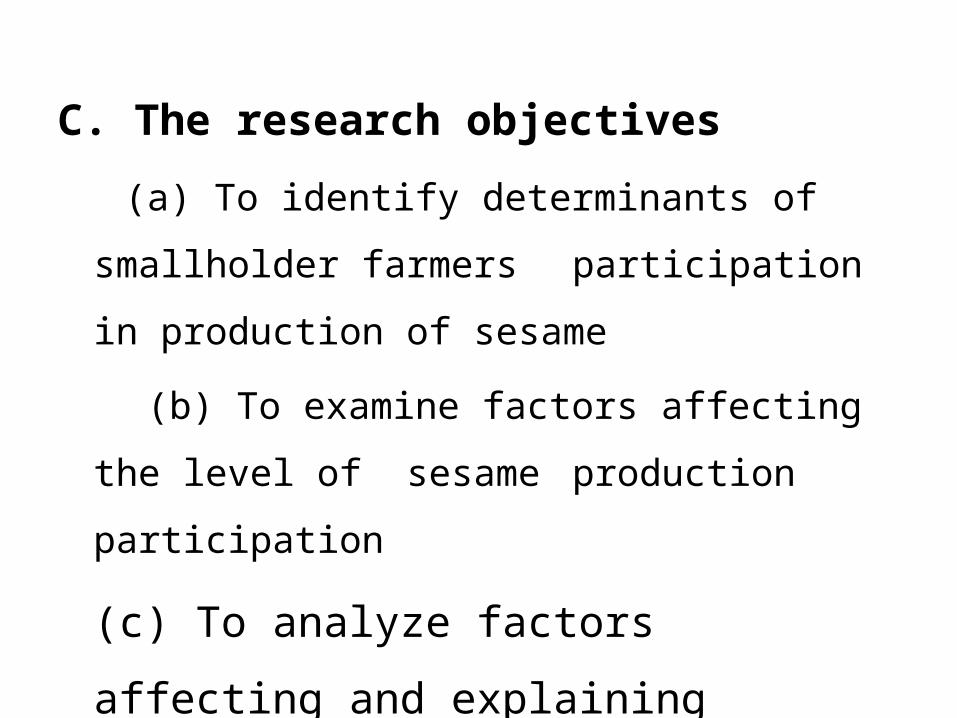
C. The research objectives
(a) To identify determinants of smallholder farmers
participation in production of sesame
(b) To examine factors affecting the level of sesame
production participation
(c) To analyze factors affecting and explaining
marketing of sesame
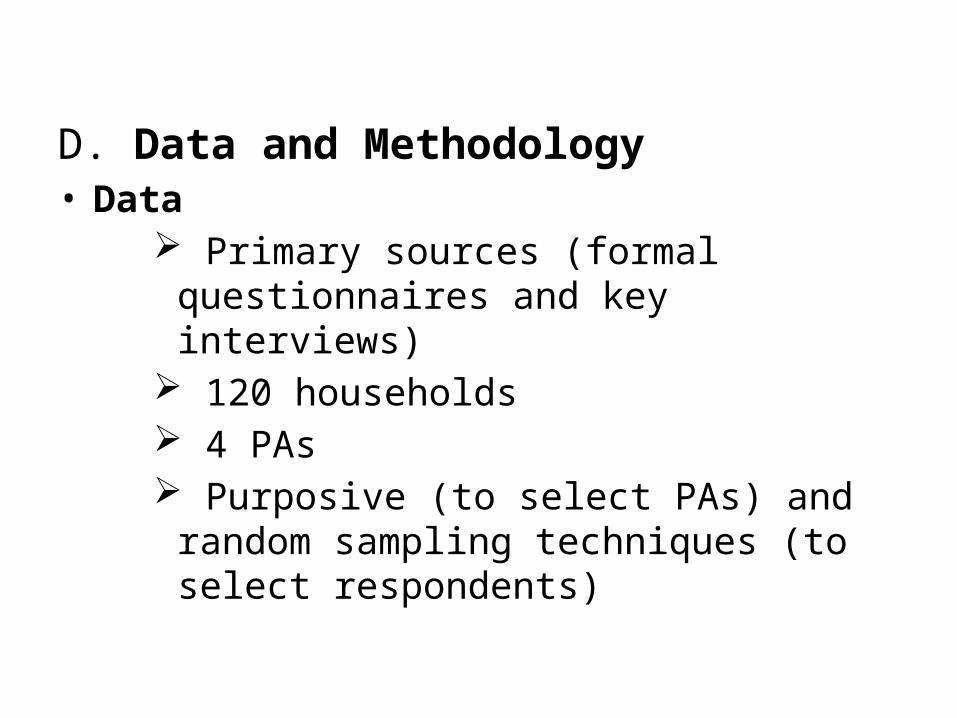
D. Data and Methodology• Data
Primary sources (formal questionnaires and key interviews)
120 households 4 PAs Purposive (to select PAs) and random sampling
techniques (to select respondents)
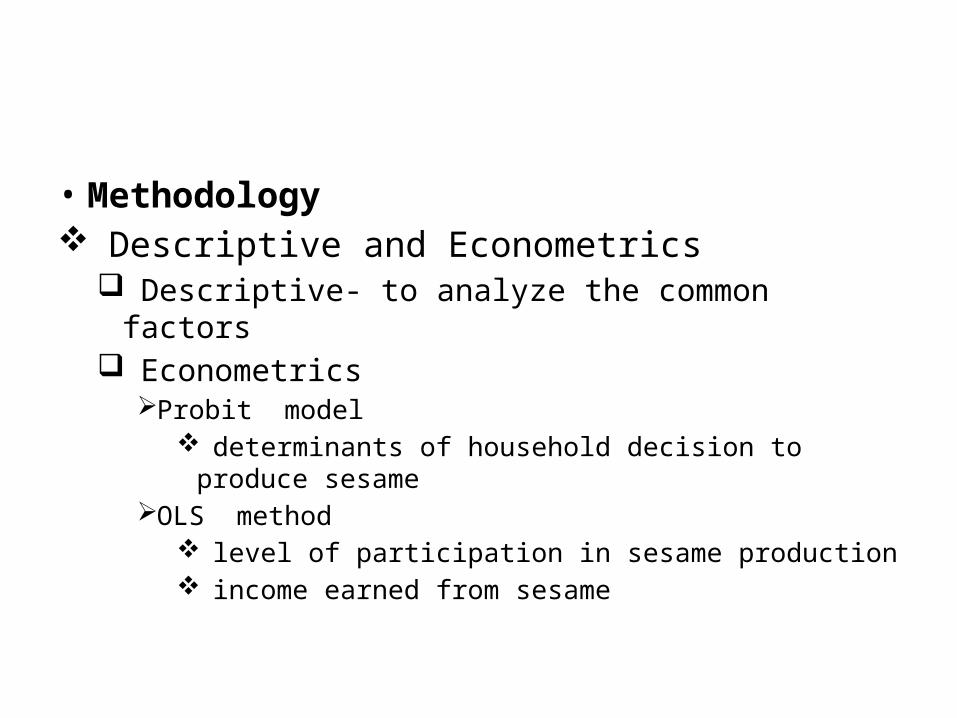
• Methodology Descriptive and Econometrics
Descriptive- to analyze the common factors Econometrics
Probit model determinants of household decision to produce
sesameOLS method
level of participation in sesame production income earned from sesame

Variables considered.external factors
access to institutional services access to input and output markets
.internal (household specific) factors asset endowmentshh characteristics

E. Specification tests
Multicollinearity problem
. Variance inflating factors (VIF) for continuous variables
. Contingency Coefficient (CC) for discrete variables
. Results - no serious correlation among explanatory
variables (in all cases and models)

Sample selection bias Heteroskedasticity – robust standard error
(corrected S.E.) Endogeneity problems
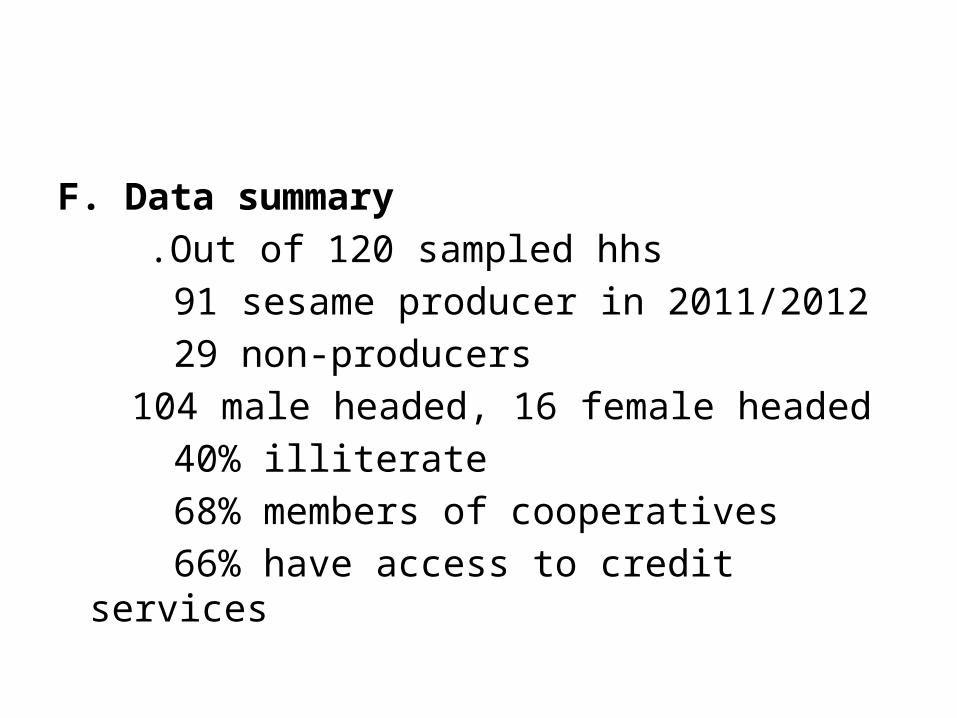
F. Data summary .Out of 120 sampled hhs 91 sesame producer in 2011/2012 29 non-producers 104 male headed, 16 female headed 40% illiterate 68% members of cooperatives 66% have access to credit services

92.5 % own land3.24 ha- average landholding0.75 ha-average cultivated land under
sesame96 % use oxen for cultivation1.63 average sesame produced (in quintal)2.53 average crop-yield (quintal per
hectare)

4. Results and discussion
• Descriptive results Crop production –main source of agrl.
income Sesame - major cash crop in the area
Major sesame production constraints:
. No improved seed varieties . Pest and disease problems . Low technology applications (fert.)

• Sesame marketing constraints
. High transaction costs
. Lack of trust on traders (scale cheating)
. Traders set the price (predetermined)

•Econometric results1. Determinants of sesame Production participation – probit regression
VARIABLES MARGINAL ROBUST P>|z|
EFFECTS (dF/dx) STAND.ERR.
Age of hh head -.000 .000 0.981
Educational level of hh -.000 .000 0.862
Active family labour .002** .003 0.050
Landholding size .017*** .024 0.000
Number of donkey owned .003** .006 0.024
Number of oxen owned .004*** .006 0.006
Member to cooperatives .010 .019 0.189
Access to credit .011** .018 0.040
Access to non-farm activity .002 .004 0.240
Family food availability .032** .055 0.019
Distance from extension -.0001** .000 0.036
Distance from nearest market -.000 .000 0 261
*** Significance level at 1 percent probability ** Significance level at 5 percent probabilityPseudo R-square = 0.8254 Prob > chi-square = 0.0000
Source:, survey result,, 2012,

• 12 potential variables included (8 cont., 4 disc)• 7 variables significant
Number of active family labour Household landholding size Number of oxen owned Number of donkey owned Availability of family food for the whole year Access to credit Distance from hh home to extension centers

2. Level of sesame production participation - OLS regression
VARIABLES COEFFICIENTS R.Std.Err. P>t
Landholding size .010 .043 0.805
Active family labour .262*** .068 0.000
Access to credit .533*** .178 0.004
Educational level of hh .014 .035 0.687
Household gender -.313 .298 0.296
Crop yield .181*** .053 0.001
Sesame farming experiences .379** .163 0.023
Production problems -.135 .242 0.579
Number of oxen owned .27** .121 0.029
Constant .80 .544 0.143
*** significance of the coefficient at less than 1 percent probability level
** Significance of the coefficient at less than 5 percent probability level
Prob > F = 0.0000
R-squared = 0.4756
Source: survey result, 2012
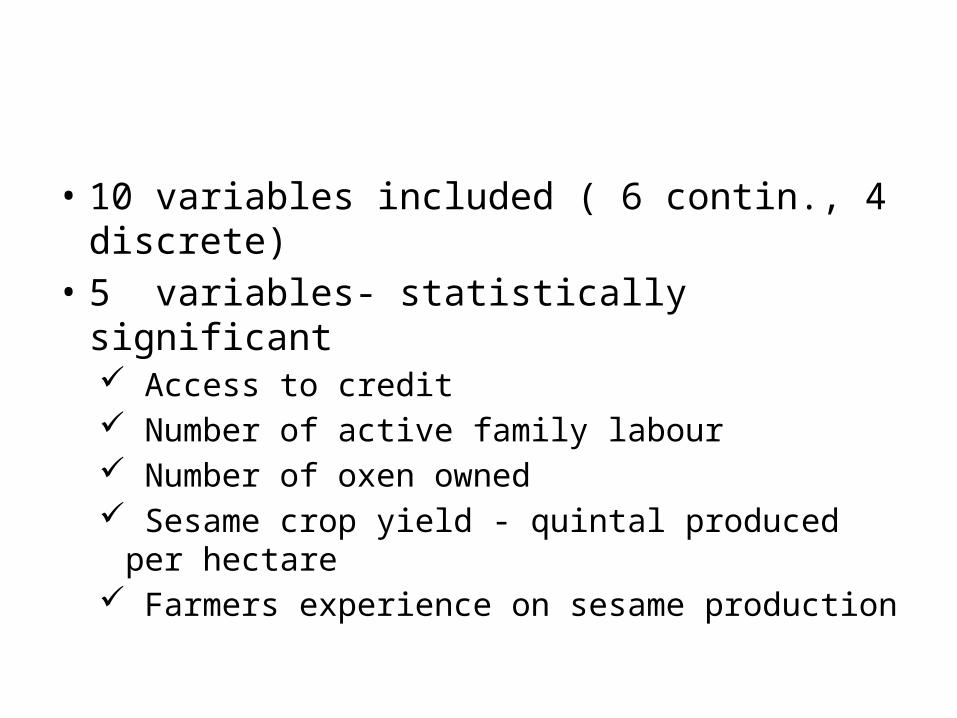
• 10 variables included ( 6 contin., 4 discrete)• 5 variables- statistically significant
Access to credit Number of active family labour Number of oxen owned Sesame crop yield - quintal produced per hectare Farmers experience on sesame production

3. Level of income generated from sesame sale - OLS regressionDependent Variable: Earned income from sesame sale (gross)
VARIABLES COEFFICIENTS Robust S.E. P>|t|
Amount of sesame marketed 1435.10*** 43.10 0.000
Access to market information 302.27*** 90.34 0.001
Time of Sell: IMMIDIATE-reference
One month later -after harvest -147.28 123.20 0.236
Two months later-after harvest -231.35* 116.35 0.051
Three months later- after harvest -442.81** 171.03 0.012
Selling Channels: DIRECT-reference
Selling through Brokers 97.92 93.90 0.301
Sesame market price p 87.93*** 25.46 0.001
Traveling time to nearest market -1.70 *** 0.64 0.010
Major buyers: Local traders-reference
Selling to cooperatives 145.20** 71.17 0.045
Selling to traders 21.62 82.26 0.793
CONSTANT 1318.57*** 464.03 0.006
*; **, **** indicates the statistical significance of the coefficients at 10%, 5% and 1% probability levels, respectively.
Prob > F = 0.0000
R-squared = 0.9718
Source: Survey result, 2012

• 12 potential variables entered regression• 7 variables- have significant estimated
coefficients Amount of sesame marketed) Access to market information Selling sesame after 2 months Selling sesame after 3 moths Sesame selling price at market Selling to cooperatives Traveling time to nearest market

5. Conclusions and recommendations
• Prod. potential necessary but not sufficient condition for livelihood development through sesame production
• Household specific factors significantly influences sesame production and marketing participation
• Institutional factors (credit, cooperatives) found to be important in all stages of sesame production processes

• Recommendations: Provision of improved sesame seed varieties that
properly fits the Wereda’s agro-ecology Development and broadening the basis of institutional
services (credit, cooperatives, contract farming) Developing sustainable sesame diseases and pest
infestation control mechanisms Provision of reliable information (on production and
marketing) in regular basis

Thank you