Embed Size (px)
Citation preview
15th of December 2014
Successful mHealth App Publishing
mHealth Summit Israel 2014
2© research2guidance 2014
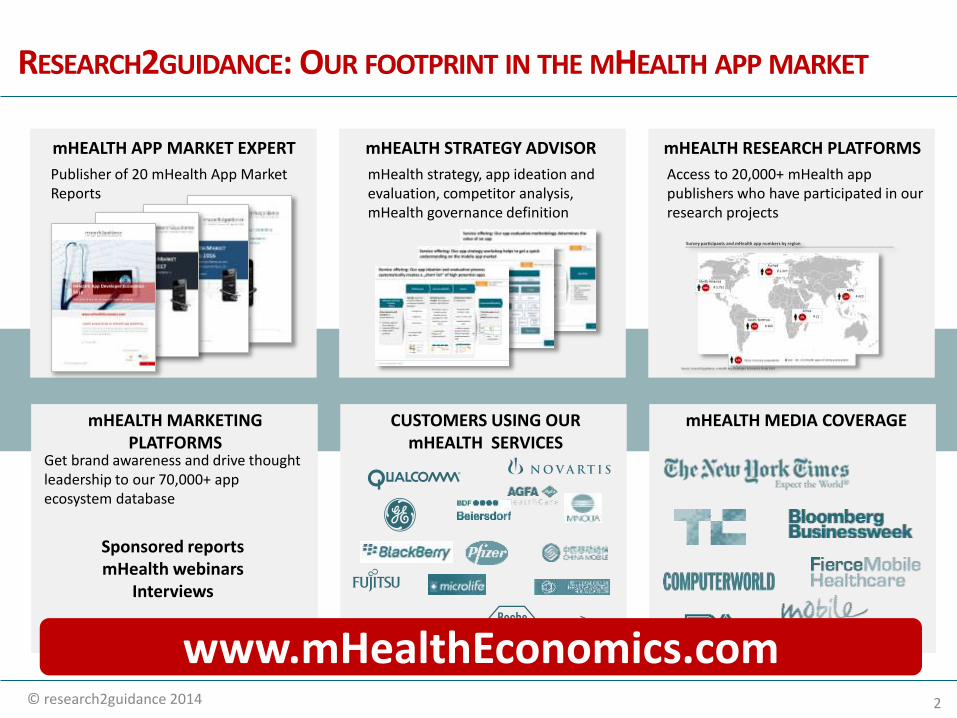
RESEARCH2GUIDANCE: OUR FOOTPRINT IN THE MHEALTH APP MARKET
mHEALTH APP MARKET EXPERT
Publisher of 20 mHealth App Market Reports
mHEALTH STRATEGY ADVISOR
mHealth strategy, app ideation andevaluation, competitor analysis, mHealth governance definition
mHEALTH RESEARCH PLATFORMS
Access to 20,000+ mHealth app publishers who have participated in ourresearch projects
mHEALTH MEDIA COVERAGECUSTOMERS USING OUR mHEALTH SERVICES
Get brand awareness and drive thought leadership to our 70,000+ app ecosystem database
mHEALTH MARKETING PLATFORMS
Sponsored reportsmHealth webinars
Interviews
www.mHealthEconomics.com
3© research2guidance 2014
Successful mHealth AppsPublishing
1. Make sure your app is state of theart
2. Get your users locked in
3. Find the right role
4. Find the right business model
4© research2guidance 2014
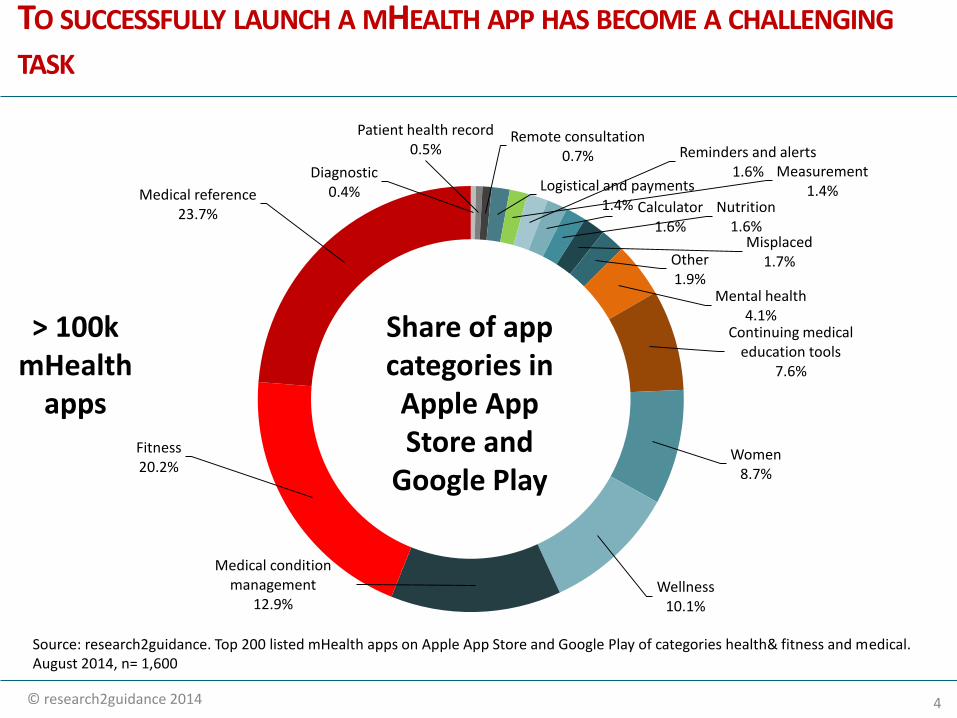
Diagnostic0.4%
Patient health record0.5%
Remote consultation0.7%
Logistical and payments1.4%
Measurement1.4%
Reminders and alerts1.6%
Calculator1.6%
Nutrition1.6%
Misplaced1.7%Other
1.9%Mental health
4.1%Continuing medical
education tools7.6%
Women8.7%
Wellness10.1%
Medical condition management
12.9%
Fitness20.2%
Medical reference23.7%
TO SUCCESSFULLY LAUNCH A MHEALTH APP HAS BECOME A CHALLENGING
TASK
> 100k mHealth
apps
Source: research2guidance. Top 200 listed mHealth apps on Apple App Store and Google Play of categories health& fitness and medical. August 2014, n= 1,600
Share of app categories in
Apple App Store and
Google Play
5© research2guidance 2014
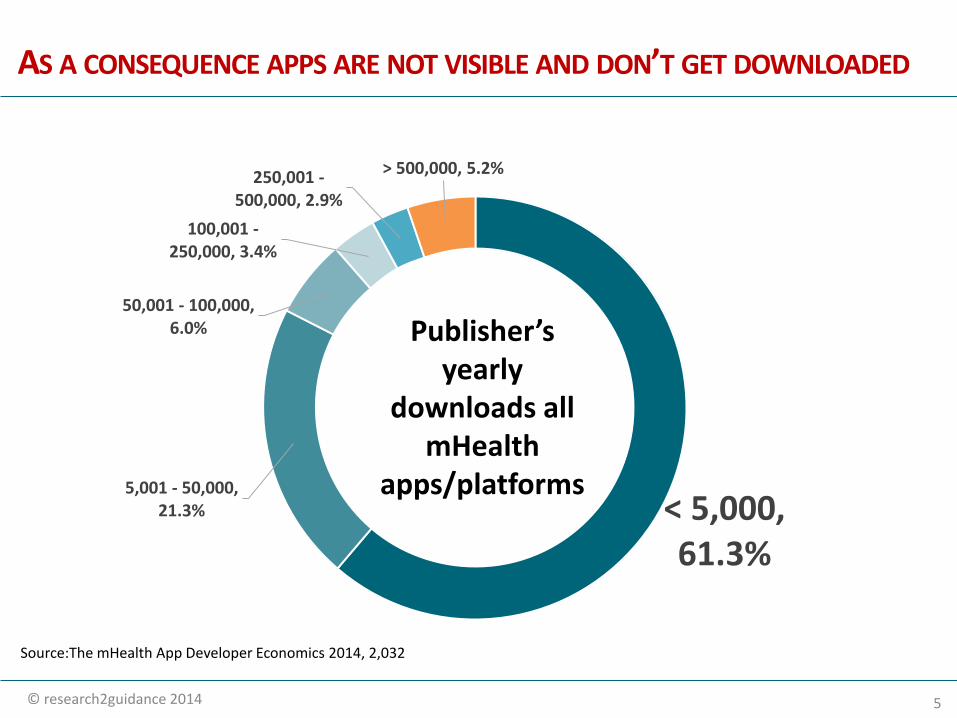
AS A CONSEQUENCE APPS ARE NOT VISIBLE AND DON’T GET DOWNLOADED
Source:The mHealth App Developer Economics 2014, 2,032
< 5,000, 61.3%
5,001 - 50,000, 21.3%
50,001 - 100,000, 6.0%
100,001 -250,000, 3.4%
250,001 -500,000, 2.9%
> 500,000, 5.2%
Publisher’s yearly
downloads all mHealth
apps/platforms
6© research2guidance 2014
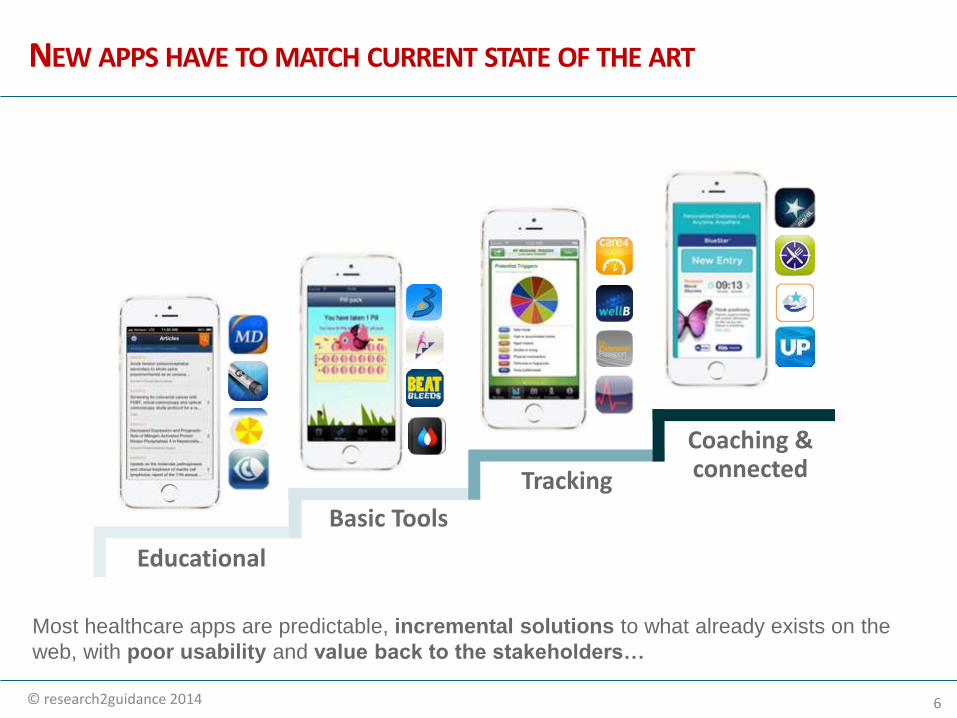
NEW APPS HAVE TO MATCH CURRENT STATE OF THE ART
Most healthcare apps are predictable, incremental solutions to what already exists on the
web, with poor usability and value back to the stakeholders…
Educational
Basic Tools
Tracking
Coaching & connected
7© research2guidance 2014
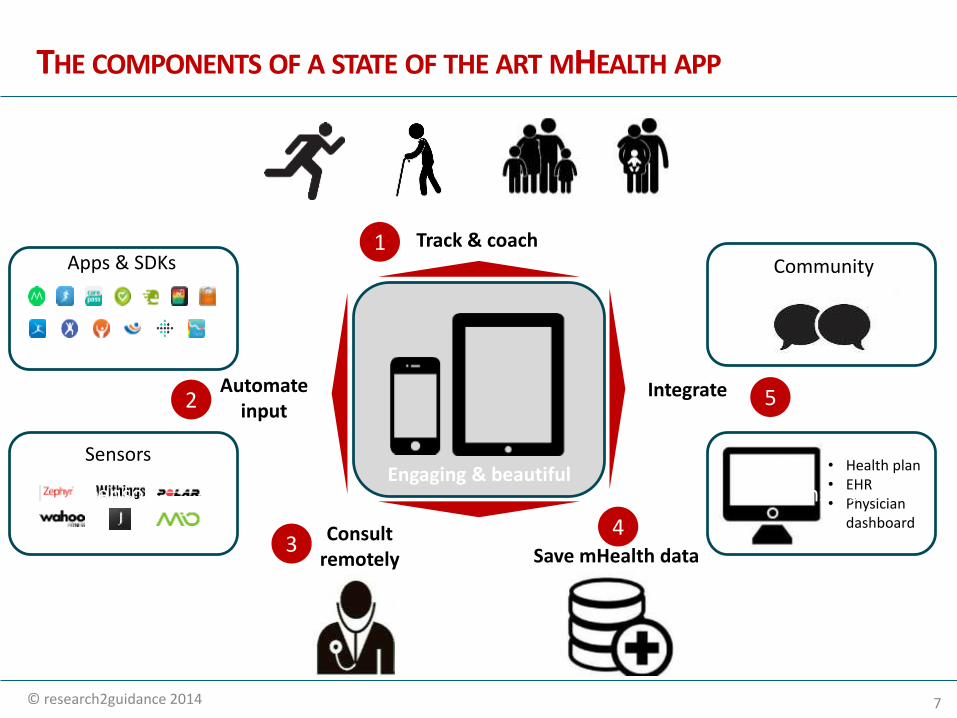
Sensors
THE COMPONENTS OF A STATE OF THE ART MHEALTH APP
Track & coach
Save mHealth dataConsult
remotely
Apps & SDKs
Integrate
Sensors
Automateinput
• Health plan• EHR• Physician
dashboard
Community
Sensors SensorsEngaging & beautiful
1
5
43
2
8© research2guidance 2014
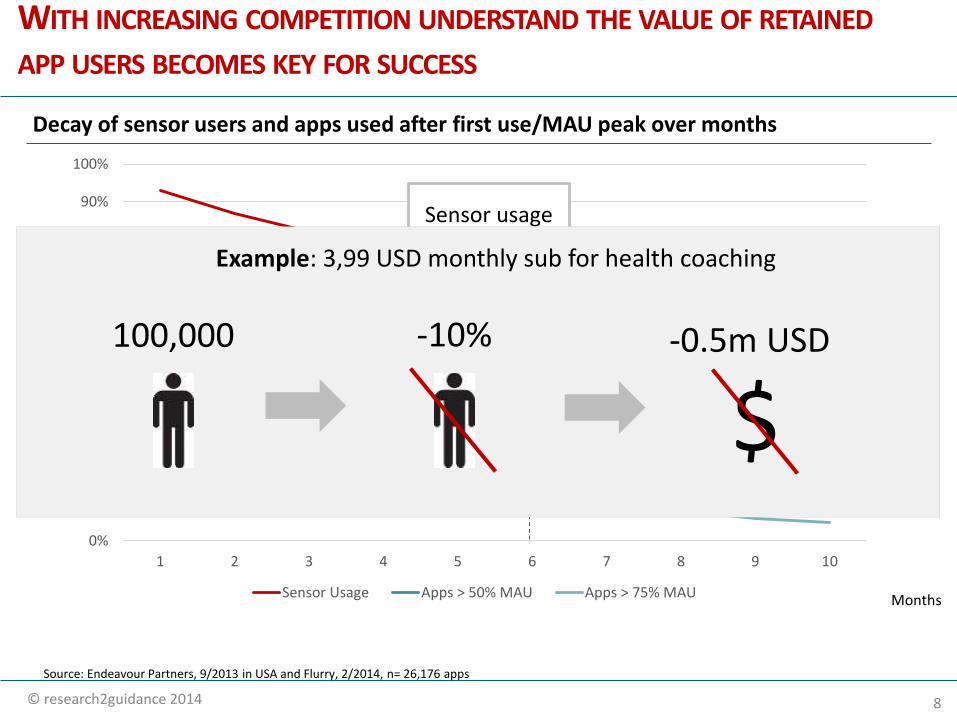
WITH INCREASING COMPETITION UNDERSTAND THE VALUE OF RETAINED
APP USERS BECOMES KEY FOR SUCCESS
0%
10%
20%
30%
40%
50%
60%
70%
80%
90%
100%
1 2 3 4 5 6 7 8 9 10
Sensor Usage Apps > 50% MAU Apps > 75% MAU
Source: Endeavour Partners, 9/2013 in USA and Flurry, 2/2014, n= 26,176 apps
Decay of sensor users and apps used after first use/MAU peak over months
Apps used by >75%
Months
Sensor usage
Apps used by >50%
100,000 -10% -0.5m USD
$
Example: 3,99 USD monthly sub for health coaching
9© research2guidance 2014
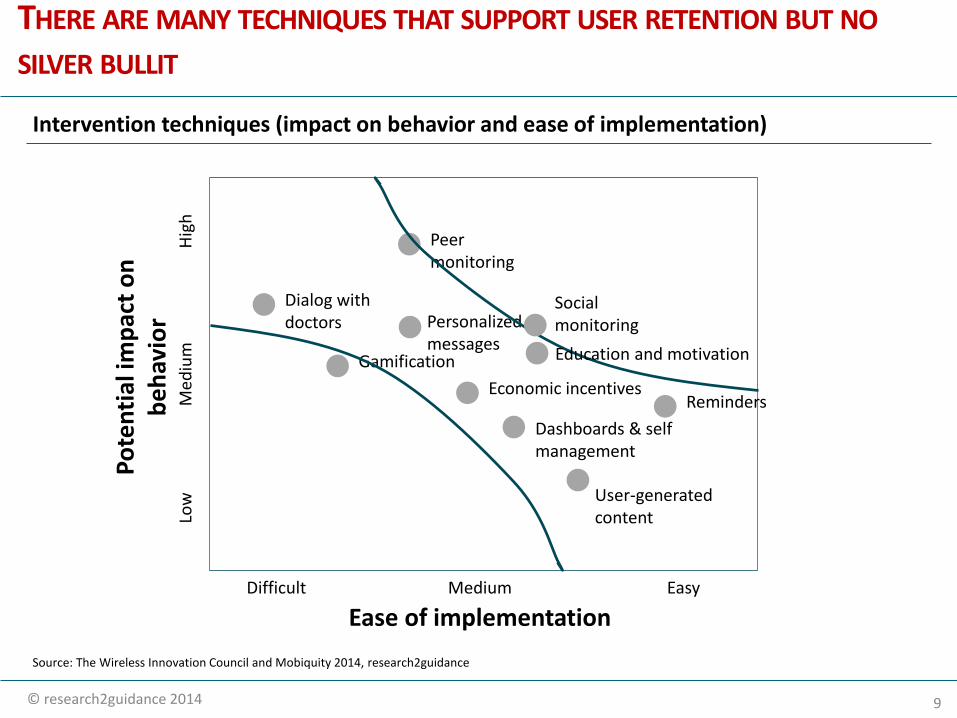
THERE ARE MANY TECHNIQUES THAT SUPPORT USER RETENTION BUT NO
SILVER BULLIT
Dialog withdoctors
Peer monitoring
Personalizedmessages
Economic incentives
Dashboards & selfmanagement
User-generatedcontent
Gamification
Ease of implementationDifficult Medium Easy
Po
ten
tial
imp
act
on
b
eh
avio
rLo
wM
ediu
m
Hig
h
Intervention techniques (impact on behavior and ease of implementation)
Reminders
Socialmonitoring
Education and motivation
Source: The Wireless Innovation Council and Mobiquity 2014, research2guidance
10© research2guidance 2014
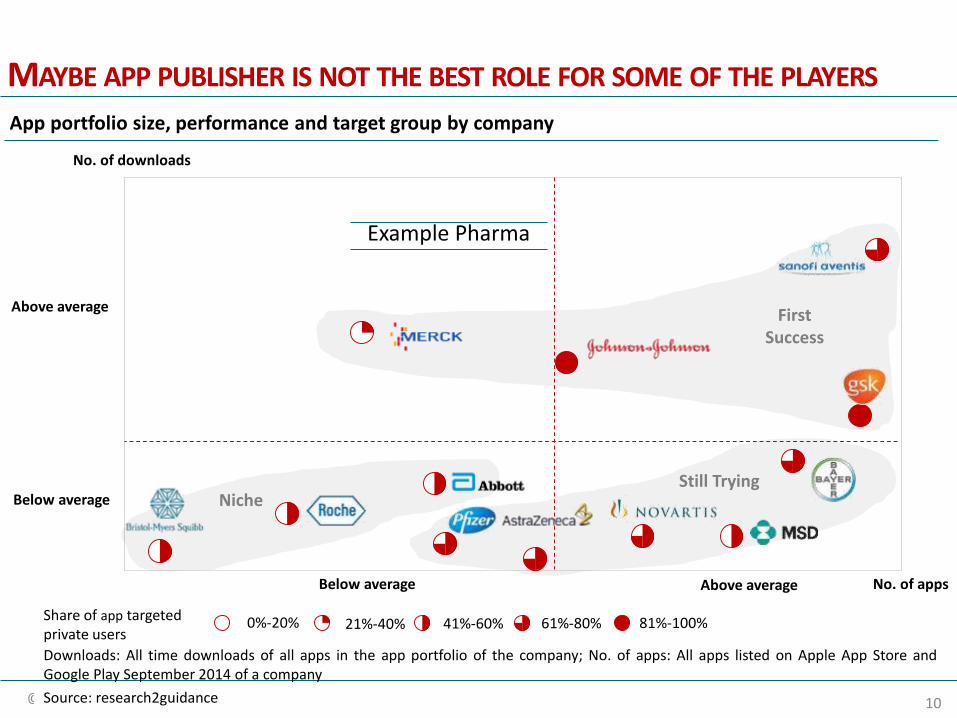
App portfolio size, performance and target group by company
Source: research2guidance
MAYBE APP PUBLISHER IS NOT THE BEST ROLE FOR SOME OF THE PLAYERS
Share of app targetedprivate users
0%-20% 21%-40% 41%-60% 61%-80% 81%-100%
Below average Above average No. of apps
Below average
Above average
No. of downloads
Downloads: All time downloads of all apps in the app portfolio of the company; No. of apps: All apps listed on Apple App Store andGoogle Play September 2014 of a company
NicheStill Trying
First Success
Example Pharma
11© research2guidance 2014
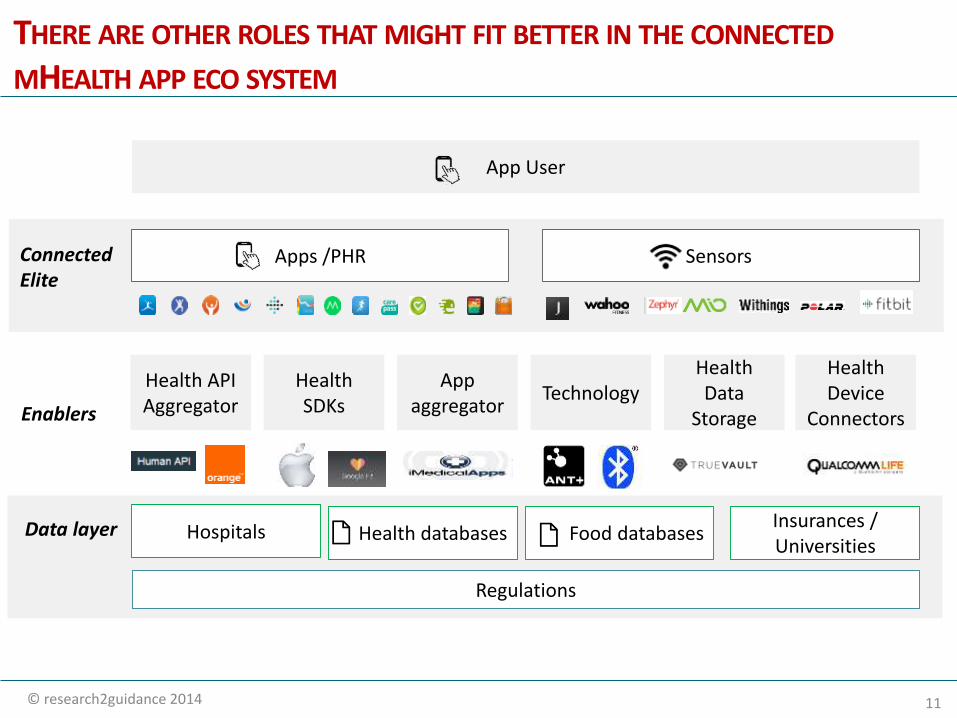
App User
Apps /PHR SensorsAA
Health API Aggregator
HealthSDKs
App aggregator
Technology HealthData
Storage
Regulations
Hospitals Health databases Food databasesInsurances / Universities
THERE ARE OTHER ROLES THAT MIGHT FIT BETTER IN THE CONNECTED
MHEALTH APP ECO SYSTEM
/ /
ConnectedElite
Enablers
Data layer
HealthDevice
Connectors
12© research2guidance 2014
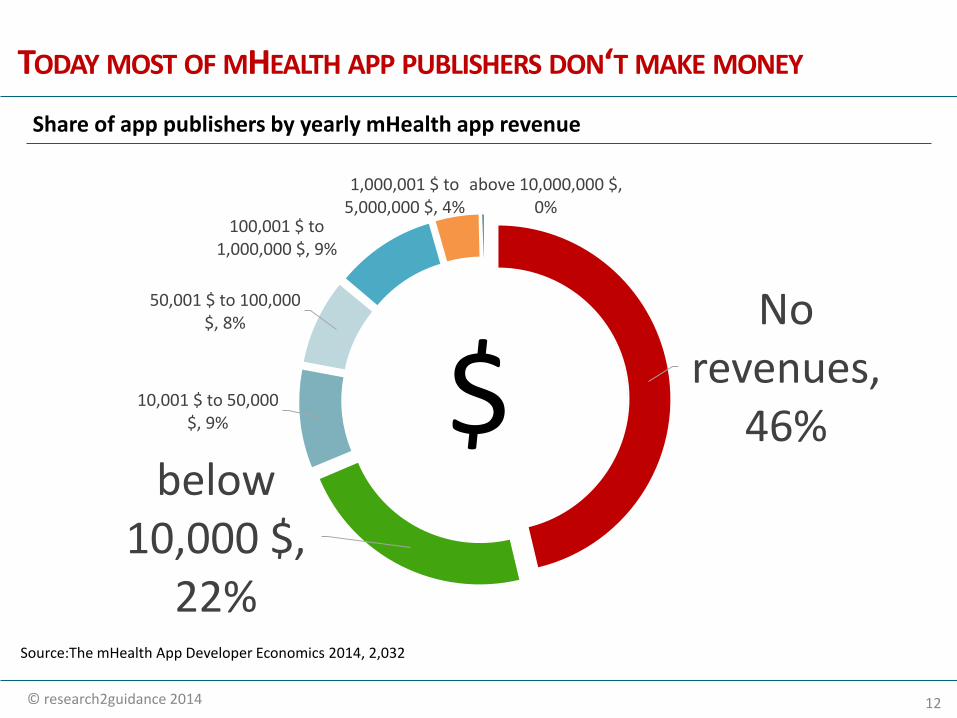
TODAY MOST OF MHEALTH APP PUBLISHERS DON‘T MAKE MONEY
No revenues,
46%below
10,000 $, 22%
10,001 $ to 50,000 $, 9%
50,001 $ to 100,000 $, 8%
100,001 $ to 1,000,000 $, 9%
1,000,001 $ to 5,000,000 $, 4%
above 10,000,000 $, 0%
Share of app publishers by yearly mHealth app revenue
Source:The mHealth App Developer Economics 2014, 2,032
$
13© research2guidance 2014
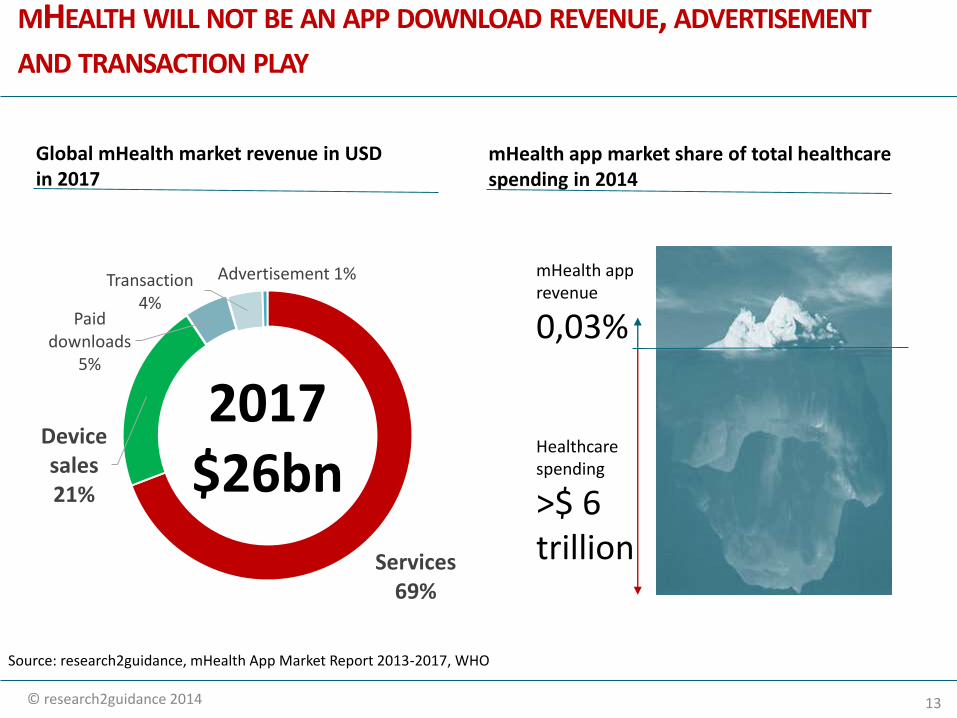
MHEALTH WILL NOT BE AN APP DOWNLOAD REVENUE, ADVERTISEMENT
AND TRANSACTION PLAY
Global mHealth market revenue in USD in 2017
Source: research2guidance, mHealth App Market Report 2013-2017, WHO
Services69%
Device sales21%
Paid downloads
5%
Transaction4%
Advertisement 1%
2017$26bn
Healthcarespending
>$ 6 trillion
mHealth apprevenue
0,03%
mHealth app market share of total healthcarespending in 2014
14© research2guidance 2014
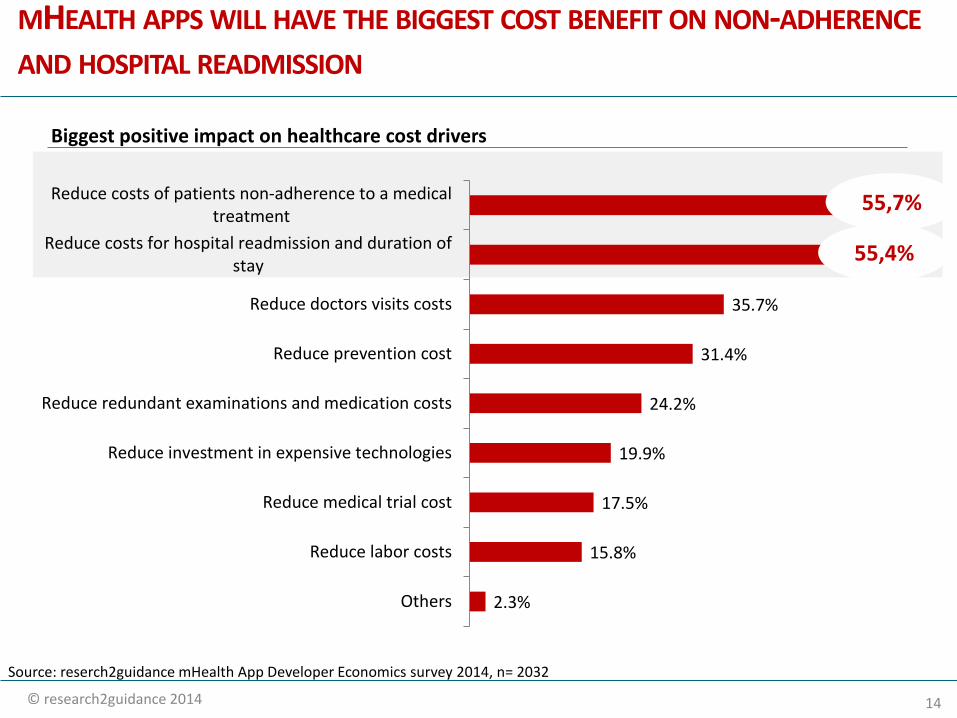
MHEALTH APPS WILL HAVE THE BIGGEST COST BENEFIT ON NON-ADHERENCE
AND HOSPITAL READMISSION
35.7%
31.4%
24.2%
19.9%
17.5%
15.8%
2.3%
Reduce costs of patients non-adherence to a medicaltreatment
Reduce costs for hospital readmission and duration ofstay
Reduce doctors visits costs
Reduce prevention cost
Reduce redundant examinations and medication costs
Reduce investment in expensive technologies
Reduce medical trial cost
Reduce labor costs
Others
Biggest positive impact on healthcare cost drivers
Source: reserch2guidance mHealth App Developer Economics survey 2014, n= 2032
55,7%
55,4%
15© research2guidance 2014
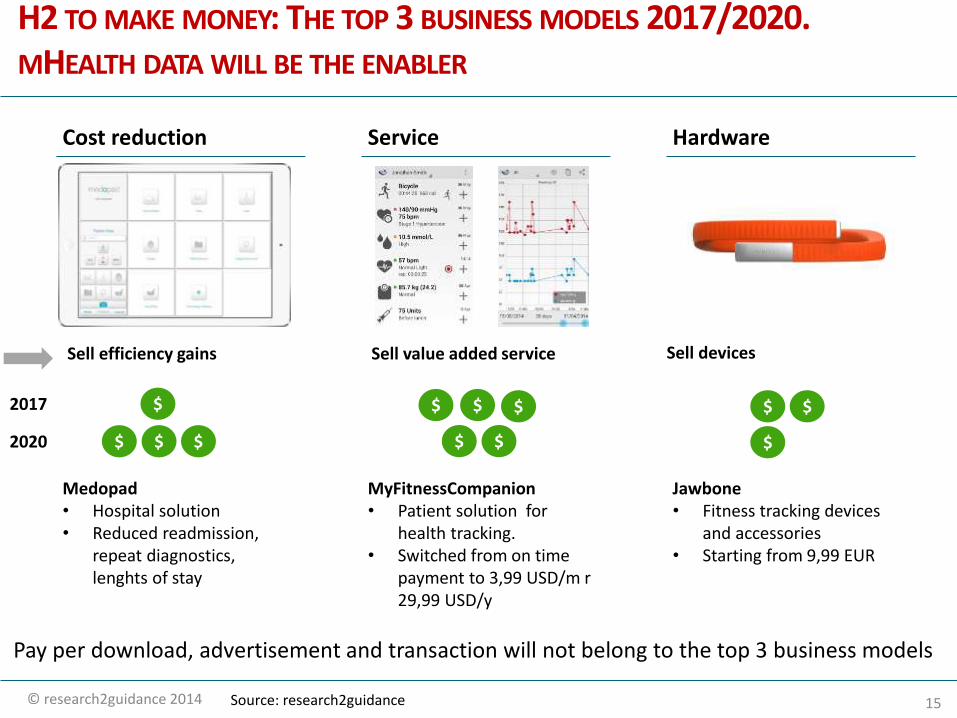
H2 TO MAKE MONEY: THE TOP 3 BUSINESS MODELS 2017/2020. MHEALTH DATA WILL BE THE ENABLER
Cost reduction
Medopad• Hospital solution• Reduced readmission,
repeat diagnostics, lenghts of stay
Service
MyFitnessCompanion• Patient solution for
health tracking.• Switched from on time
payment to 3,99 USD/m r 29,99 USD/y
Hardware
Jawbone• Fitness tracking devices
and accessories• Starting from 9,99 EUR
Sell efficiency gains Sell value added service Sell devices
2017
2020
$
$ $ $
$ $
$
$ $
$ $
$
Source: research2guidance
Pay per download, advertisement and transaction will not belong to the top 3 business models
16© research2guidance 2014
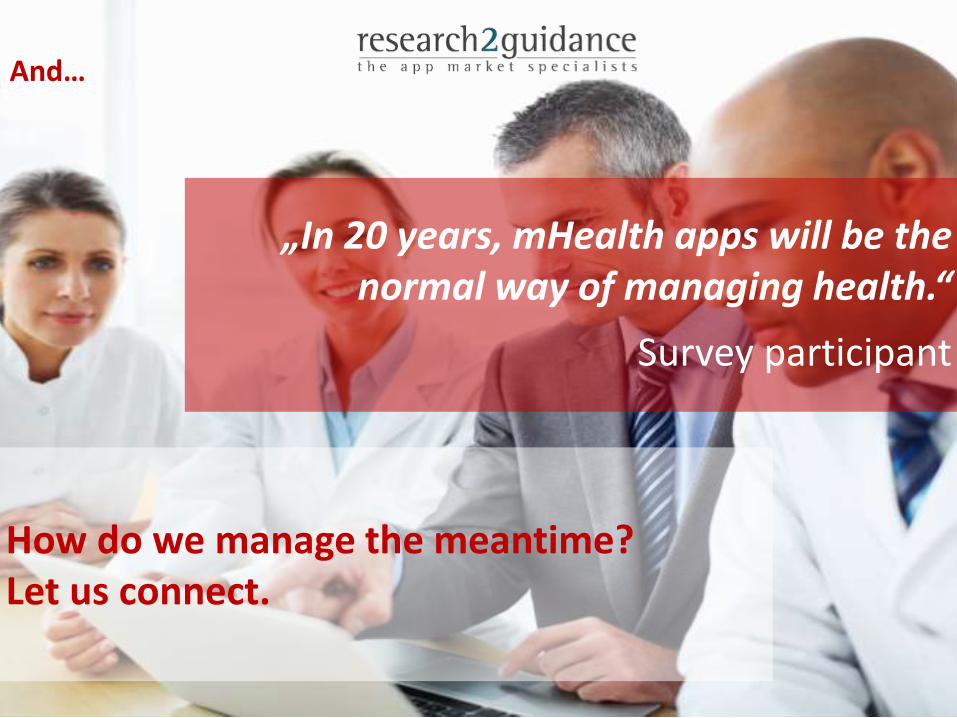
And…
„In 20 years, mHealth apps will be thenormal way of managing health.“
Survey participant
How do we manage the meantime?Let us connect.
17© research2guidance 2014
THANK YOU
Ralf-Gordon Jahns
Contact:
Phone: +49 (0)30 609 89 3360
www.mHealthEconomics.com