Embed Size (px)
Citation preview

NAIROBI RESEARCH BUZZ
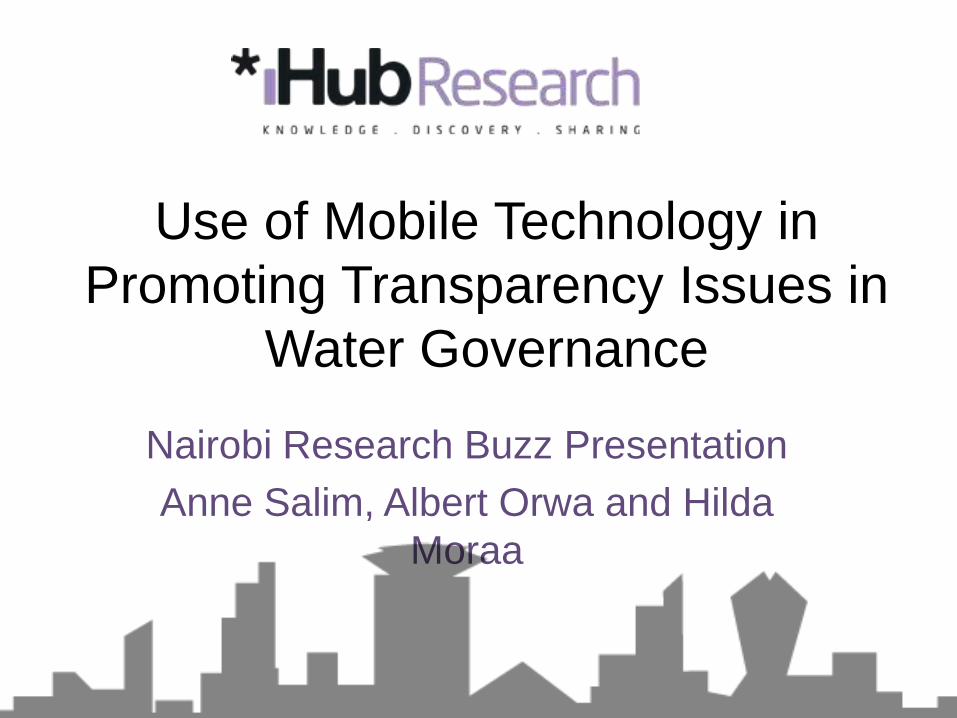
Use of Mobile Technology in
Promoting Transparency Issues in
Water Governance
Nairobi Research Buzz Presentation
Anne Salim, Albert Orwa and Hilda
Moraa

Outline
• Background
– Briefly talk about iHub Research: our goals and vision
– Mobile Telephony in Kenya
– M-gov Field research overview
• Research Objectives
• Methodology
• Findings
• Considerations
• Next steps
• Limitations
• Conclusion
• African research community
• Creating new and impactful knowledge
• Research skills building
www.research.ihub.co.ke
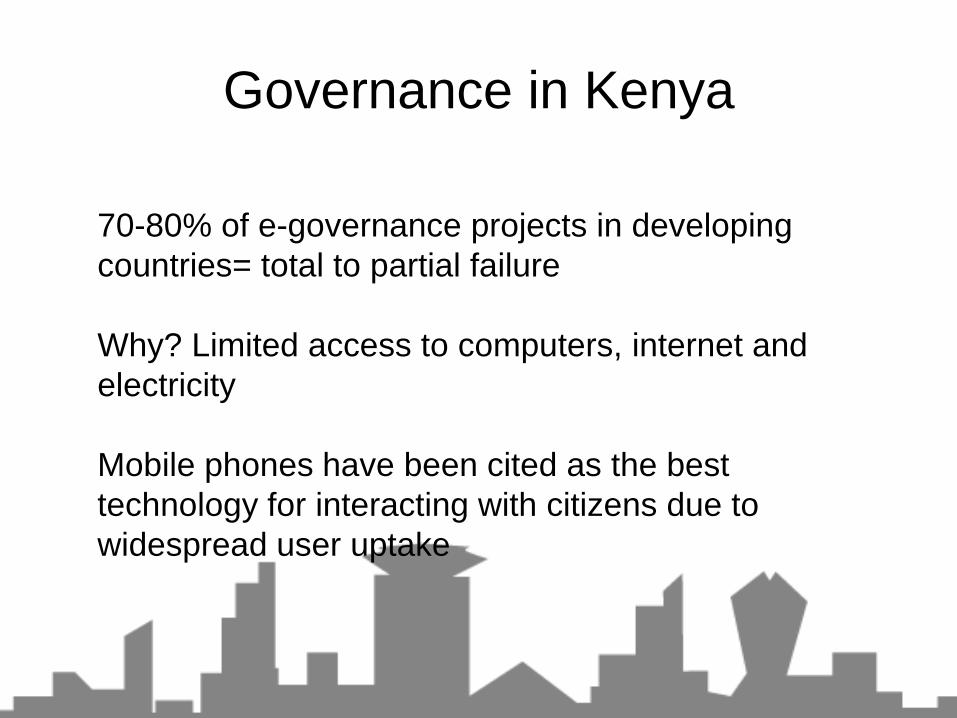
Governance in Kenya
70-80% of e-governance projects in developing
countries= total to partial failure
Why? Limited access to computers, internet and
electricity
Mobile phones have been cited as the best
technology for interacting with citizens due to
widespread user uptake
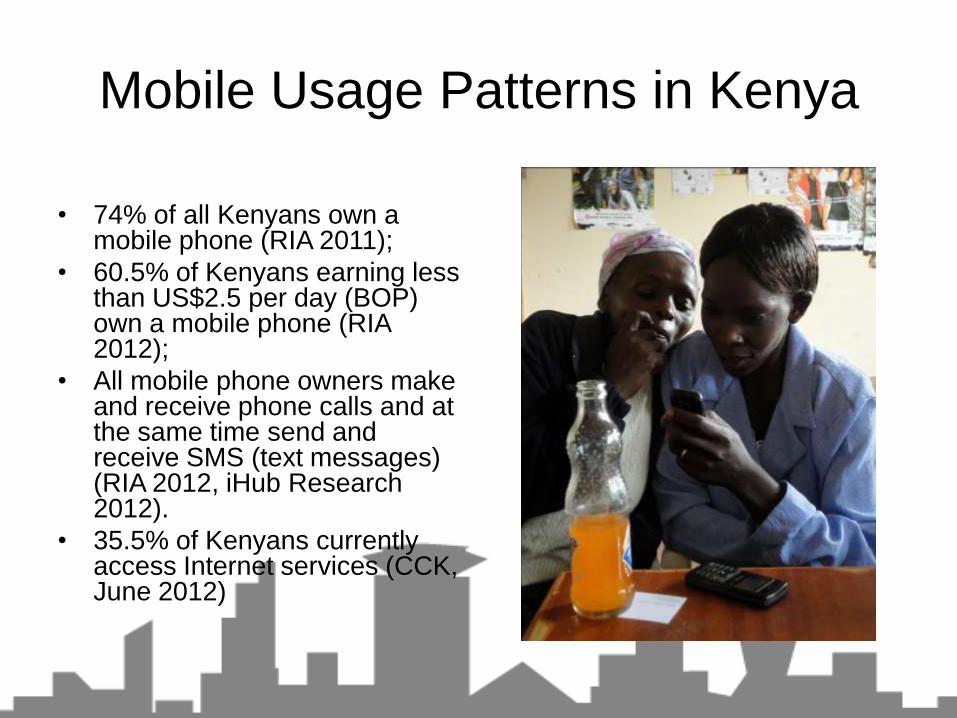
Mobile Usage Patterns in Kenya
• 74% of all Kenyans own a mobile phone (RIA 2011);
• 60.5% of Kenyans earning less than US$2.5 per day (BOP) own a mobile phone (RIA 2012);
• All mobile phone owners make and receive phone calls and at the same time send and receive SMS (text messages) (RIA 2012, iHub Research 2012).
• 35.5% of Kenyans currently access Internet services (CCK, June 2012)
MGovernance Project
• Began in September of 2011 from SPIDER
funding
• Aim: to evaluate how mobile technology can be
used to improve Kenyan Governance
• Research is thematically focused on Water
• Channels- by enhancing Transparency and
Access to information
Past Activities
• Exploratory research: Exploratory Survey on Kenyan Service Delivery and Government Interaction
• User Experience pretest on mgovernanceapplications –Mzalendo, Huduma, Msemakweli
• Workshops with stakeholders
• Fieldwork

Initial findings of the research
• Citizen’s understanding of Governance
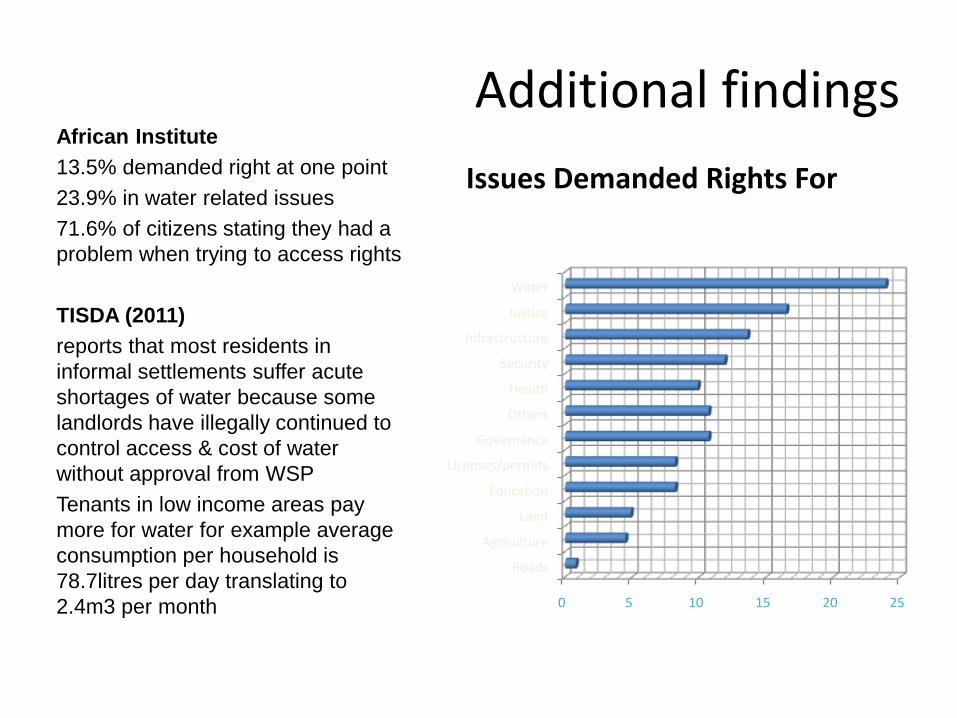
Additional findingsAfrican Institute
13.5% demanded right at one point
23.9% in water related issues
71.6% of citizens stating they had a
problem when trying to access rights
TISDA (2011)
reports that most residents in
informal settlements suffer acute
shortages of water because some
landlords have illegally continued to
control access & cost of water
without approval from WSP
Tenants in low income areas pay
more for water for example average
consumption per household is
78.7litres per day translating to
2.4m3 per month
Issues Demanded Rights For
0 5 10 15 20 25
Roads
Agriculture
Land
Education
Licenses/permits
Governance
Others
Health
Security
Infrastructure
Justice
Water
Research Objectives
• Investigate the type of water information citizens
desire;
• Understand the gaps faced by different stakeholders in
accessing water info;
• Identify the tech platform that citizens and
stakeholders would prefer for receiving and sending
water information;
• Evaluate how mobile phone tech can be used as a tool
for improving the gaps faced by the different
stakeholders in the access of water.
Methodology
• The project has employed
both quantitative &
qualitative methods
including:
• in-depth interviews with
stakeholders, structured
questionnaires with
citizens in 3 Kenyan
counties, (900) and desk
research on existing
literature.
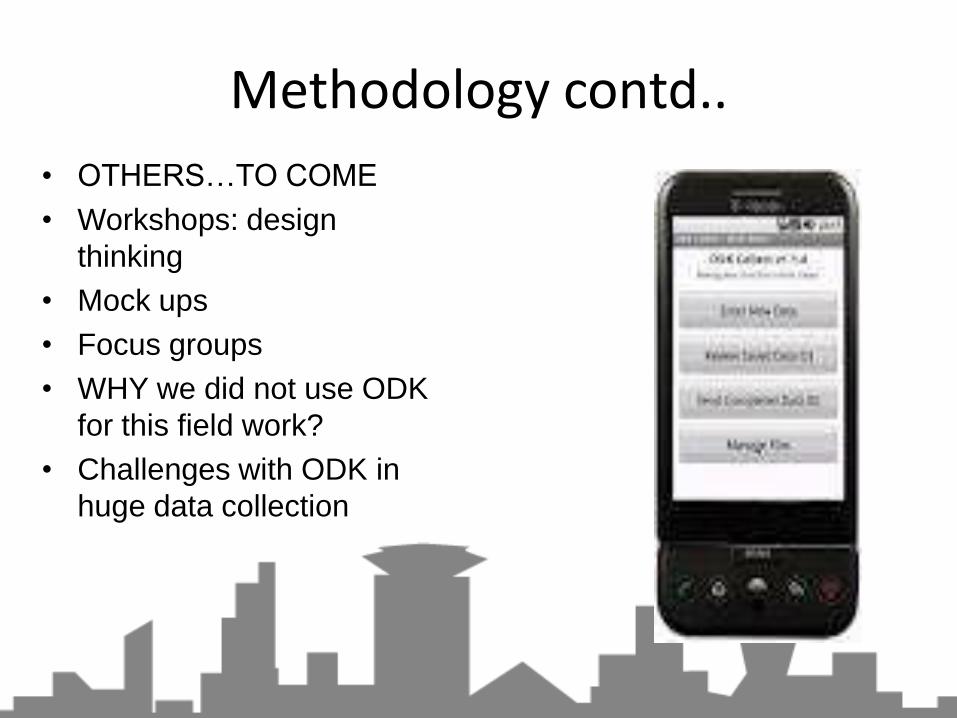
Methodology contd..
• OTHERS…TO COME
• Workshops: design
thinking
• Mock ups
• Focus groups
• WHY we did not use ODK
for this field work?
• Challenges with ODK in
huge data collection

Field Pics

61%55%
95%
69% 68%
39%45%
5%
31% 32%
0
10
20
30
40
50
60
70
80
90
100
Kiambu Migori Makueni Urban Rural
Have you or any of your household members faced any challenges while trying to access your
main source of water?
Yes
No

Some of the challenges faced
What are the challenges faced?*County Cross tabulation
Kiambu Migori Makueni
Failed to get water for a couple of weeks 43% 30% 24%
Hiked water bills 12% 3% 7%
Price exploitation by the water vendors 14% 4% 25%
Water from the main source is not continuous 35% 9% 37%
Received/bought dirty water for a couple of
weeks11% 55% 28%
I can’t remember 1% 1% 0%
Other (long distances to the main source of
water)8% 42% 36%
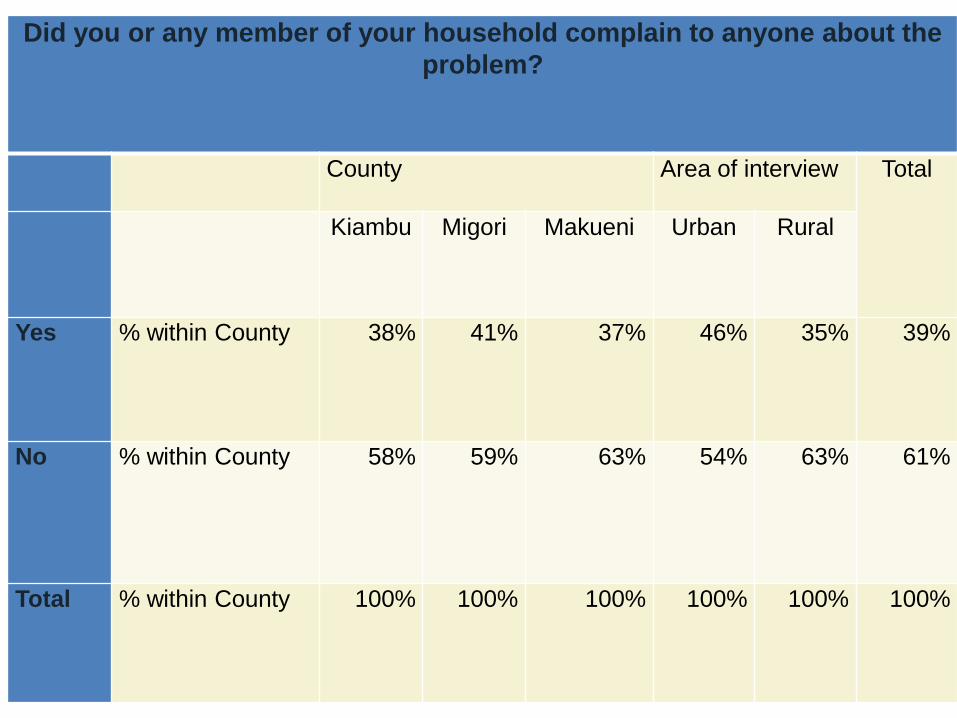
Did you or any member of your household complain to anyone about the
problem?
County Area of interview Total
Kiambu Migori Makueni Urban Rural
Yes % within County 38% 41% 37% 46% 35% 39%
No % within County 58% 59% 63% 54% 63% 61%
Total % within County 100% 100% 100% 100% 100% 100%
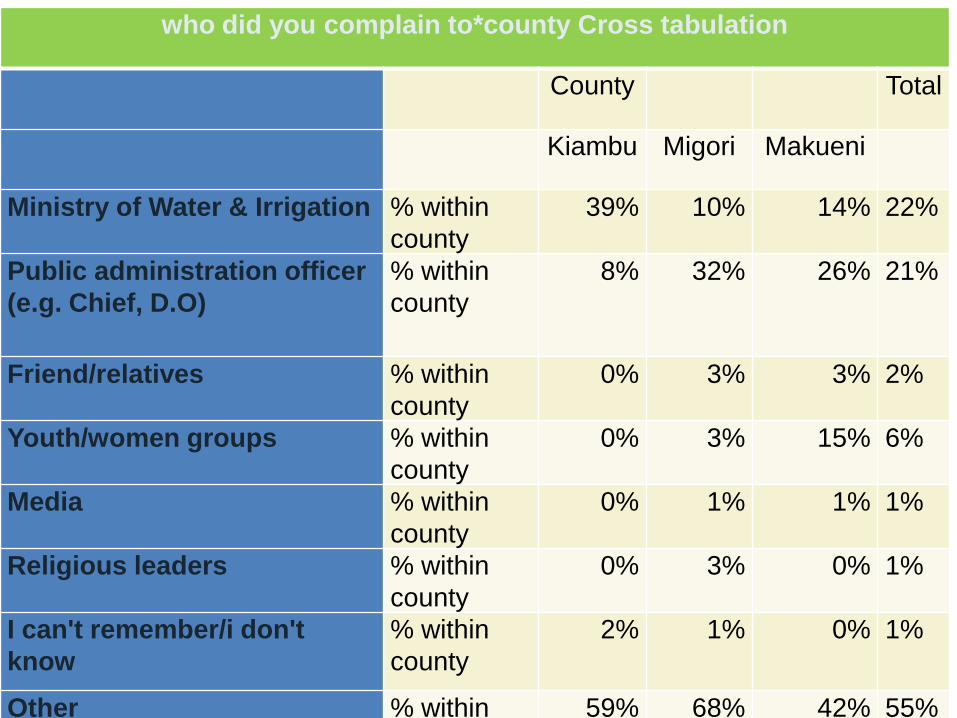
who did you complain to*county Cross tabulation
County Total
Kiambu Migori Makueni
Ministry of Water & Irrigation % within
county
39% 10% 14% 22%
Public administration officer
(e.g. Chief, D.O)
% within
county
8% 32% 26% 21%
Friend/relatives % within
county
0% 3% 3% 2%
Youth/women groups % within
county
0% 3% 15% 6%
Media % within
county
0% 1% 1% 1%
Religious leaders % within
county
0% 3% 0% 1%
I can't remember/i don't
know
% within
county
2% 1% 0% 1%
Other % within
county
59% 68% 42% 55%
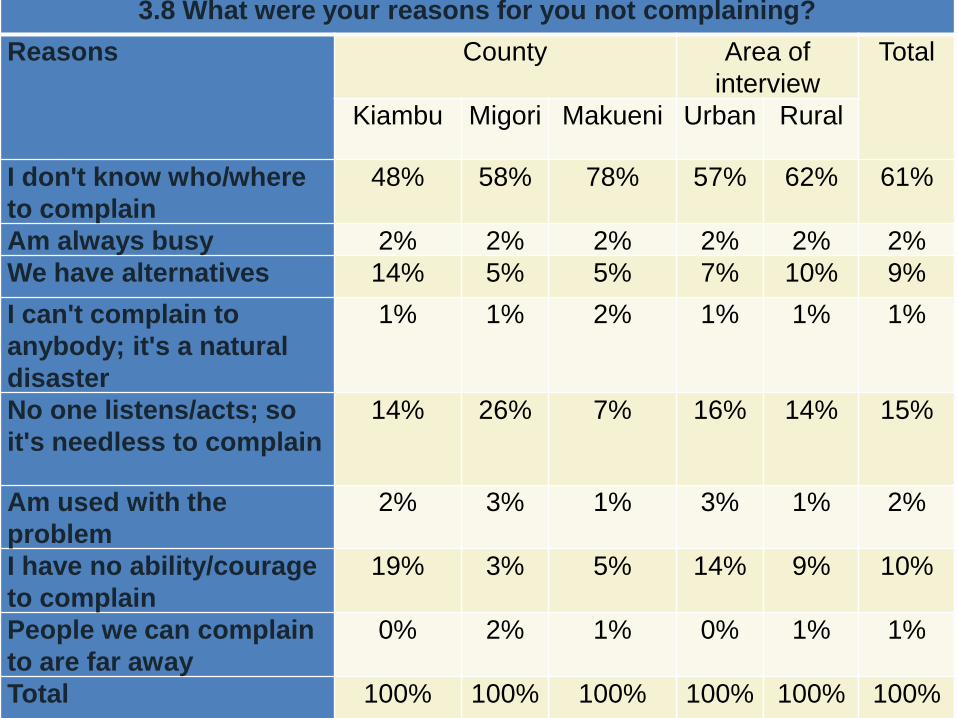
3.8 What were your reasons for you not complaining?
Reasons County Area of
interview
Total
Kiambu Migori Makueni Urban Rural
I don't know who/where
to complain
48% 58% 78% 57% 62% 61%
Am always busy 2% 2% 2% 2% 2% 2%
We have alternatives 14% 5% 5% 7% 10% 9%
I can't complain to
anybody; it's a natural
disaster
1% 1% 2% 1% 1% 1%
No one listens/acts; so
it's needless to complain
14% 26% 7% 16% 14% 15%
Am used with the
problem
2% 3% 1% 3% 1% 2%
I have no ability/courage
to complain
19% 3% 5% 14% 9% 10%
People we can complain
to are far away
0% 2% 1% 0% 1% 1%
Total 100% 100% 100% 100% 100% 100%
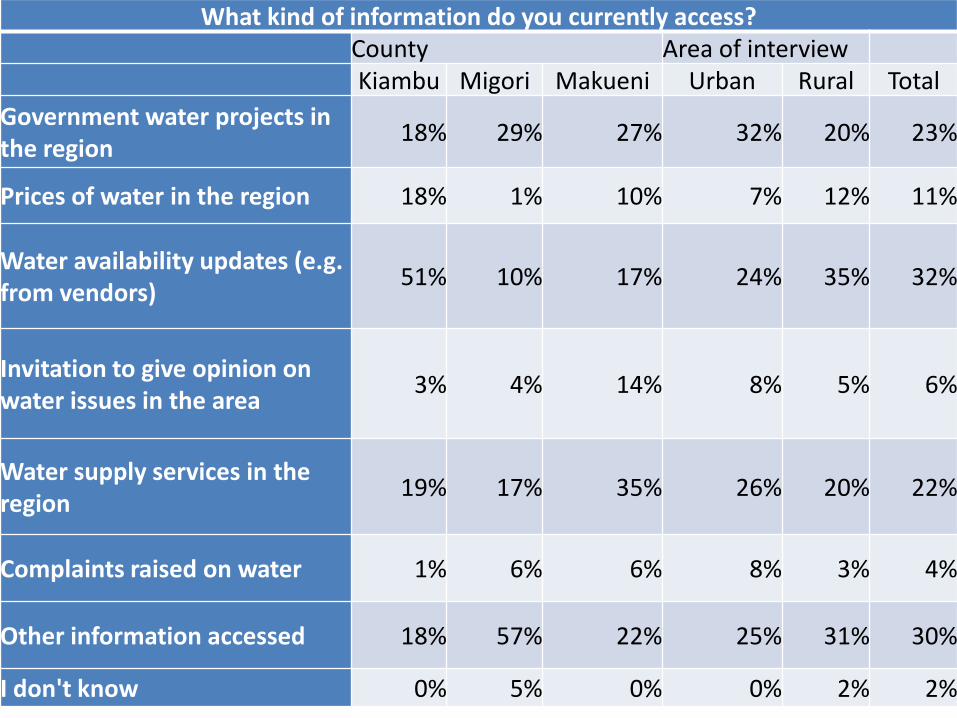
What kind of information do you currently access?County Area of interviewKiambu Migori Makueni Urban Rural Total
Government water projects in the region
18% 29% 27% 32% 20% 23%
Prices of water in the region 18% 1% 10% 7% 12% 11%
Water availability updates (e.g. from vendors)
51% 10% 17% 24% 35% 32%
Invitation to give opinion on water issues in the area
3% 4% 14% 8% 5% 6%
Water supply services in the region
19% 17% 35% 26% 20% 22%
Complaints raised on water 1% 6% 6% 8% 3% 4%
Other information accessed 18% 57% 22% 25% 31% 30%
I don't know 0% 5% 0% 0% 2% 2%
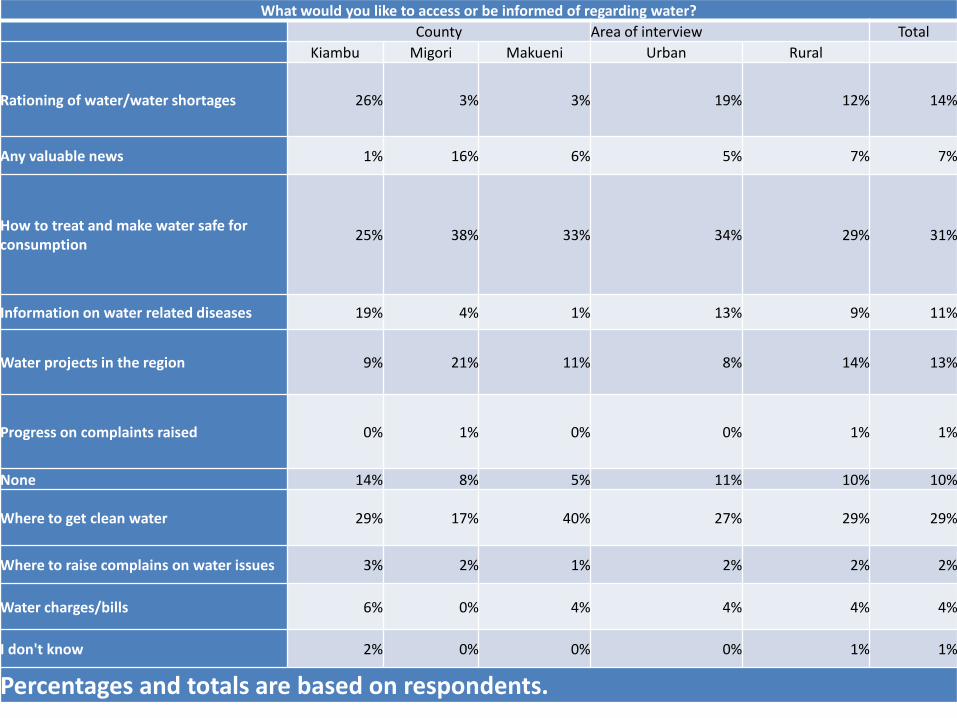
What would you like to access or be informed of regarding water?
County Area of interview Total
Kiambu Migori Makueni Urban Rural
Rationing of water/water shortages 26% 3% 3% 19% 12% 14%
Any valuable news 1% 16% 6% 5% 7% 7%
How to treat and make water safe for consumption
25% 38% 33% 34% 29% 31%
Information on water related diseases 19% 4% 1% 13% 9% 11%
Water projects in the region 9% 21% 11% 8% 14% 13%
Progress on complaints raised 0% 1% 0% 0% 1% 1%
None 14% 8% 5% 11% 10% 10%
Where to get clean water 29% 17% 40% 27% 29% 29%
Where to raise complains on water issues 3% 2% 1% 2% 2% 2%
Water charges/bills 6% 0% 4% 4% 4% 4%
I don't know 2% 0% 0% 0% 1% 1%
Percentages and totals are based on respondents.
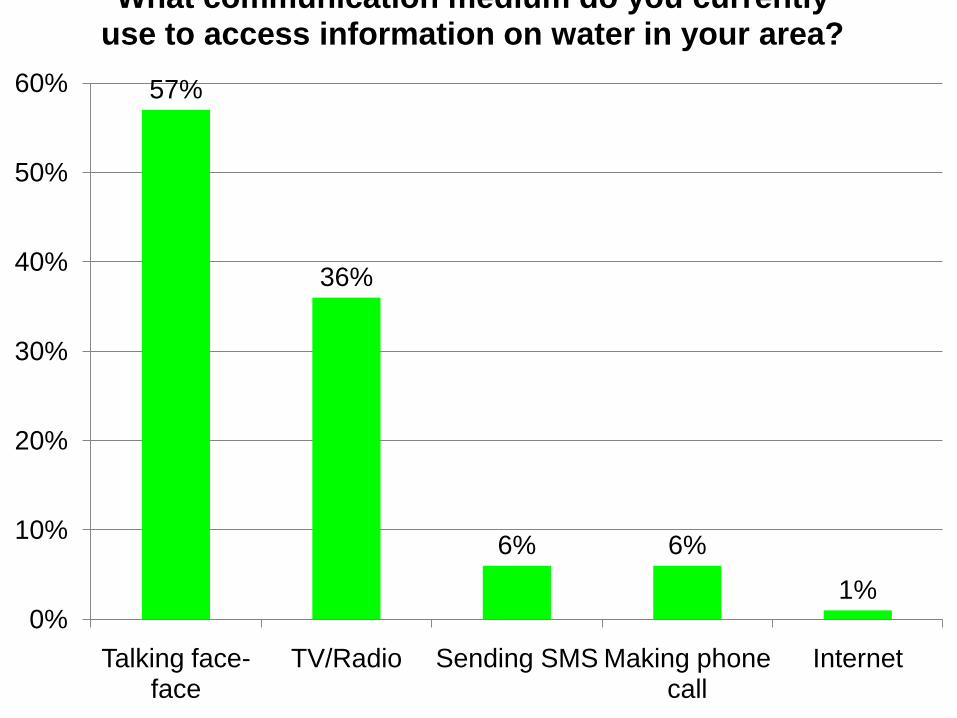
57%
36%
6% 6%
1%0%
10%
20%
30%
40%
50%
60%
Talking face-face
TV/Radio Sending SMS Making phone call
Internet
What communication medium do you currently use to access information on water in your area?
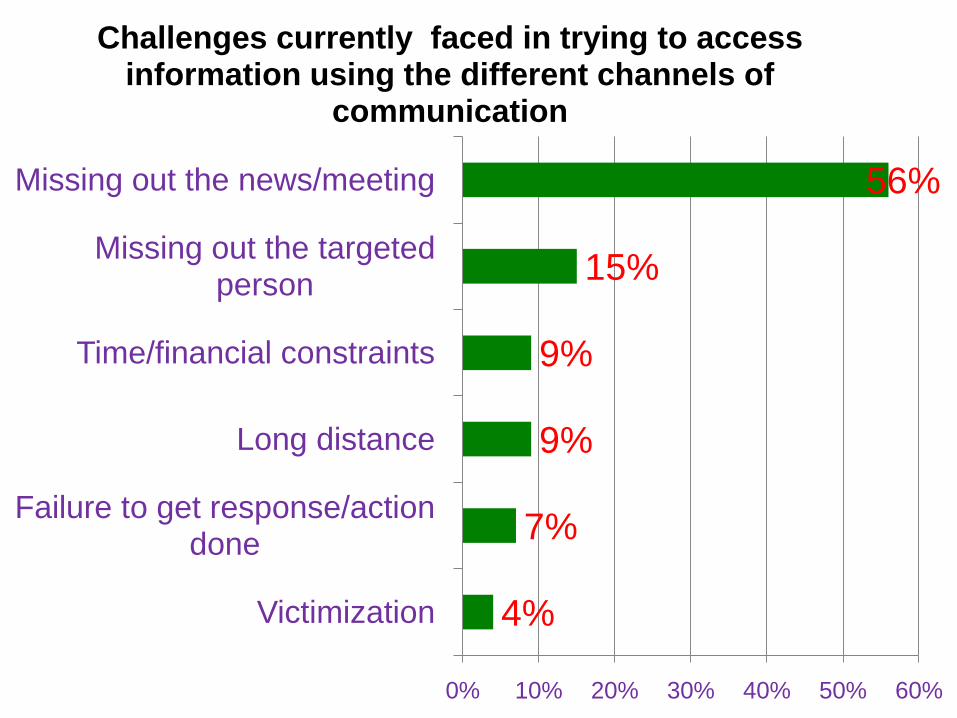
4%
7%
9%
9%
15%
56%
0% 10% 20% 30% 40% 50% 60%
Victimization
Failure to get response/action done
Long distance
Time/financial constraints
Missing out the targeted person
Missing out the news/meeting
Challenges currently faced in trying to access information using the different channels of
communication
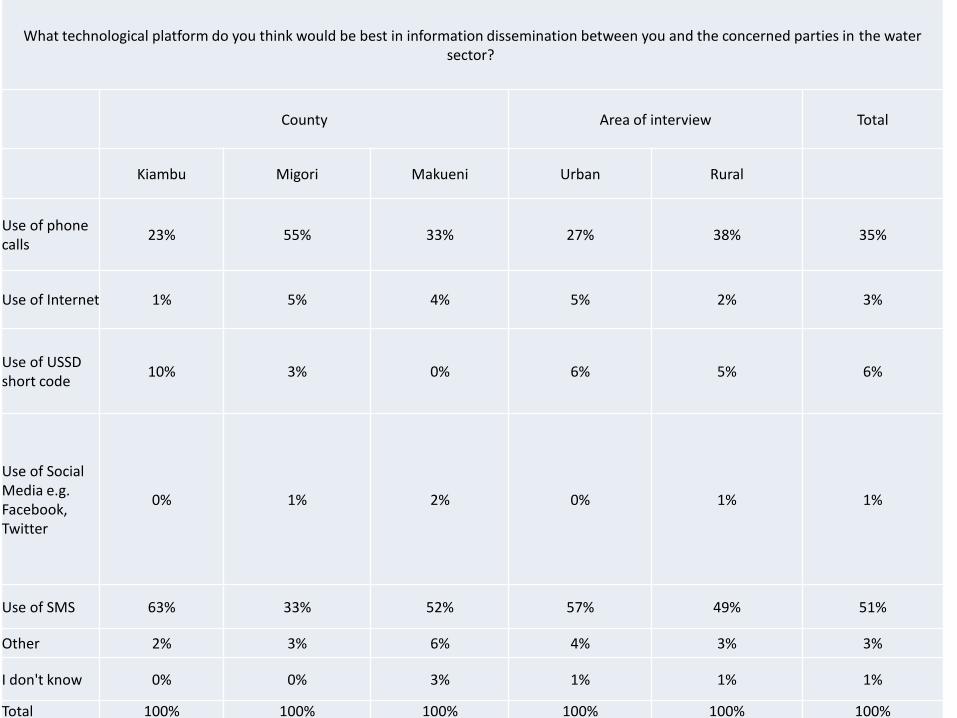
What technological platform do you think would be best in information dissemination between you and the concerned parties in the water sector?
County Area of interview Total
Kiambu Migori Makueni Urban Rural
Use of phone calls
23% 55% 33% 27% 38% 35%
Use of Internet 1% 5% 4% 5% 2% 3%
Use of USSD short code
10% 3% 0% 6% 5% 6%
Use of Social Media e.g. Facebook, Twitter
0% 1% 2% 0% 1% 1%
Use of SMS 63% 33% 52% 57% 49% 51%
Other 2% 3% 6% 4% 3% 3%
I don't know 0% 0% 3% 1% 1% 1%
Total 100% 100% 100% 100% 100% 100%
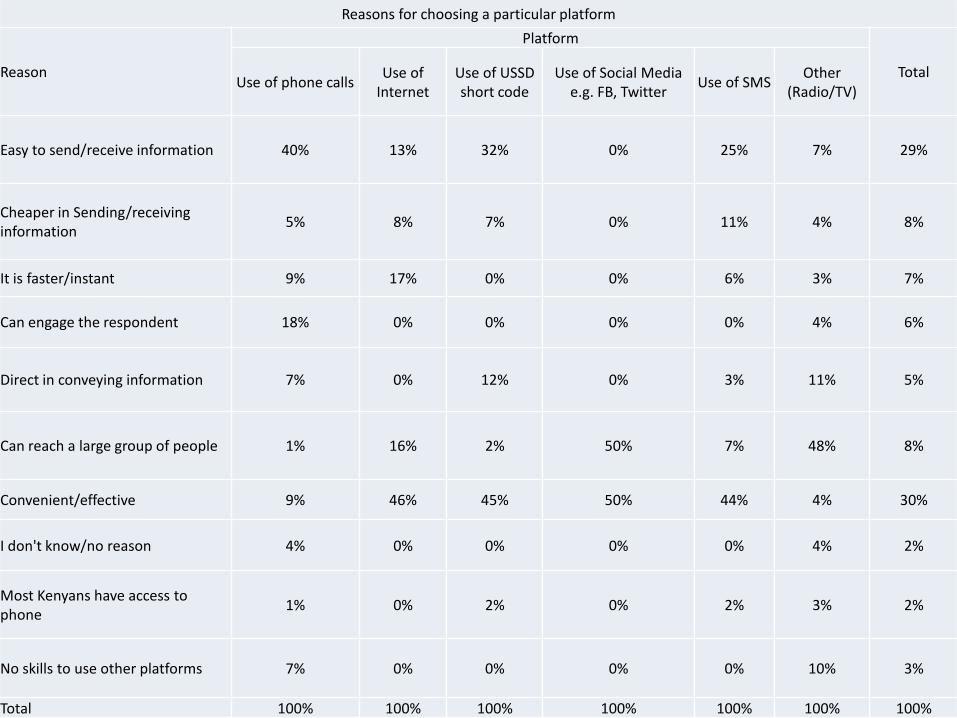
Reasons for choosing a particular platform
Reason
Platform
TotalUse of phone calls
Use of Internet
Use of USSD short code
Use of Social Media e.g. FB, Twitter
Use of SMSOther
(Radio/TV)
Easy to send/receive information 40% 13% 32% 0% 25% 7% 29%
Cheaper in Sending/receiving information
5% 8% 7% 0% 11% 4% 8%
It is faster/instant 9% 17% 0% 0% 6% 3% 7%
Can engage the respondent 18% 0% 0% 0% 0% 4% 6%
Direct in conveying information 7% 0% 12% 0% 3% 11% 5%
Can reach a large group of people 1% 16% 2% 50% 7% 48% 8%
Convenient/effective 9% 46% 45% 50% 44% 4% 30%
I don't know/no reason 4% 0% 0% 0% 0% 4% 2%
Most Kenyans have access to phone
1% 0% 2% 0% 2% 3% 2%
No skills to use other platforms 7% 0% 0% 0% 0% 10% 3%
Total 100% 100% 100% 100% 100% 100% 100%

Preferred technology * Foreseen challenges in using the technology
Platform Total
Use of phone calls
Use of Internet
Use of USSD short code
Use of Social Media e.g. FB, Twitter
Use of SMS Other (Radio/TV)
Expensive 9% 0% 2% 0% 35% 0% 45%
Delays/failure to respond 3% 0% 1% 0% 11% 0% 15%
Missing out the call/information 12% 0% 0% 0% 3% 5% 20%
Inability to use the platform 2% 1% 2% 0% 8% 0% 13%
Inaccessibility to the platform e.g. Internet 0% 1% 0% 0% 0% 0% 1%
People may fall prey to conmen 1% 0% 0% 0% 2% 0% 2%
i don't know 0% 0% 0% 0% 1% 0% 1%
Fear of being tracked down 0% 0% 0% 0% 0% 0% 1%
Receiving so many SMS that becomes nuisance
0% 0%0%
0% 1% 0% 1%
Total 27% 3%4%
0% 60% 6% 100%
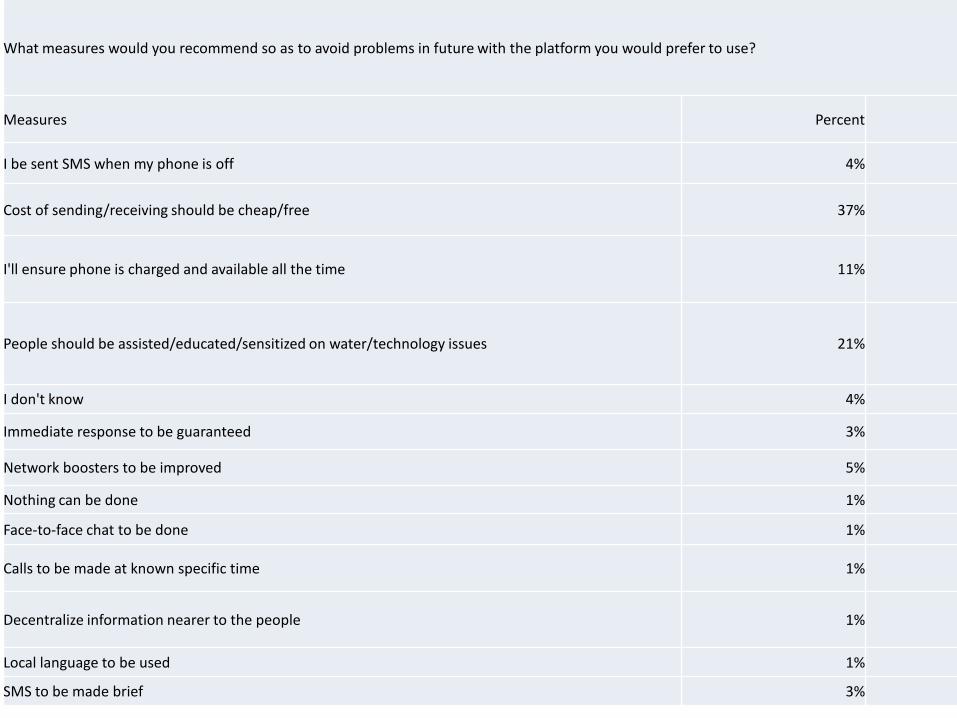
What measures would you recommend so as to avoid problems in future with the platform you would prefer to use?
Measures Percent
I be sent SMS when my phone is off 4%
Cost of sending/receiving should be cheap/free 37%
I'll ensure phone is charged and available all the time 11%
People should be assisted/educated/sensitized on water/technology issues 21%
I don't know 4%
Immediate response to be guaranteed 3%
Network boosters to be improved 5%
Nothing can be done 1%
Face-to-face chat to be done 1%
Calls to be made at known specific time 1%
Decentralize information nearer to the people 1%
Local language to be used 1%
SMS to be made brief 3%

Reports
• Documenting findings in three reports
Series 1: Role of technology in promoting transparency to citizens in water governance sector
Series 2: Role of technology in promoting transparency with local stakeholders in the water governance sector
Series 3: Understanding communication and decision making process in the water governance sector
Next steps
• Water ideation Hackathon in April –
working with stakeholders
• GAP: Needs identified by citizens VS
already existing solutions
• Partnering with stakeholders
• Design thinking to come up with POVs that
can be developed into solutions

Conclusion
• Need for clearly understanding the role of
technology in solving real needs of the citizens
• TRANSPARENCY is a huge problem. No
Transparency = no democracy
• Sustainability: applications and collaborations
• No need of reinventing the will- focus on
untapped areas

Thanks
Email:
Twitter:
@anny320
@albertorwa
@hildamoraa
• @ihubresearch|@ihu
b