Embed Size (px)
Citation preview
Kill those bugs with the ultimate tool –Chrome DevTools
Mesquite C
March 11th, 1:00pm
Aamir Suleman @iSpatial
Albert Marquez @amarquez2073
Slides: http://bit.ly/18ACp0V
Overview
• Challenges in Debugging
• Using DevTools
• Cool Tricks
• Unexpected Chrome Behavior
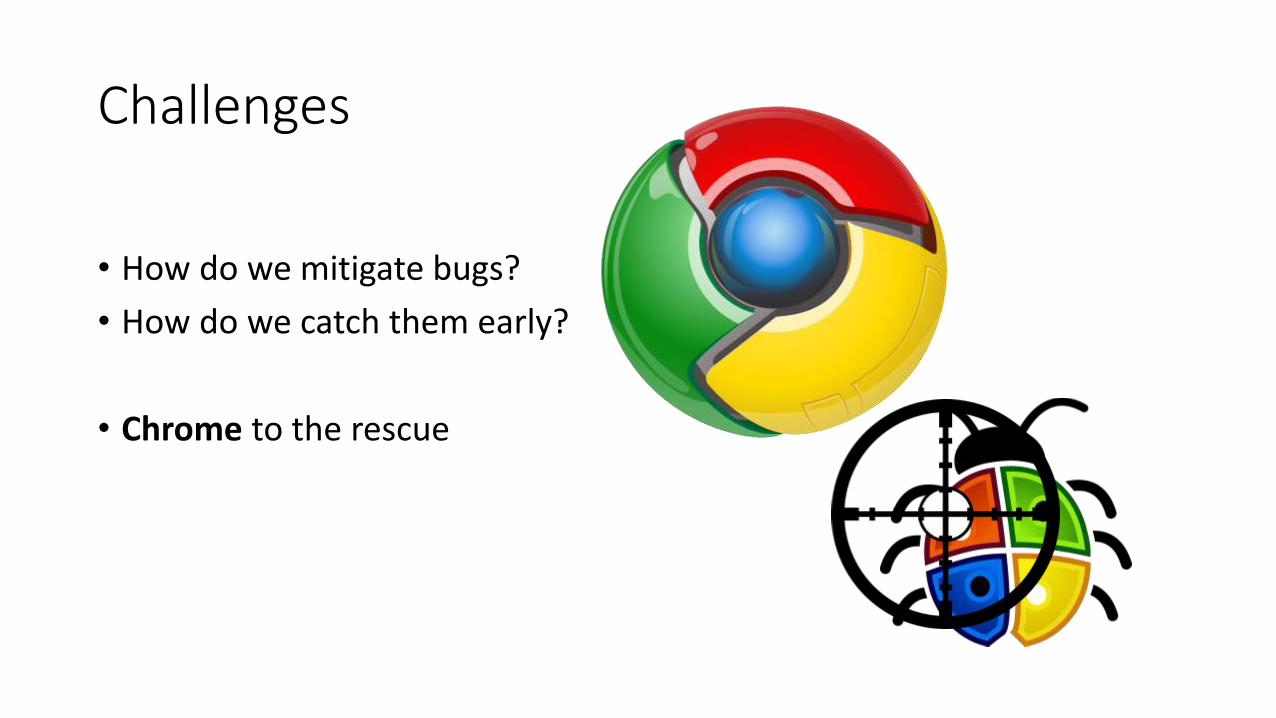
Challenges
• How do we mitigate bugs?
• How do we catch them early?
• Chrome to the rescue
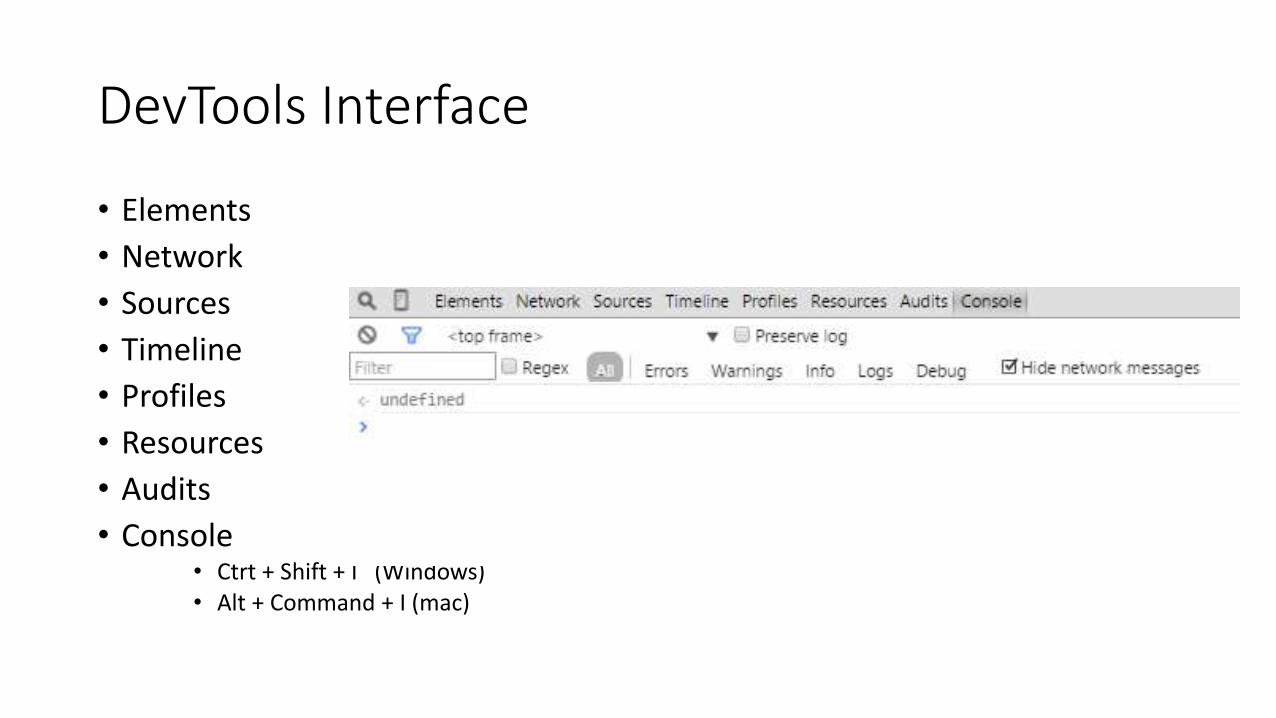
DevTools Interface
• Elements
• Network
• Sources
• Timeline
• Profiles
• Resources
• Audits
• Console• Ctrt + Shift + I (Windows)• Alt + Command + I (mac)
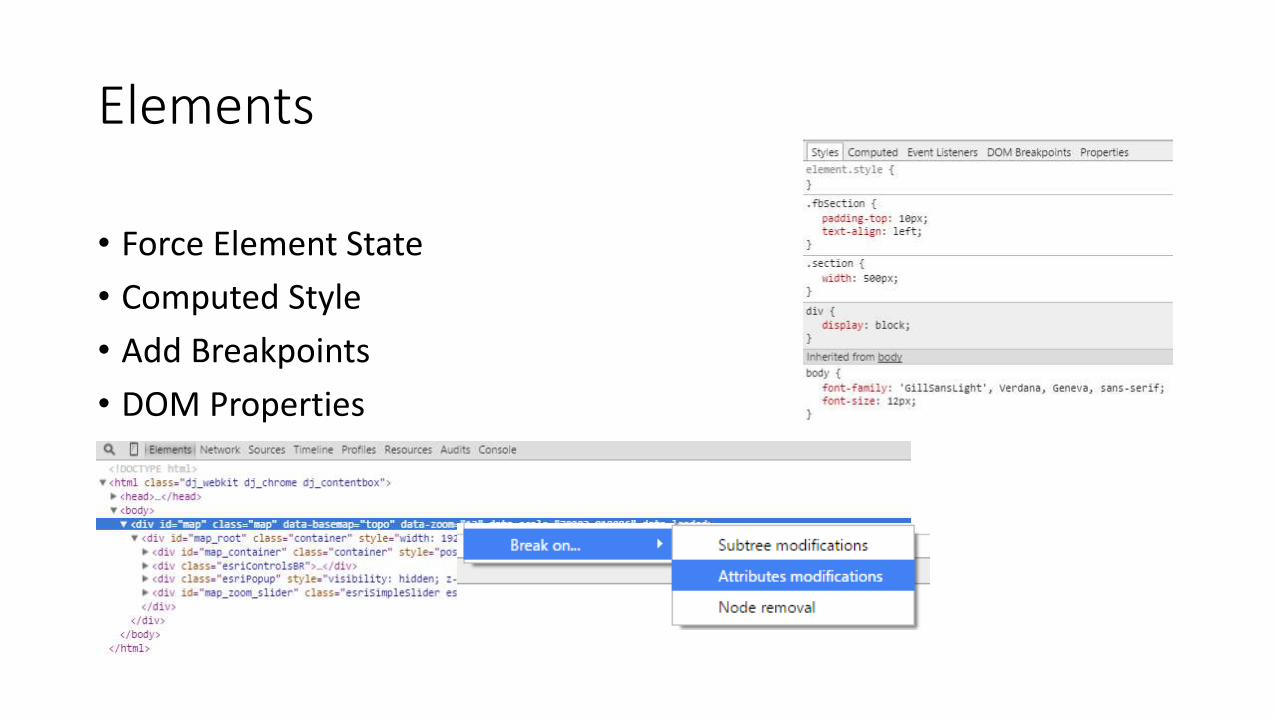
Elements
• Force Element State
• Computed Style
• Add Breakpoints
• DOM Properties
Demo: Elements
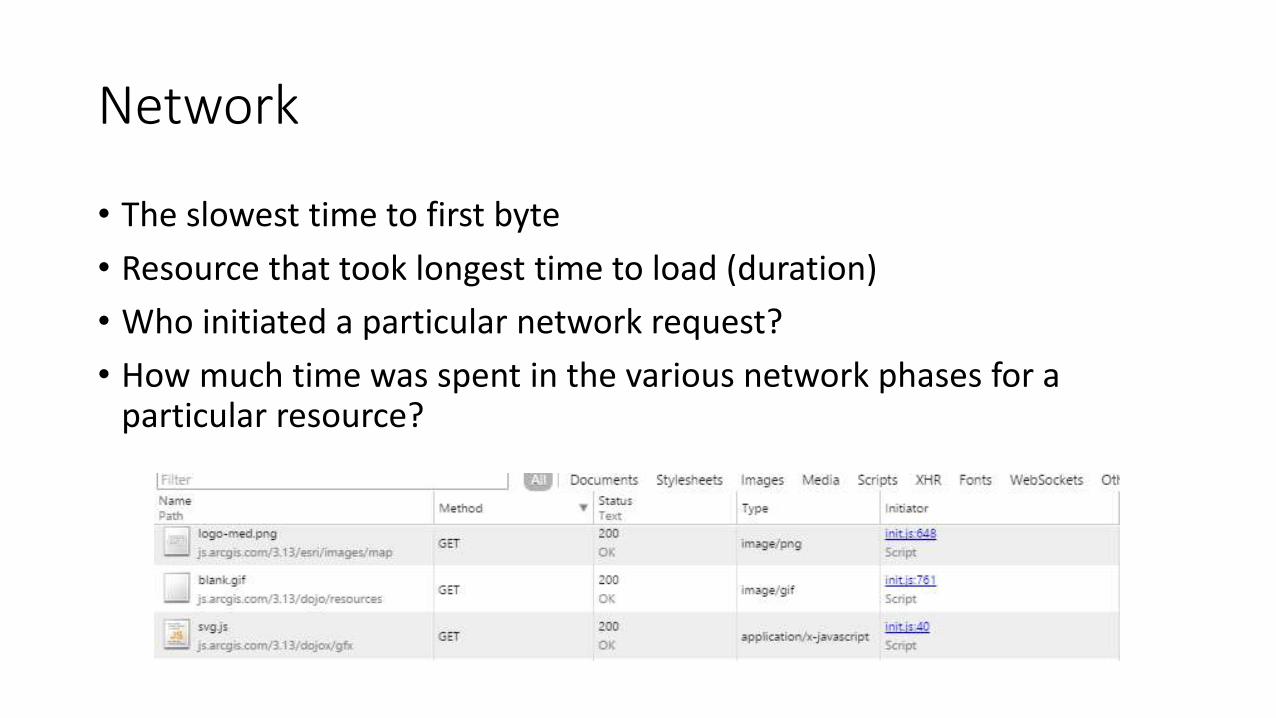
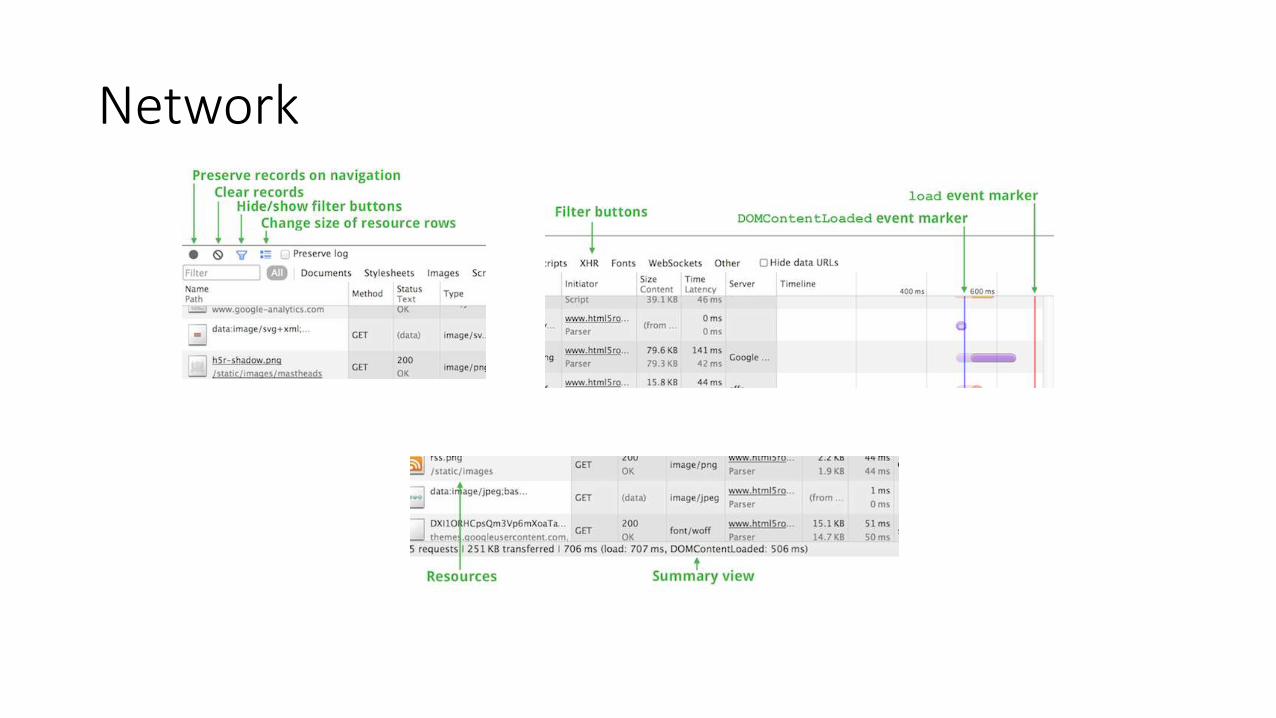
Network
• The slowest time to first byte
• Resource that took longest time to load (duration)
• Who initiated a particular network request?
• How much time was spent in the various network phases for a particular resource?
Network
Network
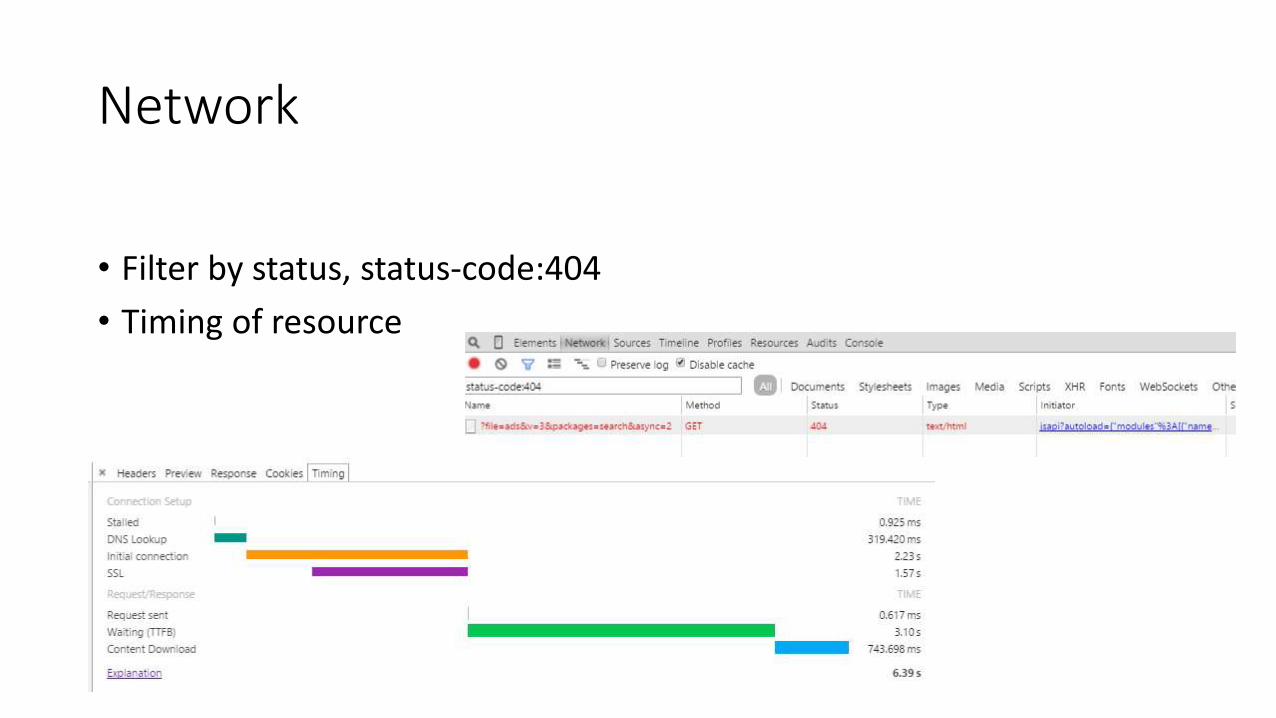
• Filter by status, status-code:404
• Timing of resource
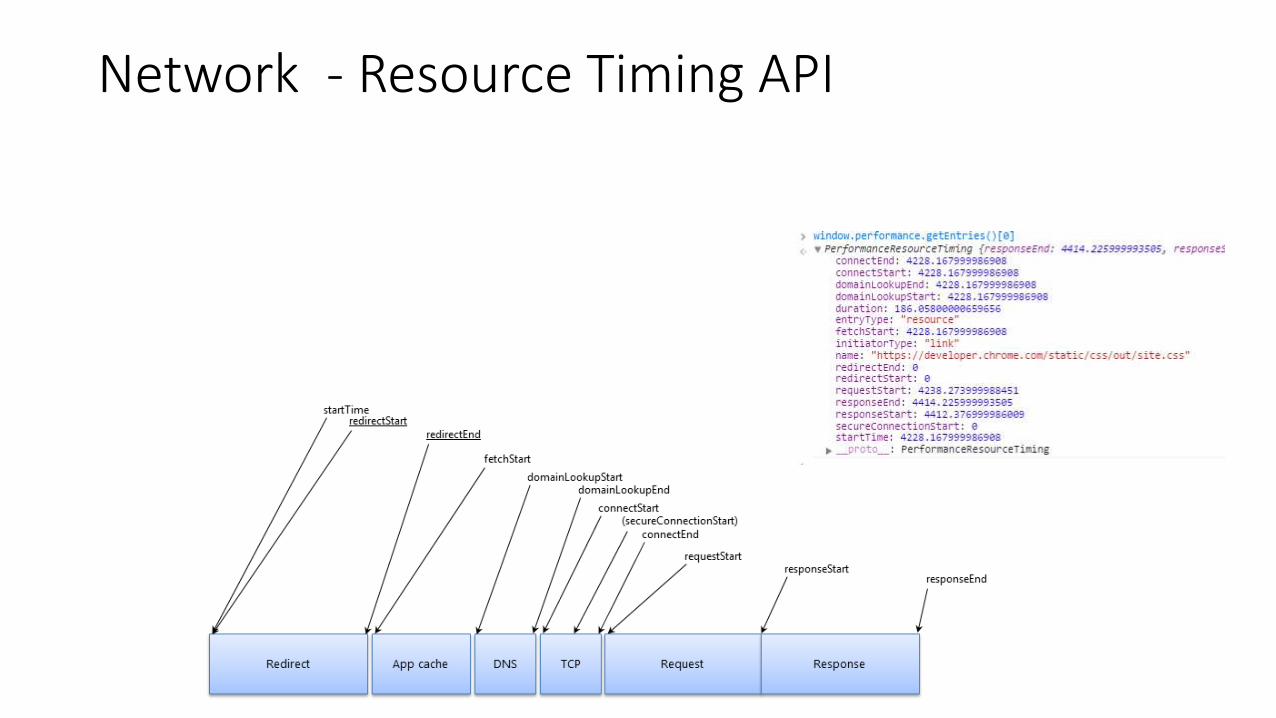
Network - Resource Timing API
Provides detailed network timing data for each loaded resource

Demo: Network
Sources
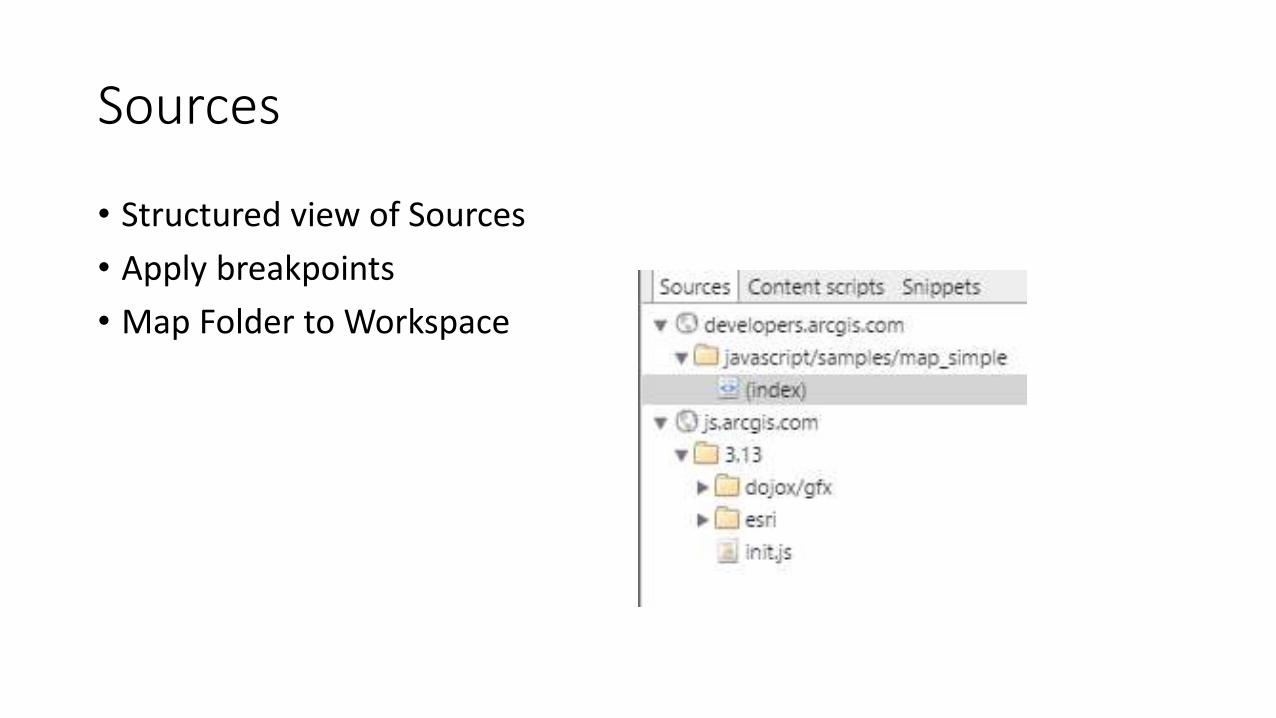
• Structured view of Sources
• Apply breakpoints
• Map Folder to Workspace

Demo: Sources
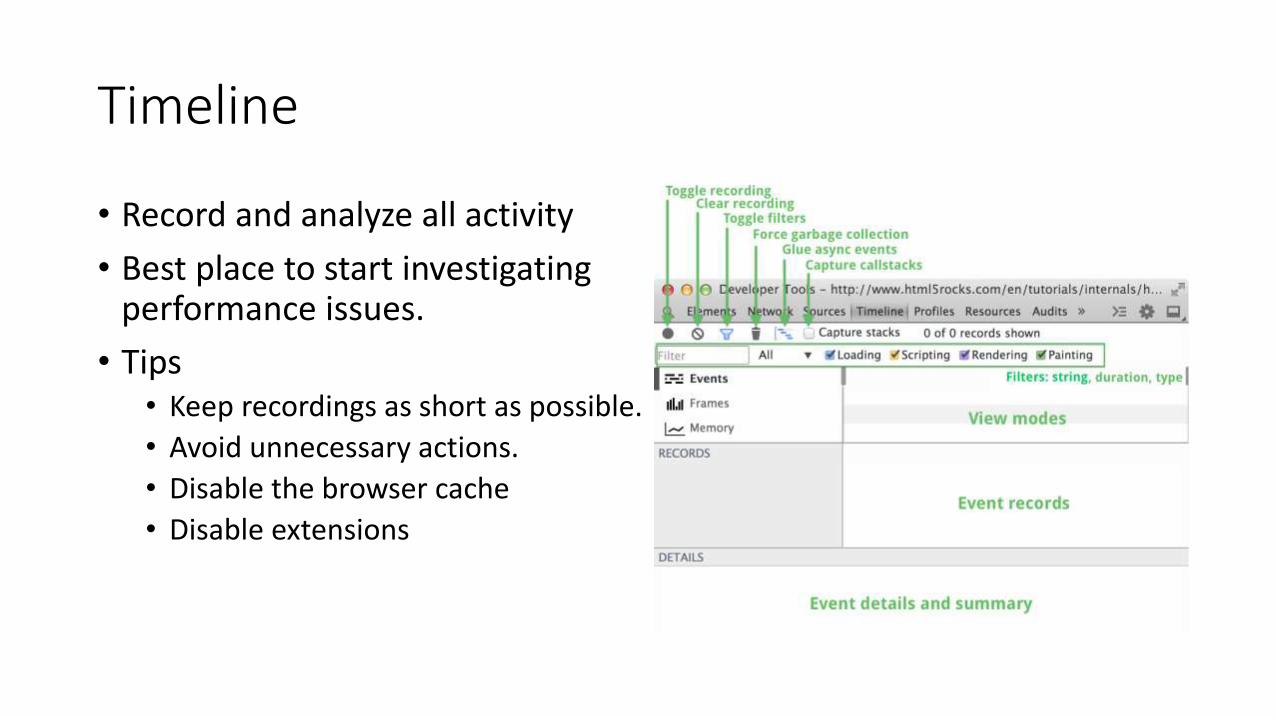
Timeline
• Record and analyze all activity
• Best place to start investigatingperformance issues.
• Tips• Keep recordings as short as possible.
• Avoid unnecessary actions.
• Disable the browser cache
• Disable extensions
Profiles
• The CPU Profiler shows where execution time is spent in your page's JavaScript functions.
• The Heap Profiler shows memory distribution by your page's JavaScript objects and related DOM nodes.
• The CSS Selector Profiler records the aggregate time spent matching selectors to elements in the DOM tree.
• Chrome Task Manager (Shift+Esc)
http://youtu.be/HAqjyCH_LOE
Resources
• Inspect local data sources like• IndexedDB
• Web SQL databases
• local and session storage
• Cookies
• Application Cache resources.
• Inspect visual resources like• Images
• Fonts
• style sheets.
Demo: Resources
Audits
• Recommendations to improve page performance
• PageSpeed Insights plugin may be a better optionhttps://developers.google.com/speed/pagespeed/
Demo: Audits
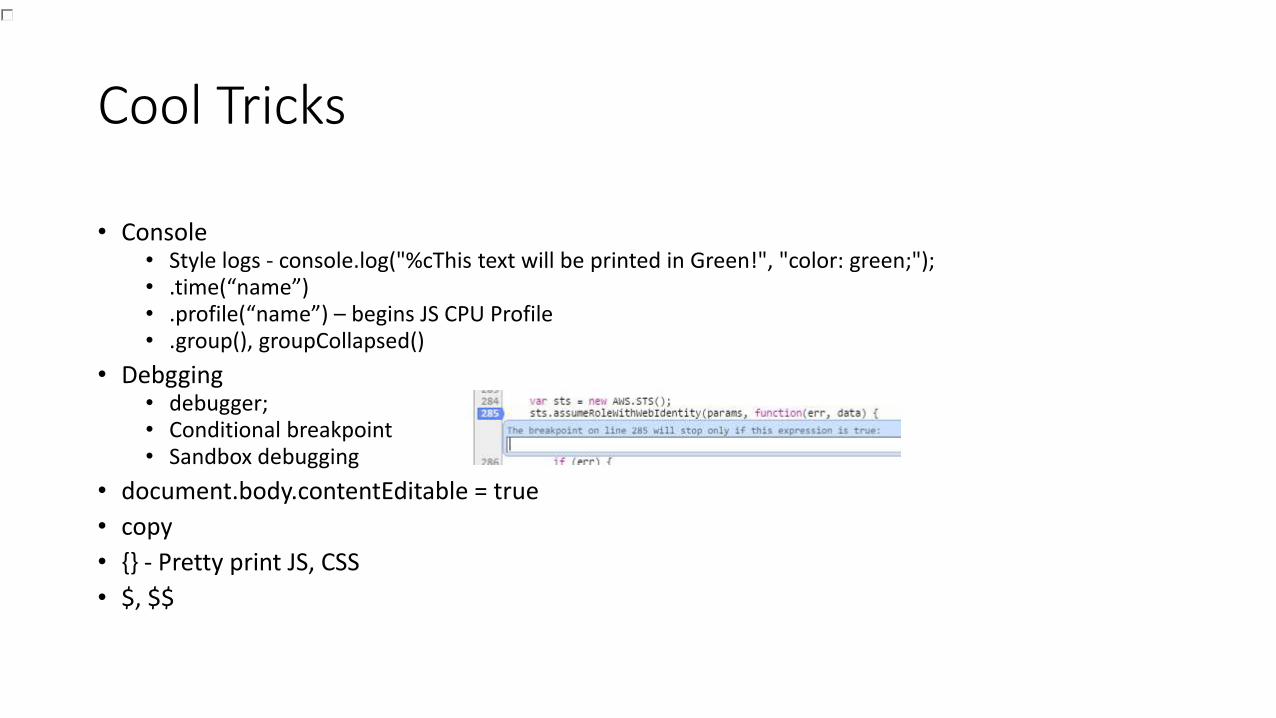
Cool Tricks
• Console• Style logs - console.log("%cThis text will be printed in Green!", "color: green;");• .time(“name”)• .profile(“name”) – begins JS CPU Profile• .group(), groupCollapsed()
• Debgging• debugger;• Conditional breakpoint• Sandbox debugging
• document.body.contentEditable = true
• copy
• {} - Pretty print JS, CSS
• $, $$
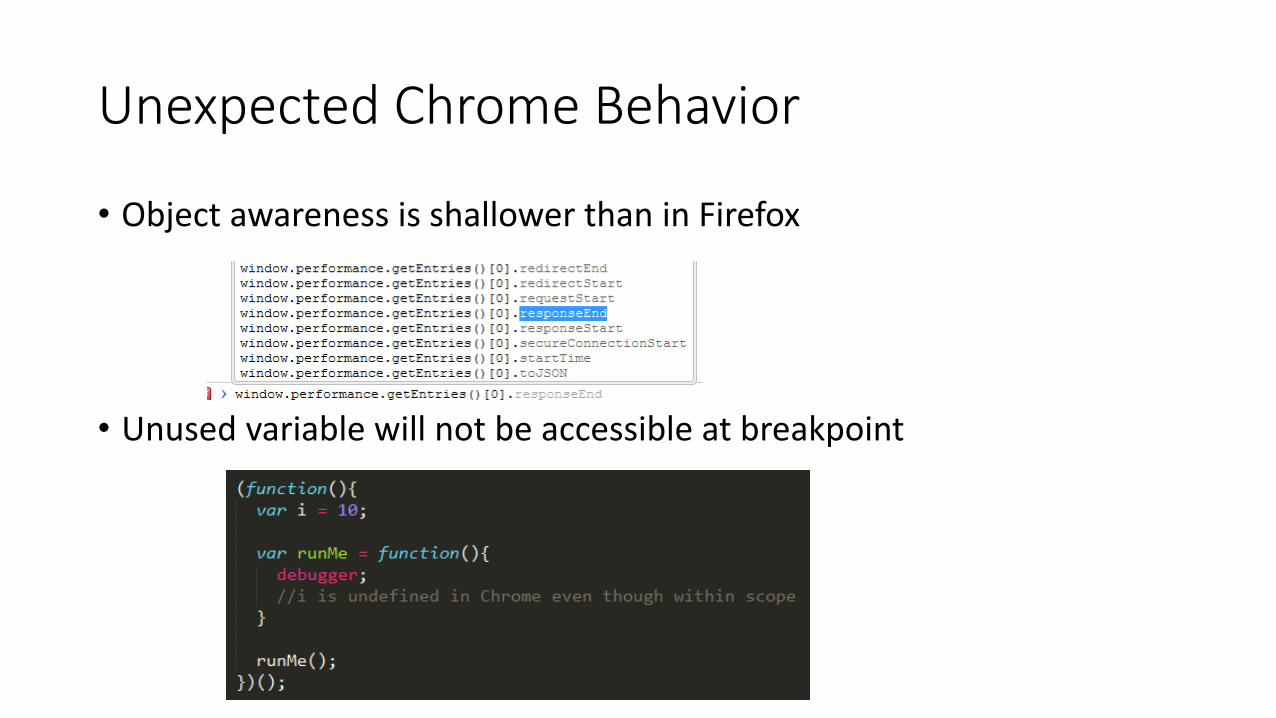
Unexpected Chrome Behavior
• Object awareness is shallower than in Firefox
• Unused variable will not be accessible at breakpoint


![Syfy Front-end Architecture - Florida Drupalcamp...Profiling the front-end through Chrome DevTools (demo!) [Part 4] In action Don't fight yourself! var animStart an imEnd navBar context)](https://img.pdfslide.us/doc/110x75/5eb44e94c04543068f4edd2c/syfy-front-end-architecture-florida-drupalcamp-profiling-the-front-end-through.jpg)