Embed Size (px)
Citation preview

INSPIRING ANALYTICS: TIPS AND EXAMPLES FOR ACHIEVING BETTER BUSINESS, NOT JUST BETTER SYSTEMSTimo Elliott
September 10-13, 2012Orlando, Florida

The last few years have seen massive changes in analytics technology, but organizations often struggle to take full advantage of these changes because they are focused on existing ways of working rather than future possibilities. You may be attending this conference primarily to learn about the updates to analytics technology, but please consider taking this opportunity to think about the higher goals of your daily work.
This presentation aims to educate, entertain, and inspire, with a wide range of examples of how people have used brand-new technology (big data, social analytics, mobile analytics, etc.) not only to remove existing analytics bottlenecks, but also rethink business processes and flip industry business models.
The best analytics system in the world is useless unless it makes a difference to the business, and explaining the new opportunities to business leaders is a critical part of any analytics project leader's role. This session is designed to give attendees concrete steps to make a real difference in their organizations.
Abstract
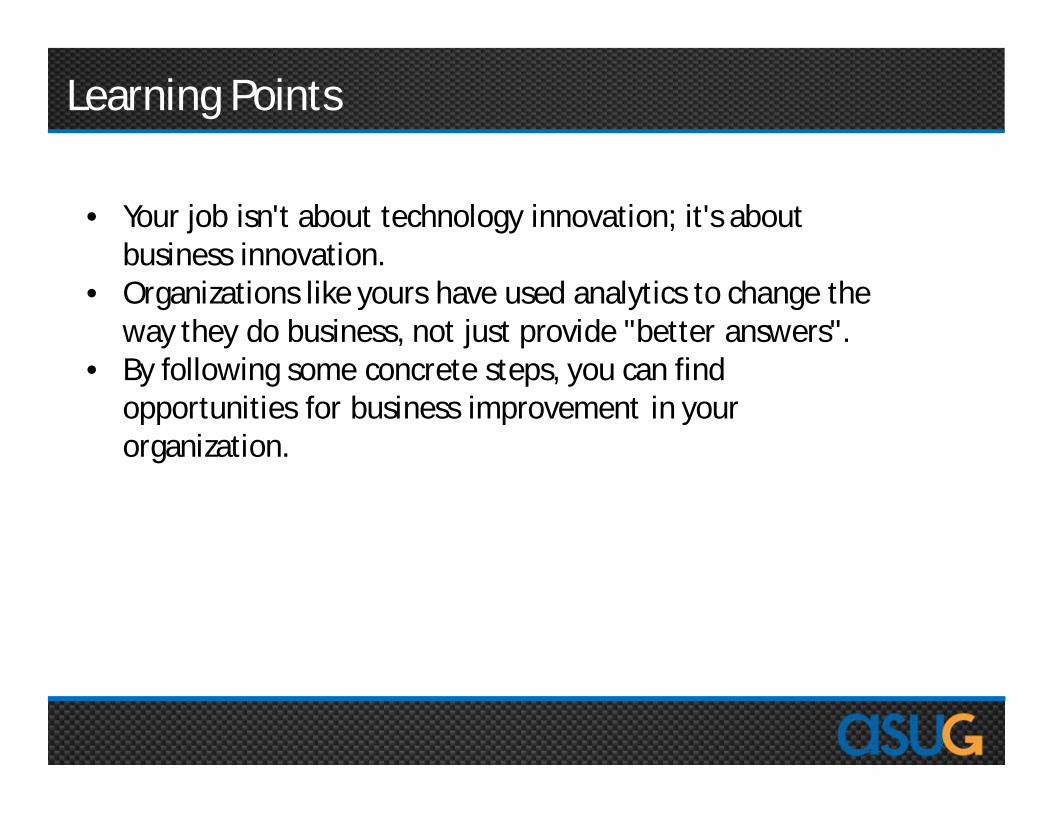
• Your job isn't about technology innovation; it's about business innovation.
• Organizations like yours have used analytics to change the way they do business, not just provide "better answers".
• By following some concrete steps, you can find opportunities for business improvement in your organization.
Learning Points

4
Business isLike Surfing
5
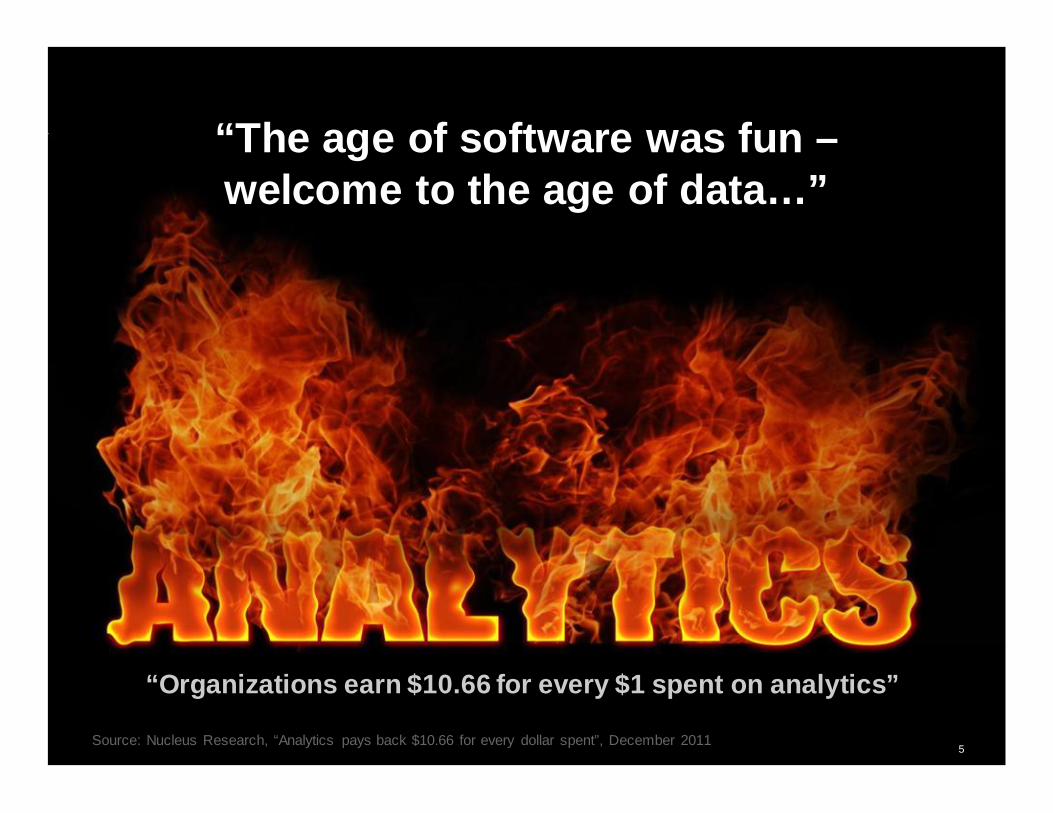
“Organizations earn $10.66 for every $1 spent on analytics”
Source: Nucleus Research, “Analytics pays back $10.66 for every dollar spent”, December 2011
“The age of software was fun –welcome to the age of data…”
6
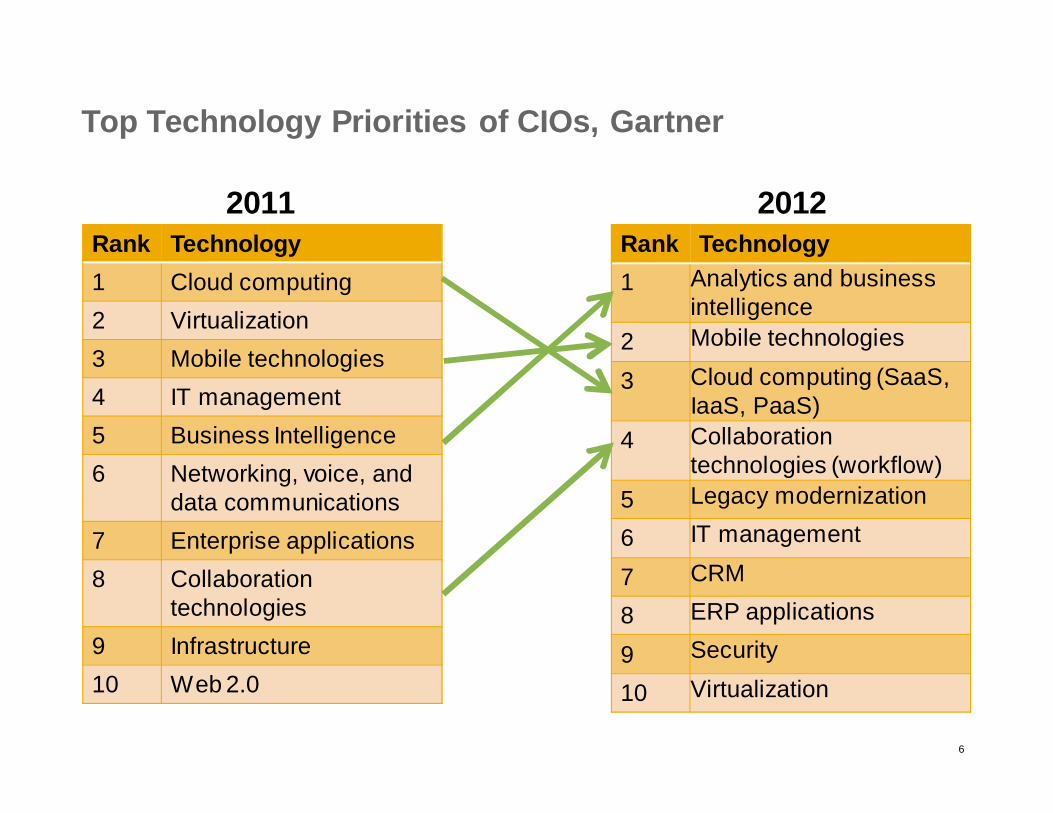
Top Technology Priorities of CIOs, Gartner
Rank Technology1 Cloud computing2 Virtualization3 Mobile technologies4 IT management5 Business Intelligence6 Networking, voice, and
data communications7 Enterprise applications8 Collaboration
technologies9 Infrastructure10 Web 2.0
Rank Technology1 Analytics and business
intelligence2 Mobile technologies
3 Cloud computing (SaaS, IaaS, PaaS)
4 Collaboration technologies (workflow)
5 Legacy modernization
6 IT management
7 CRM
8 ERP applications
9 Security
10 Virtualization
2011 2012

7
Surging Growth in Business Analytics
2009 2010 2011
+3.8%
+13.4%
Gartner: worldwide BI, analytics and performance management software revenue
BI growth has more than quadrupled over last two years!
+16.4%
“After three decades, the business analytics market is finally reaching the mainstreamThere are few growth inhibitors in the foreseeable future”
Dan Vesset, IDC

8
Analytics is an Ever-Increasing Share of IT Budget
2009 2010 2011
3.9%
+4.1%
+4.3%
Gartner: worldwide BI, analytics and performance management software revenue
“BI spending has far surpassed IT budget growth overall for several years”
Dan Sommer, Gartner
9
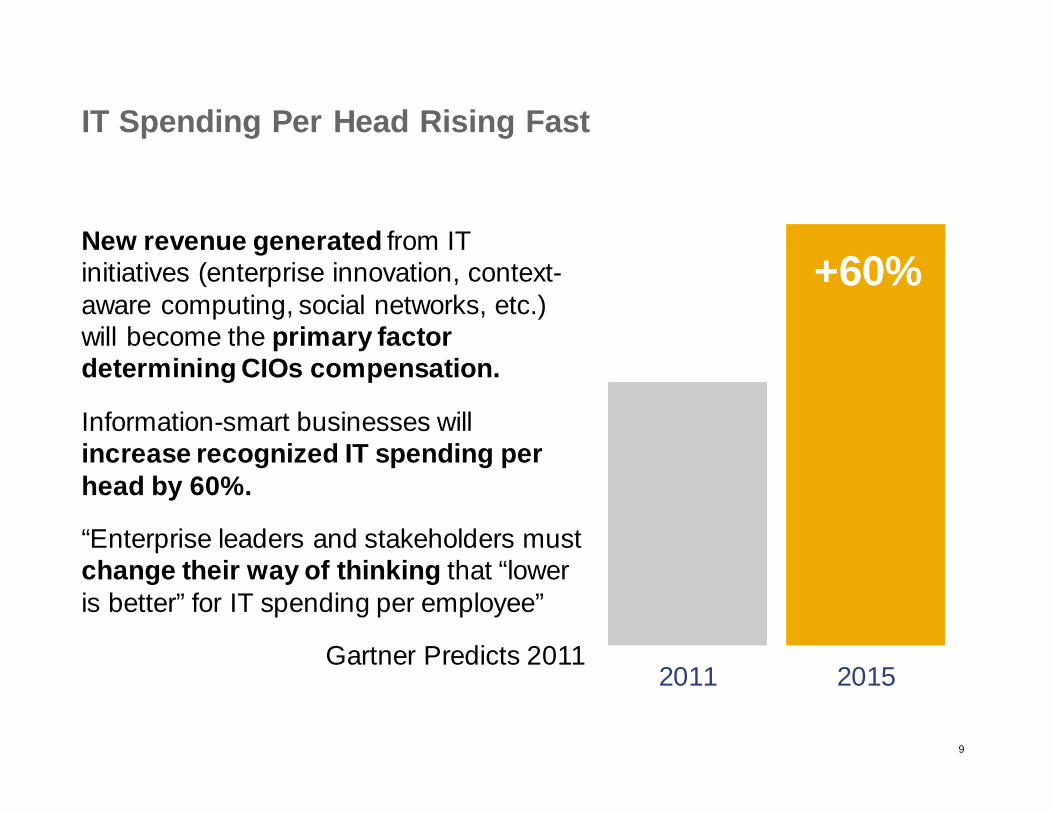
IT Spending Per Head Rising Fast
New revenue generated from IT initiatives (enterprise innovation, context-aware computing, social networks, etc.) will become the primary factor determining CIOs compensation.
Information-smart businesses will increase recognized IT spending per head by 60%.
“Enterprise leaders and stakeholders must change their way of thinking that “lower is better” for IT spending per employee”
Gartner Predicts 20112011 2015
+60%
10
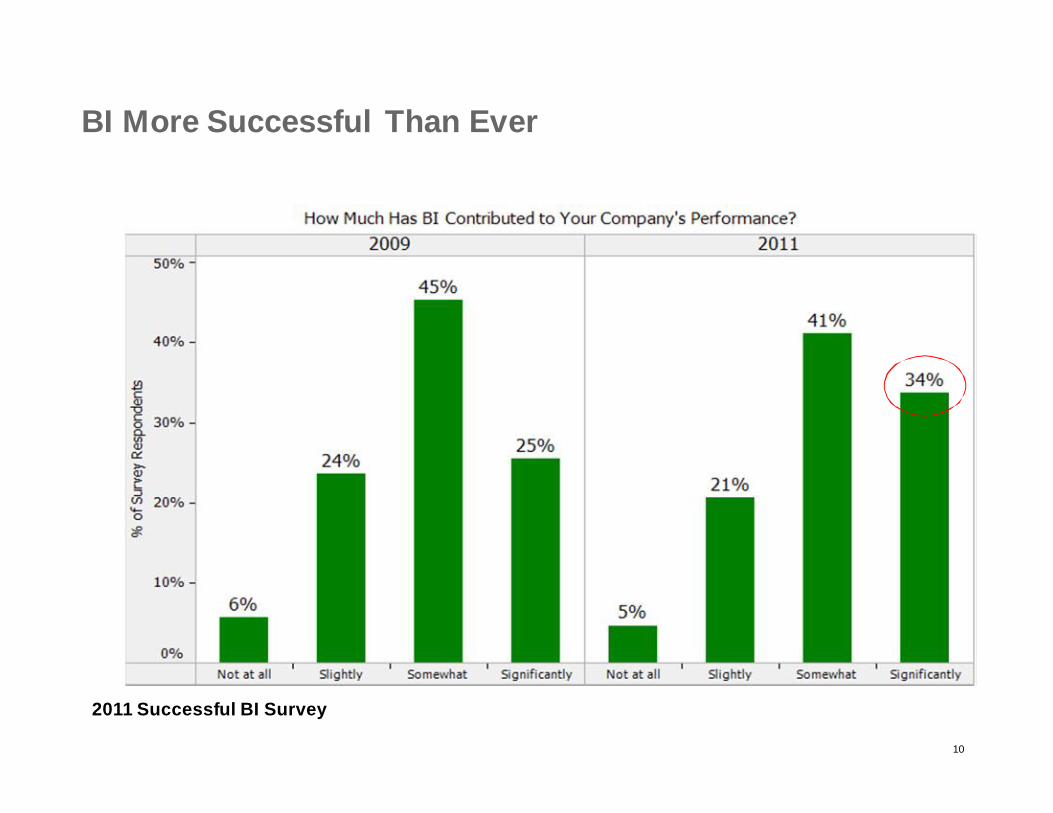
2011 Successful BI Survey
BI More Successful Than Ever

11
Business Analytics Market (BI, EPM, Analytic Applications)Share of Market, 2011
Business Analytics Market Shares
SAPOracle
SAS Institute
IBM
15.6%
12.6%
12.1%
24%
Gartner Market Share Analysis: Business Intelligence, Analytics and Performance Management Software, Worldwide, published April 2012
Microsoft 8.1%

12
Technology Trends

13
Sum of All This = Better Business
Systems of Engagement?

14
High-Resolution Management
“Right now, your company has:• 21st-century, Internet-enabled business processes• mid-20th-century management processes• all built atop 19th-century management principles.”
– Gary Hamel

Remove BottlenecksGive business people what they’ve been asking for

16
In-Memory Computing is Like Photography
A transformative technology that slowly but surely upturns the whole industry

17
Business / IT Tension
I need my reports NOW!
But the system can’t
cope!

18
Colgate-Palmolive
Able to run detailed profitability analysis for
the first time

19
Provimi
“3-3-3 Just do it!”
Increased working capital by €20 Million

20
Red Bull
Improved data compression and load times:
1.5 TB 300 GB50 mins 2 mins

21

22
Danone
Sustainability reporting on 35,000 products
23
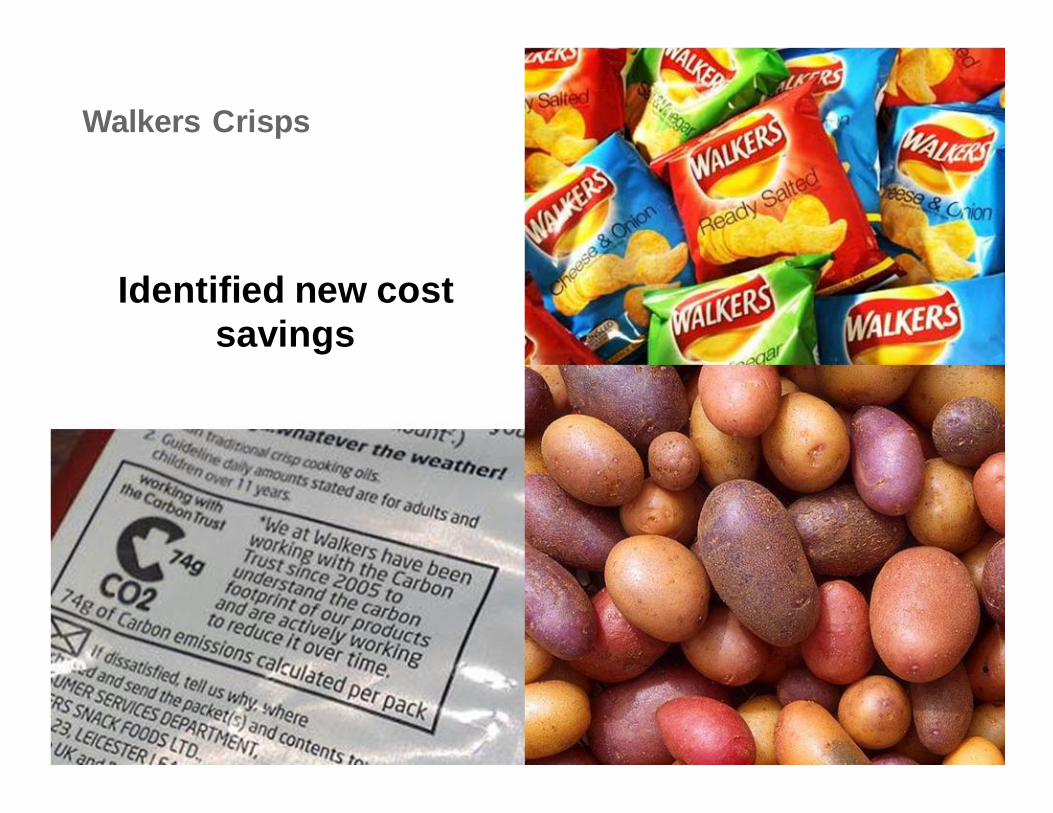
Walkers Crisps
Identified new cost savings

24
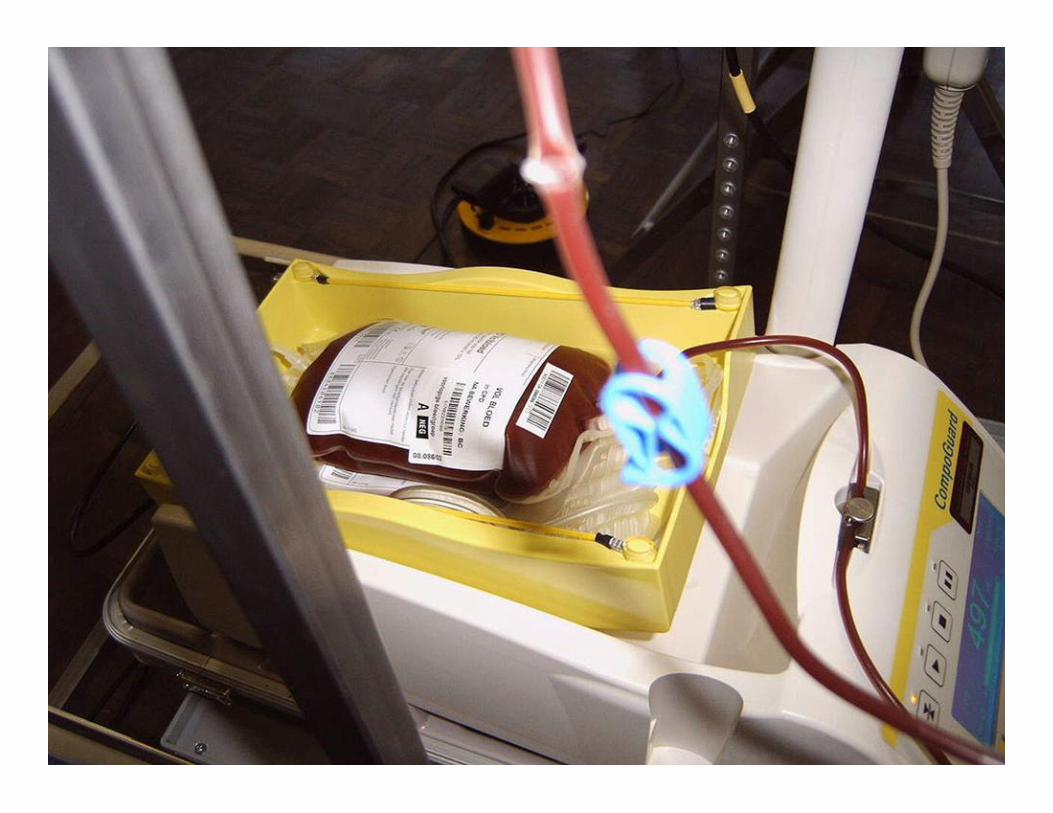
Medtronic
Combine structured and unstructured data for
business value

25
What About Social Data?
26
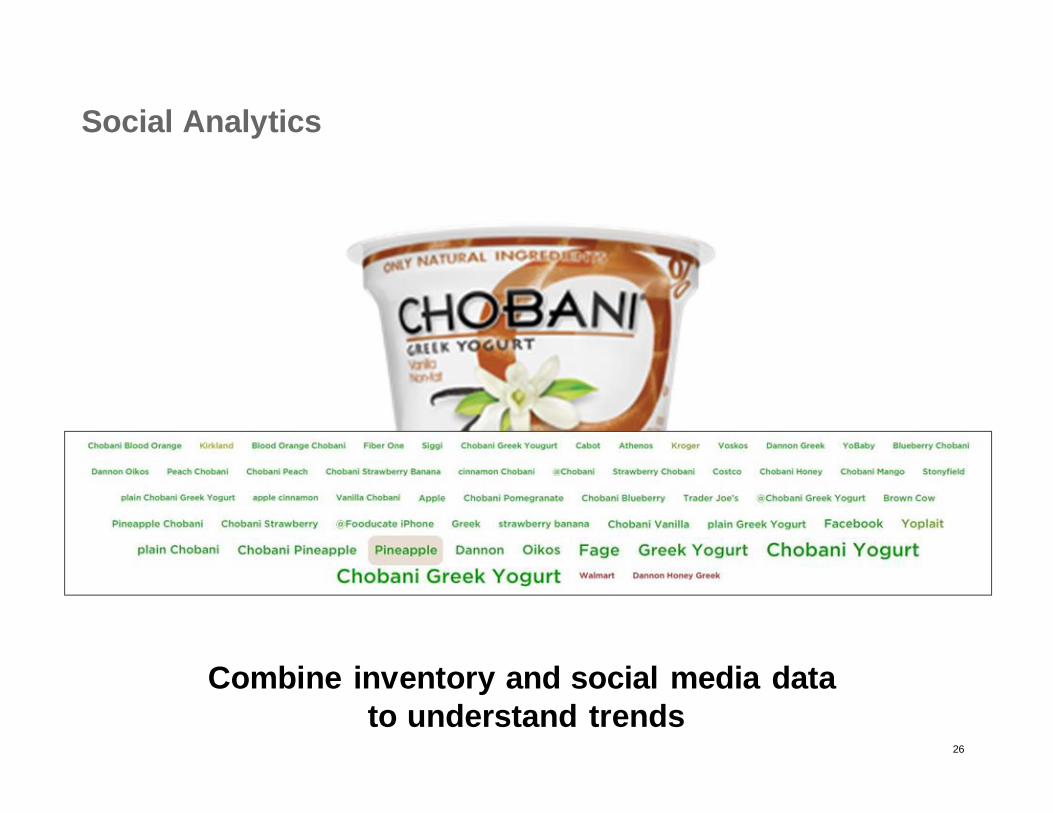
Social Analytics
Combine inventory and social media datato understand trends
27
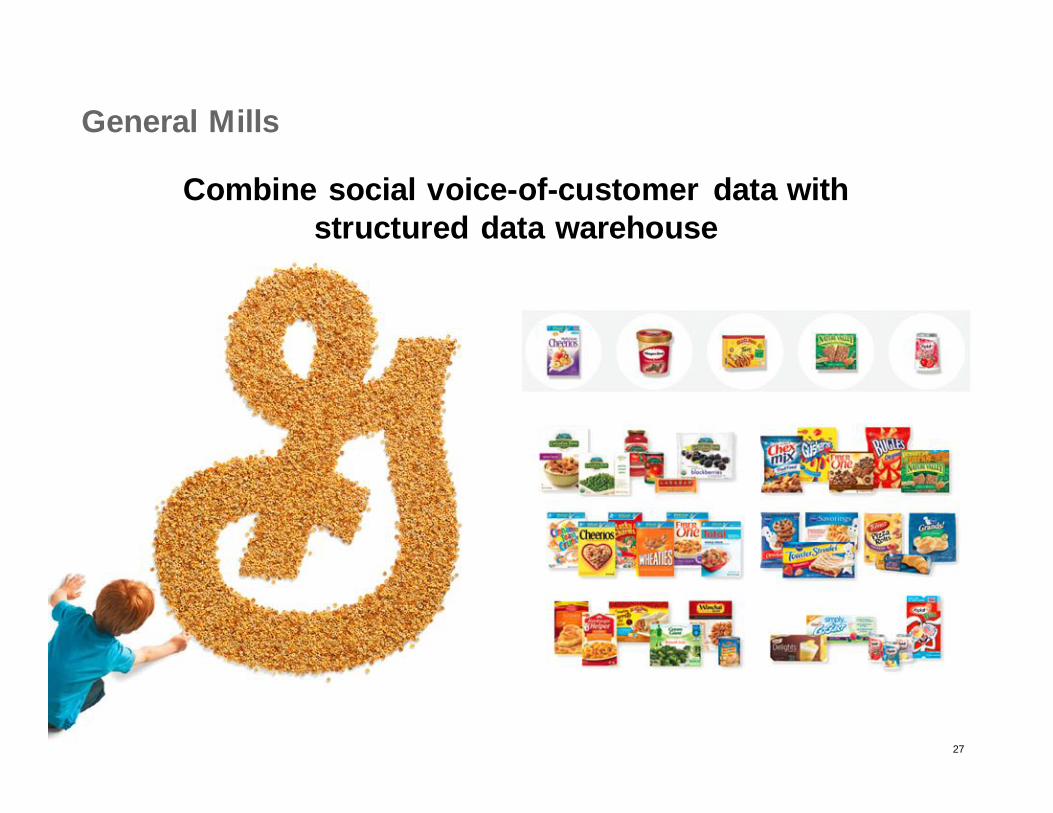
General Mills
Combine social voice-of-customer data with structured data warehouse

28
Zespri
Complex planning to optimize 100M trays of
Kiwi fruit / year

29
Mobility

30
Altron Allied Electronics
“The days of our users and execs being in the office have gone. They work from home or on the road.
We had to develop a solution that gets information out to where our people are. Everything we do is mobile first.
In addition, it’s less cumbersome and cheaper to buy and use a tablet than any other form.”
Debra-Lynn MaraisGroup Information Manager
Altron Allied Electronics

31
Cornell Bookstore
Predictive analytics on out-of-stock books
.
Dependent factors
Hidden relationship
Limitation of regression model
Forecasting based on multiple factors

32
Cleveland Clinic

33
34

35
Can You Remove Bottlenecks in Your Business?
Flexibility
Unstructured dataSustainability
Social dataAccess on the move
Transparency
Data Volume/ Complexity

It’s not about knowing, it’s about doing
37
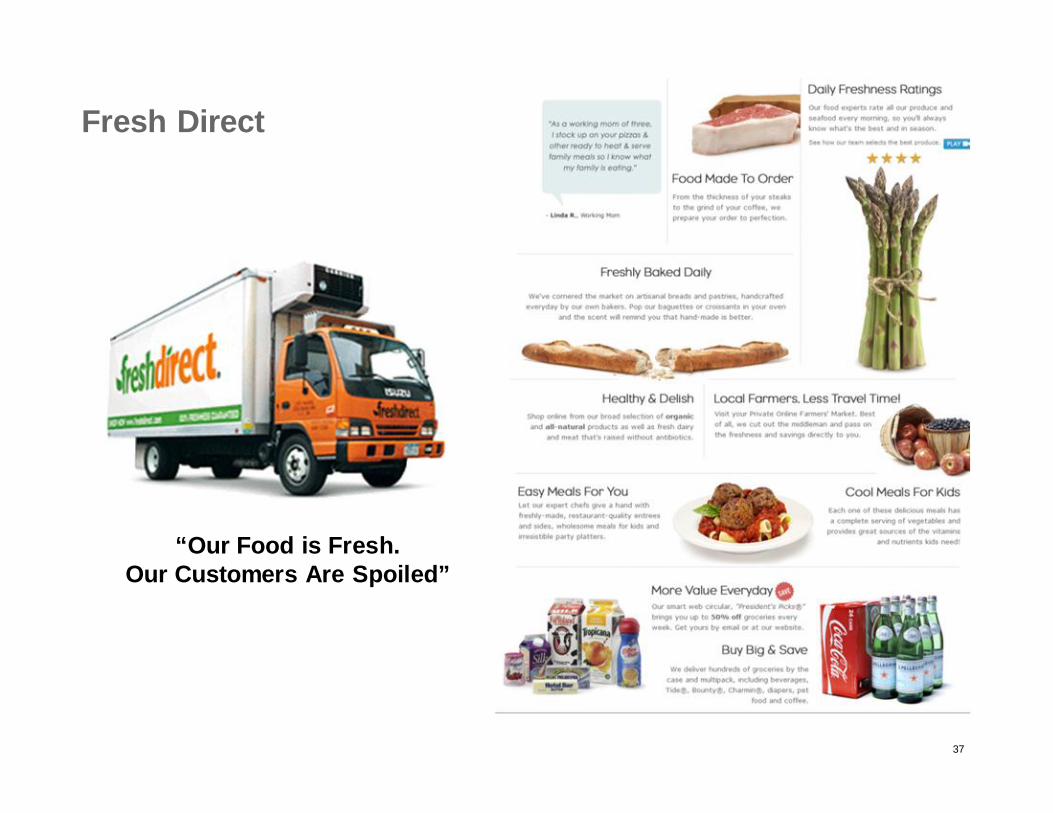
Fresh Direct
“Our Food is Fresh.Our Customers Are Spoiled”

38

39
React to changes in time to make a difference

40
Parking Ticket Optimization
Leverage spatial data
41
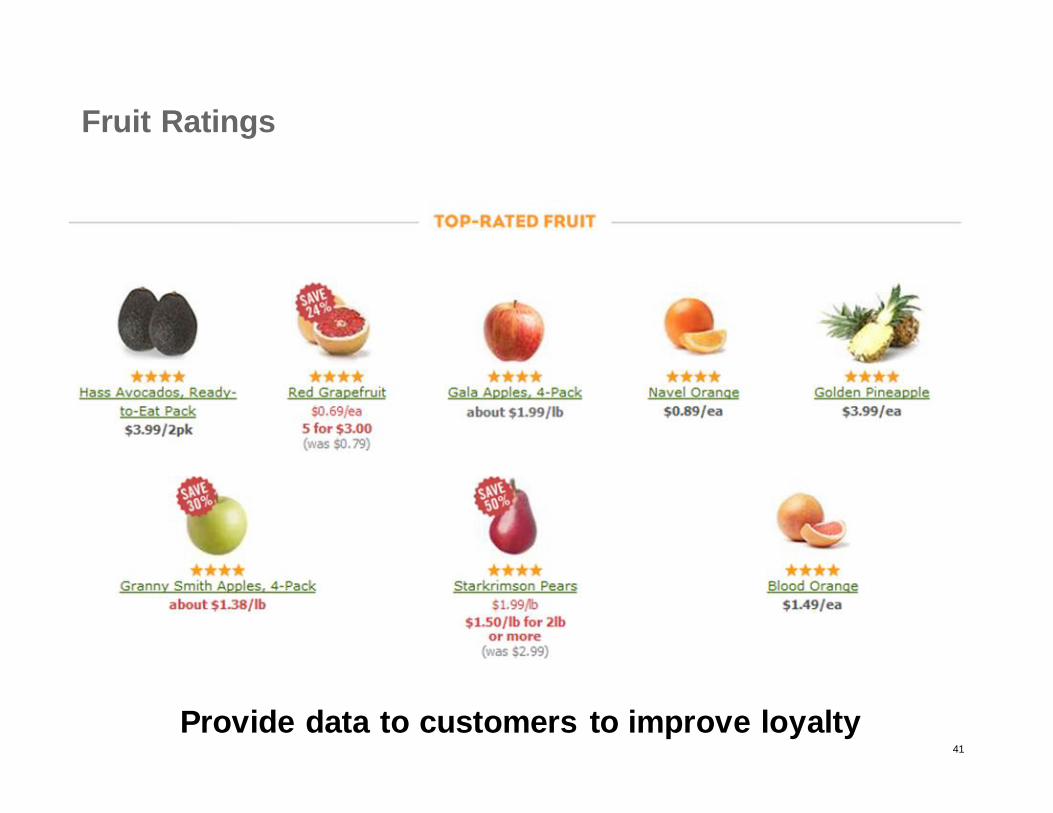
Fruit Ratings
Provide data to customers to improve loyalty

42
Houghton Mifflin Harcourt
Better predictions for competitive advantage

43
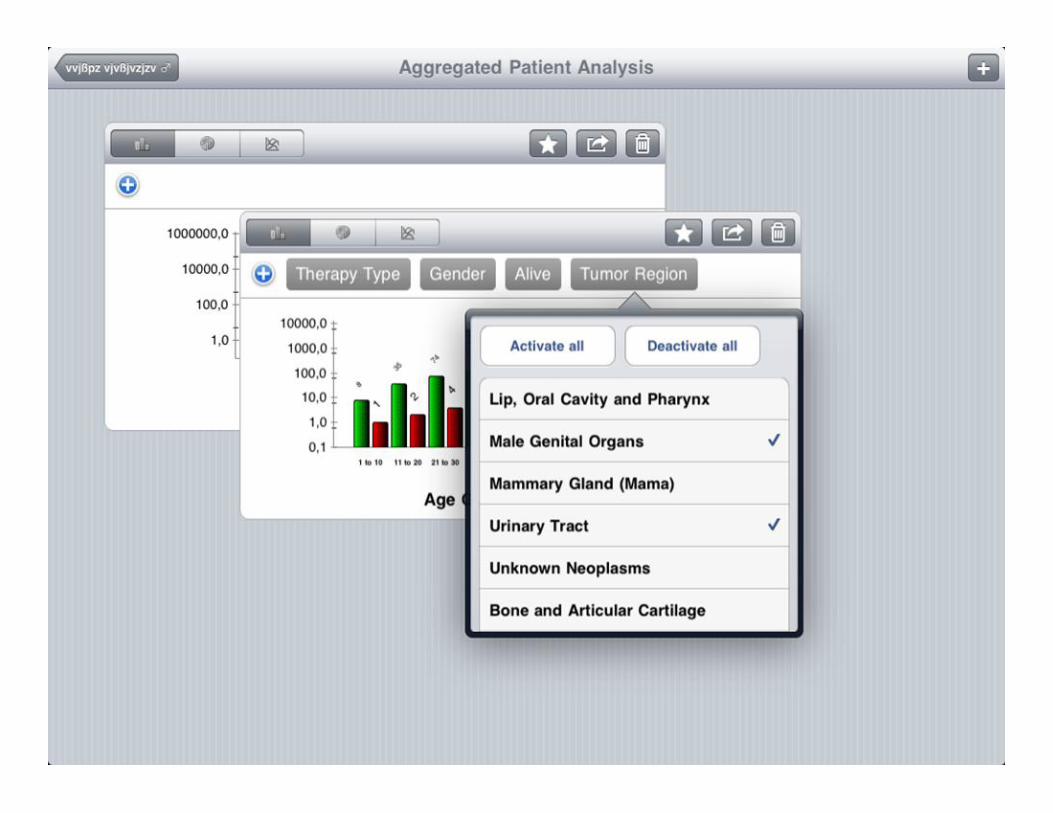
Charité University Hospital
Doctors with tablets
Rethink processes using mobile devices
44

45
Customer Intimacy

46

47
Mobile Tracking: Airports
47
>1m data points per day and growing (~10% customers with smartphones)

48
Telemetry for the Rest of Us
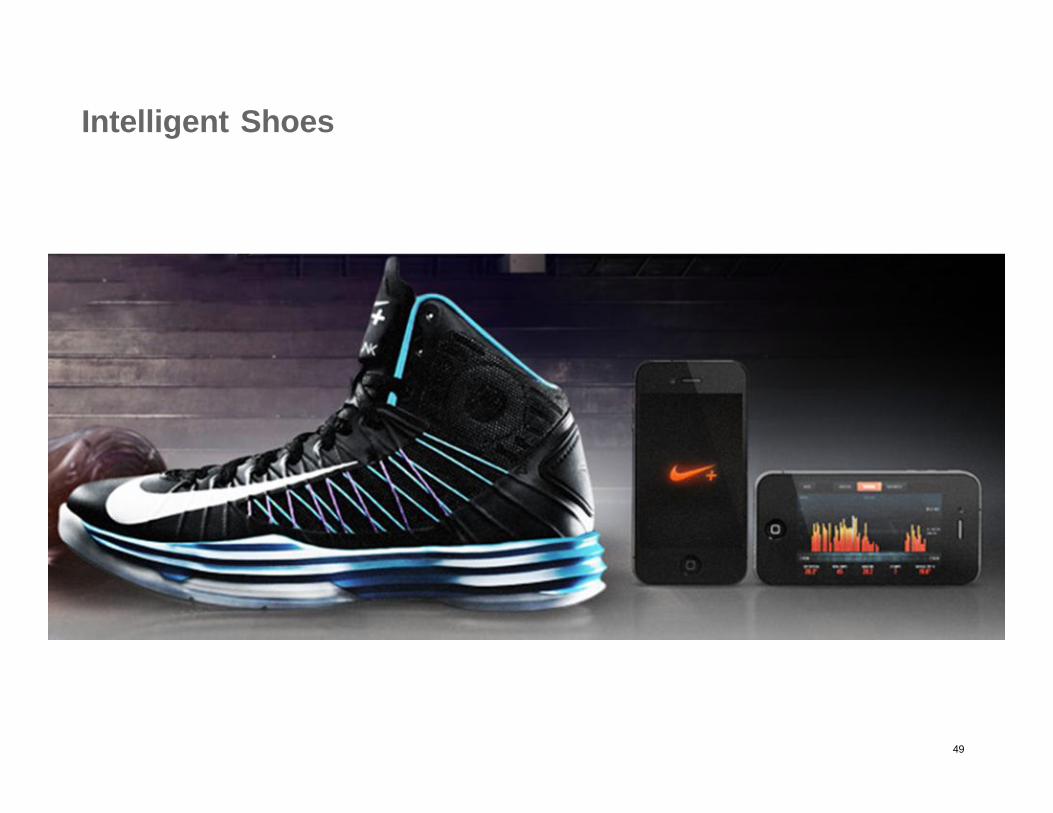
49
Intelligent Shoes

50
Intelligent Pills

51
Snail Tracking
Creative interpretation of a transponder-wearing snail

52
Snail Tracking

53
Smart Meters
1.8 Million Smart Meters by 2015

54
Efficiency Savings: $70 million over three years

55
Electricity Theft
77,000 homes, $100 Million a Year, 3% of bills

56
0
0,01
0,02
0,03
0,04
0,05
0,06
0
0,01
0,02
0,03
0,04
0
0,01
0,02
0,03
0,04
0,05
0,00E+00
2,00E-02
4,00E-02
6,00E-02
8,00E-02
1,00E-01
0
0,01
0,02
0,03
0,04
0,05
0 hrs 24 hrs
cons
umpt
ion
[kW
h]
Smart Meter Analysis
0
0,01
0,02
0,03
0,04
0,05
0,06
0
0,01
0,02
0,03
0,04
0
0,01
0,02
0,03
0,04
0,05
0,00E+00
2,00E-02
4,00E-02
6,00E-02
8,00E-02
1,00E-01
0
0,01
0,02
0,03
0,04
0,05
0 hrs 24 hrs
cons
umpt
ion
[kW
h]
Millions of daily consumption profiles contain valuable information about customer behavior for a better energy management
typical size: millions of daily profiles1
Instead of exploring millions of individual profiles it is sufficient to take a look at the typical pattern in the data to understand user behavior. Those pattern are the basis for other follow-up processes
3
In-memory pattern recognition algorithm crunches typical load profiles out of those huge amount of data to “summarize” those data and categorize user behavior.
2

57

58
Can You Rethink Your Business?
Geographic Analysis
Predictive, Risk-Based PlanningCustomer Interaction Applications
Mobile ApplicationsSensor Data
Customer-Facing Benchmarks
Real-Time Decisions

Flip Business ModelsLead industry change

60
Analytics First
An author with a novel idea…

61

62
Personalized Offer Testing

63
Can You Flip Your Business Model?
Customized, Personalized
Work With Your EcosystemIterative, Real-Time Improvements
Turn Products Into Services
“Unthinkable Apps”

64
The New Analytic Possibilities Are Endless…
Instantly predict market trends and customer needs
Predict how market price volatility will impact your production plans
See changes in demand or supply across your entire Supply Chain immediately
Monitor and analyze all deviations and quality issues in your production process
Provide exactly the right offers and service levels to every customer
Have a continuously-updated window onto future sales, showing changes in real time
Understand what your customers and potential customers are saying about you, right now
Predict cash flows to manage collections, risk and short-term borrowing in real time

65
Business Intelligence Innovation
Mobile
First experience for BIContent to point of impactExpand to untapped users
Extreme
Big dataReal-timePredictive
BI Core
Core for innovationComplete BI SuiteContinued Leadership
Creative
For IT and DepartmentFast time-to-valueConnected to the Enterprise
Social
Capture the decisionOpinion and FactsLeverage the network
Innovation without Disruption

66
We Have Faulty Perceptions
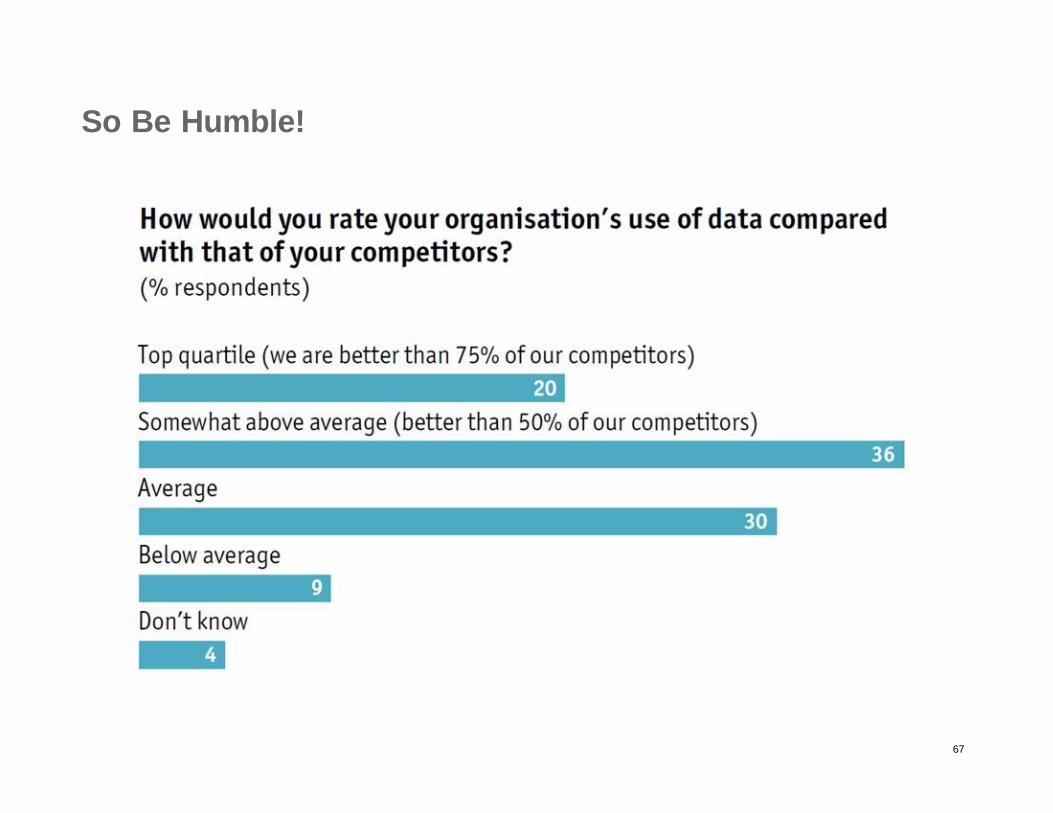
67
So Be Humble!

68
“The stone age was marked by man's clever use of crude tools; the information age, to date, has been marked by man's crude use of clever tools.”
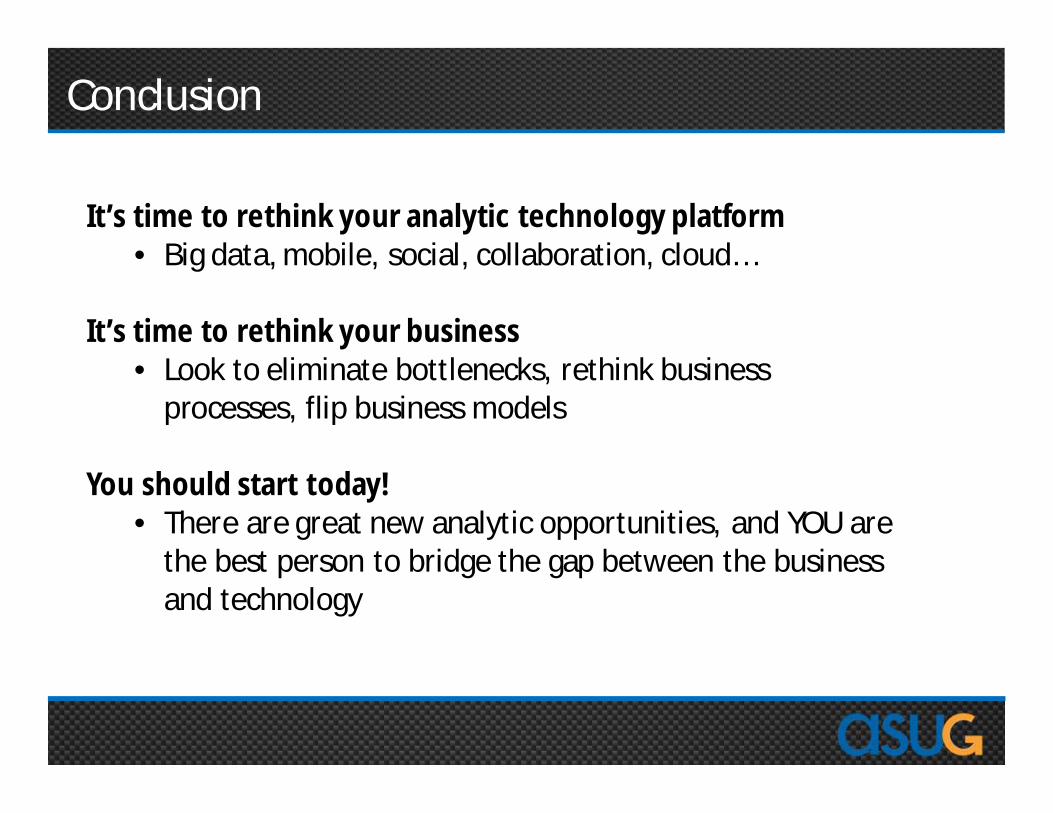
It’s time to rethink your analytic technology platform• Big data, mobile, social, collaboration, cloud…
It’s time to rethink your business• Look to eliminate bottlenecks, rethink business
processes, flip business models
You should start today!• There are great new analytic opportunities, and YOU are
the best person to bridge the gap between the business and technology
Conclusion

Thanks!
Email:[email protected]
Business Analytics Blog:timoelliott.com
You Should Follow Me on Twitter: @timoelliott
Thank you for participating.
Please provide feedback on this session by completing a short survey via the event
mobile application.
SESSION CODE: 1204
Learn more year-round at www.asug.com