Embed Size (px)
Citation preview

ICANN e-friction Refresh AIS Tunis 04Jun15.pptx 1
Cop
yrig
ht ©
201
5 by
The
Bos
ton
Con
sulti
ng G
roup
, Inc
. All
right
s re
serv
ed.
Africa: 300 million people online—10 per cent of the global Internet population
Source: www.internetworldstats.com
But: 20 per cent of world’s offline population is in Africa
0
10
20
30
40
50
60
70
80
90
100
N. America Oceania Europe LatAm/Carib. Middle East Asia Africa
Online population by continent (%)

ICANN e-friction Refresh AIS Tunis 04Jun15.pptx 2
Cop
yrig
ht ©
201
5 by
The
Bos
ton
Con
sulti
ng G
roup
, Inc
. All
right
s re
serv
ed.
Some African countries are well penetrated
Source: www.internetworldstats.com
With over 800m non-users, what’s preventing further Internet penetration in Africa?
0
10
20
30
40
50
60
Morocco Seychelles Egypt S. Africa Tunisia Mauritius Cabo Verde Nigeria Kenya São Tomé and
Príncipe
Online population by country (%)

ICANN e-friction Refresh AIS Tunis 04Jun15.pptx 3
Cop
yrig
ht ©
201
5 by
The
Bos
ton
Con
sulti
ng G
roup
, Inc
. All
right
s re
serv
ed.
e-Friction: The Global Perspective

ICANN e-friction Refresh AIS Tunis 04Jun15.pptx 4
Cop
yrig
ht ©
201
5 by
The
Bos
ton
Con
sulti
ng G
roup
, Inc
. All
right
s re
serv
ed.
More users, traffic, and international capacity
Global Internet users (Bn) • 0.5 (2000) • 2.3 (2014) • 5.0 (2020)
Monthly Internet traffic per user • 10 MB (2000) • 5 GB (2013) • 14 GB (2018)
International bandwidth capacity • 14 Tbps (2008) • 137 Tbps (2014)
+12% p.a. +50% p.a.
+46% p.a.
Source: BCG Analysis

ICANN e-friction Refresh AIS Tunis 04Jun15.pptx 5
Cop
yrig
ht ©
201
5 by
The
Bos
ton
Con
sulti
ng G
roup
, Inc
. All
right
s re
serv
ed.
The Internet is no longer discretionary
… to social …
… to commerce and entertainment …
… to ubiquity From
academia …
ICANN e-friction Refresh AIS Tunis 04Jun15.pptx 6
Cop
yrig
ht ©
201
5 by
The
Bos
ton
Con
sulti
ng G
roup
, Inc
. All
right
s re
serv
ed.
Not for wider circulation beyond today's call
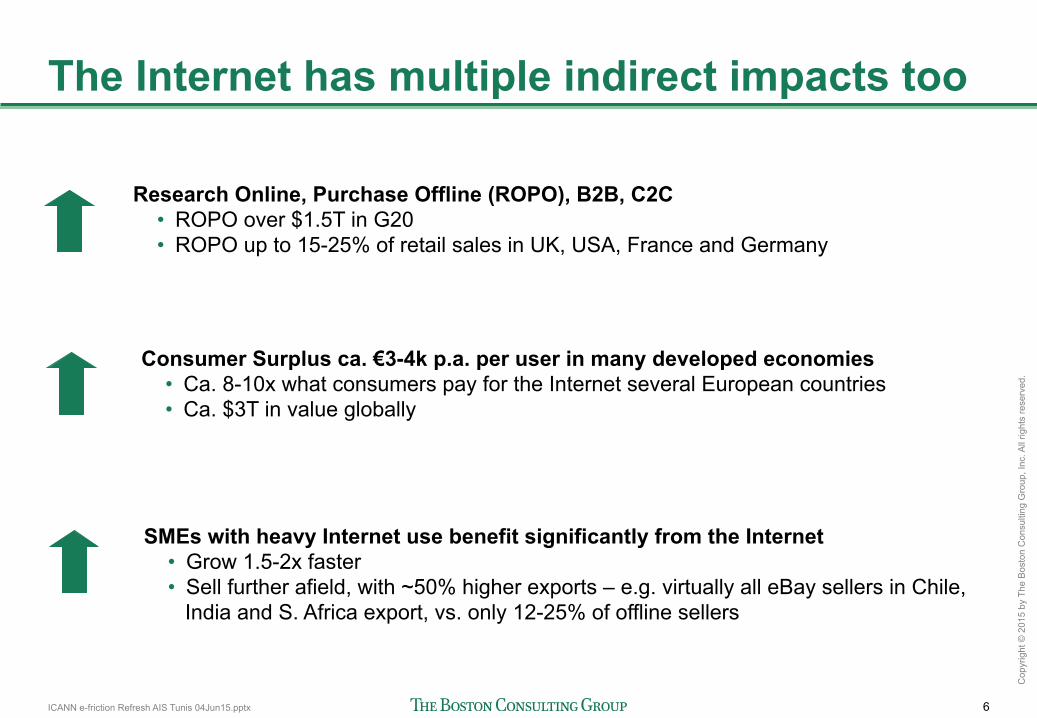
The Internet has multiple indirect impacts too
Consumer Surplus ca. €3-4k p.a. per user in many developed economies • Ca. 8-10x what consumers pay for the Internet several European countries • Ca. $3T in value globally
Research Online, Purchase Offline (ROPO), B2B, C2C • ROPO over $1.5T in G20 • ROPO up to 15-25% of retail sales in UK, USA, France and Germany
SMEs with heavy Internet use benefit significantly from the Internet • Grow 1.5-2x faster • Sell further afield, with ~50% higher exports – e.g. virtually all eBay sellers in Chile,
India and S. Africa export, vs. only 12-25% of offline sellers

ICANN e-friction Refresh AIS Tunis 04Jun15.pptx 7
Cop
yrig
ht ©
201
5 by
The
Bos
ton
Con
sulti
ng G
roup
, Inc
. All
right
s re
serv
ed.
The Internet economy is not frictionless
"Is there network coverage?"
"I don't speak Thai!"
"No connectivity ….."
"Can it be delivered here?"
"Can I trust online payments?"
"How much is this going to cost me?"
"Do I have an access device?"
"Will my bid go through in time?"

ICANN e-friction Refresh AIS Tunis 04Jun15.pptx 8
Cop
yrig
ht ©
201
5 by
The
Bos
ton
Con
sulti
ng G
roup
, Inc
. All
right
s re
serv
ed.
“e-Friction”: factors holding back the development of the Internet economy
Source: BCG e-Friction model
Infrastructure Weighted 3/6
Industry Weighted 1/6
Frictions holding back companies from adopting the Internet
Frictions related to the availability of content
Frictions deterring consumers from online activity
Frictions reducing opportunities to access the Internet

ICANN e-friction Refresh AIS Tunis 04Jun15.pptx 9
Cop
yrig
ht ©
201
5 by
The
Bos
ton
Con
sulti
ng G
roup
, Inc
. All
right
s re
serv
ed.
Country e-Friction score
Infra-structure Industry Individual Infor-
mation 1. Sweden 14 15 15 10 16 2. Finland 17 21 16 8 14 3. Denmark 21 21 37 15 11 4. Switzerland 21 22 21 13 27 5. Hong Kong 21 18 9 22 43 6. United States 22 23 26 28 11 7. Iceland 22 17 34 36 14 8. Norway 23 25 26 14 20 9. Netherlands 25 28 21 13 30 10. Canada 25 32 28 13 15 11. Germany 26 28 35 17 18 12. United Kingdom 28 29 27 29 25 13. Austria 29 27 40 25 29 14. Australia 30 38 26 27 15 15. Singapore 31 30 9 25 66 16. Belgium 32 34 27 23 42 17. New Zealand 33 42 30 27 17 18. Ireland 34 34 41 36 24 19. France 34 38 33 26 32 20. Estonia 35 35 47 43 19 21. Japan 39 33 32 50 53 22. Israel 39 37 39 39 48 23. Qatar 40 51 19 23 44 24. UAE 41 45 25 33 49 25. Korea, Rep. 41 28 45 47 69 26. Slovenia 44 34 58 56 47 27. Bahrain 44 41 42 36 60 28. Malaysia 44 52 28 42 40 29. Poland 45 45 65 42 31 30. Portugal 45 43 43 49 51 31. Romania 46 29 81 70 35 32. Czech Republic 46 38 62 47 54
Country e-Friction score
Infra-structure Industry Individual Infor-
mation 33. Spain 47 46 52 43 51 34. Panama 48 42 39 57 65 35. Hungary 48 47 62 59 30 36. Italy 49 42 64 62 41 37. Bulgaria 53 39 71 76 55 38. Greece 53 49 65 65 43 39. Ukraine 54 45 77 74 33 40. Kuwait 56 55 73 53 47 41. Chile 57 60 44 55 61 42. Jordan 57 53 48 67 69 43. Russia 57 49 73 59 66 44. Saudi Arabia 58 54 36 54 92 45. Turkey 58 52 60 59 76 46. Kazakhstan 64 58 70 61 76 47. Philippines 64 71 61 65 43 48. Thailand 64 61 59 63 81 49. Argentina 67 61 91 76 53 50. South Africa 67 75 50 63 68 51. Mexico 68 66 69 79 59 52. Brazil 69 67 71 71 68 53. China 69 73 56 66 75 54. Morocco 70 72 58 76 73 55. Venezuela 71 66 88 80 58 56. Colombia 71 72 76 75 61 57. Kenya 71 80 71 68 51 58. India 73 79 52 71 77 59. Indonesia 74 78 56 75 78 60. Peru 75 79 71 84 55 61. Vietnam 75 69 73 82 87 62. Bangladesh 75 74 86 90 53 63. Egypt 76 78 77 92 55 64. Pakistan 82 79 72 89 92 65. Nigeria 82 89 77 86 59 Top Bottom - Quintiles
Note: Best e-Friction available is 0, worst is 100
So how do African countries perform in 65 Countries?

ICANN e-friction Refresh AIS Tunis 04Jun15.pptx 10
Cop
yrig
ht ©
201
5 by
The
Bos
ton
Con
sulti
ng G
roup
, Inc
. All
right
s re
serv
ed.
Lower e-Friction – higher Internet penetration National Internet penetration vs. e-Friction score
Source: Digital, Social and Mobile 2015 – slide 17 – Quoted source: InternetLiveStats Q12015, InternetWorldStats Q12015. Wikipedia for population data.
0% 20% 40% 60% 80% 100%
Germany Hong Kong
National Internet penetration (%)
United Kingdom
United States
e-Friction score
Canada
United Arab Emirates
Singapore
Korea, Rep. Japan
France Australia
Spain
Poland Malaysia Italy
Turkey
Thailand
South Africa
Russia Philippines
Brazil Argentina
Vietnam Nigeria
Indonesia India
Egypt
Top Bottom - Quintiles
0
100
20
40
60
80
R2 = 0.76

ICANN e-friction Refresh AIS Tunis 04Jun15.pptx 11
Cop
yrig
ht ©
201
5 by
The
Bos
ton
Con
sulti
ng G
roup
, Inc
. All
right
s re
serv
ed.
Which wheels to grease beyond infrastructure?
Literacy
Local Content
ICT Skills

ICANN e-friction Refresh AIS Tunis 04Jun15.pptx 12
Cop
yrig
ht ©
201
5 by
The
Bos
ton
Con
sulti
ng G
roup
, Inc
. All
right
s re
serv
ed.
Key messages so far
A high share of the global population is in countries with above average e-Friction • 80 percent of the global population, but over 90 percent of the global offline
population
Countries in the top quintile have digital economies that are, on average, 2.5 percentage points larger than those in the bottom quintile • A conservative indication of the Internet’s impact, given that much impact is “beyond
GDP”
Some countries “get it right” on all components of e-Friction • Most have quite variable performance across the four components of e-Friction
Important to recognize that there is no “silver bullet” for capturing the Internet’s impact • Many levers need addressing simultaneously and in a coordinated manner

ICANN e-friction Refresh AIS Tunis 04Jun15.pptx 13
Cop
yrig
ht ©
201
5 by
The
Bos
ton
Con
sulti
ng G
roup
, Inc
. All
right
s re
serv
ed.
Multi-stakeholder approach necessary to reduce e-Friction
The starting point: the metrics!
ICANN e-friction Refresh AIS Tunis 04Jun15.pptx 14
Cop
yrig
ht ©
201
5 by
The
Bos
ton
Con
sulti
ng G
roup
, Inc
. All
right
s re
serv
ed.
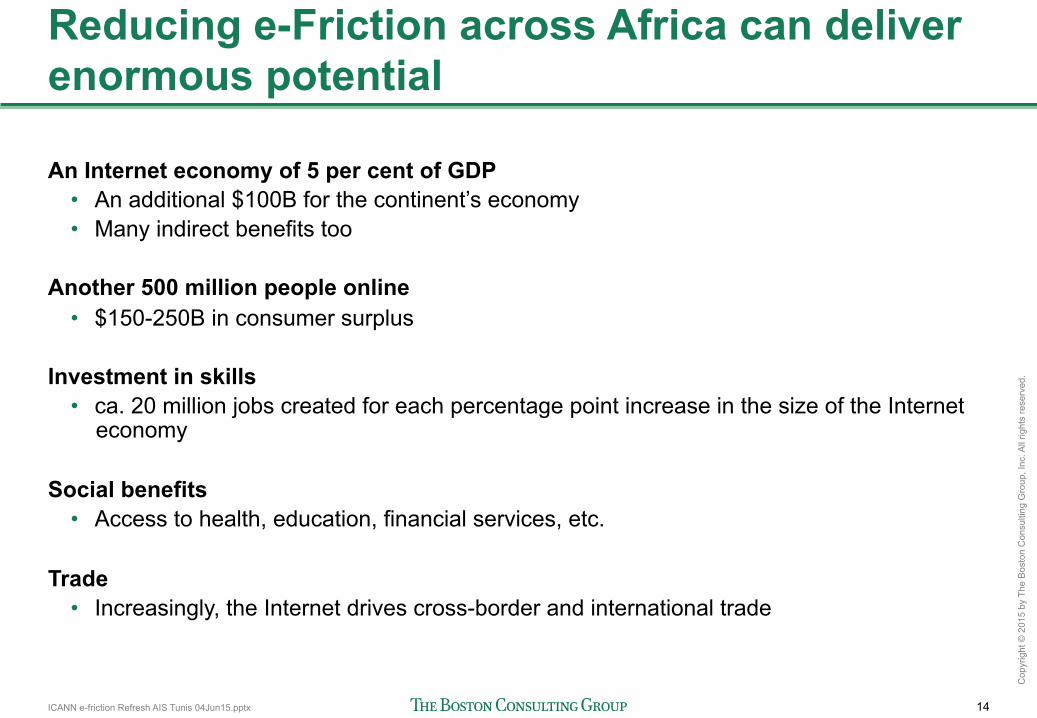
Reducing e-Friction across Africa can deliver enormous potential
An Internet economy of 5 per cent of GDP • An additional $100B for the continent’s economy • Many indirect benefits too
Another 500 million people online
• $150-250B in consumer surplus Investment in skills
• ca. 20 million jobs created for each percentage point increase in the size of the Internet economy
Social benefits
• Access to health, education, financial services, etc. Trade
• Increasingly, the Internet drives cross-border and international trade

ICANN e-friction Refresh AIS Tunis 04Jun15.pptx 15
Cop
yrig
ht ©
201
5 by
The
Bos
ton
Con
sulti
ng G
roup
, Inc
. All
right
s re
serv
ed.
“Which Wheels to Grease?” An Agenda for policy makers
§ Do not see "wealth as destiny": many levers exist to reduce e-Friction, whatever the level of GDP
§ Innovate in infrastructure deployment: affordable infrastructure for low population density areas requires new technologies, business models and policies
§ Drive for literacy: basic literacy, English-language skills and ICT skills all help reduce e-Friction
§ Encourage local relevance: local content in local languages drives usage, requiring encouragement of local ecosystems, including e-government services
§ Get companies online: SMEs that use the Internet intensively grow faster, employ more people than those that don’t, and trade more internationally
§ Encourage “joined-up” policy making: drive for multi-stakeholder involvement from across the ecosystem and learnings from relevant peers
1
2
3
4
5
6

Thank you
bcg.com | bcgperspectives.com