Embed Size (px)
Citation preview
RS and GIS Applications In Ground Water Prospectus Mappingng
BY:MANUMOHAN V.HSECOND SEMGEOINFORATICS KSRSAC
CONTENTS:
• Objective.
• Major factors controling ground water regime.
• Methodology
• Case study.
• Conclusion.
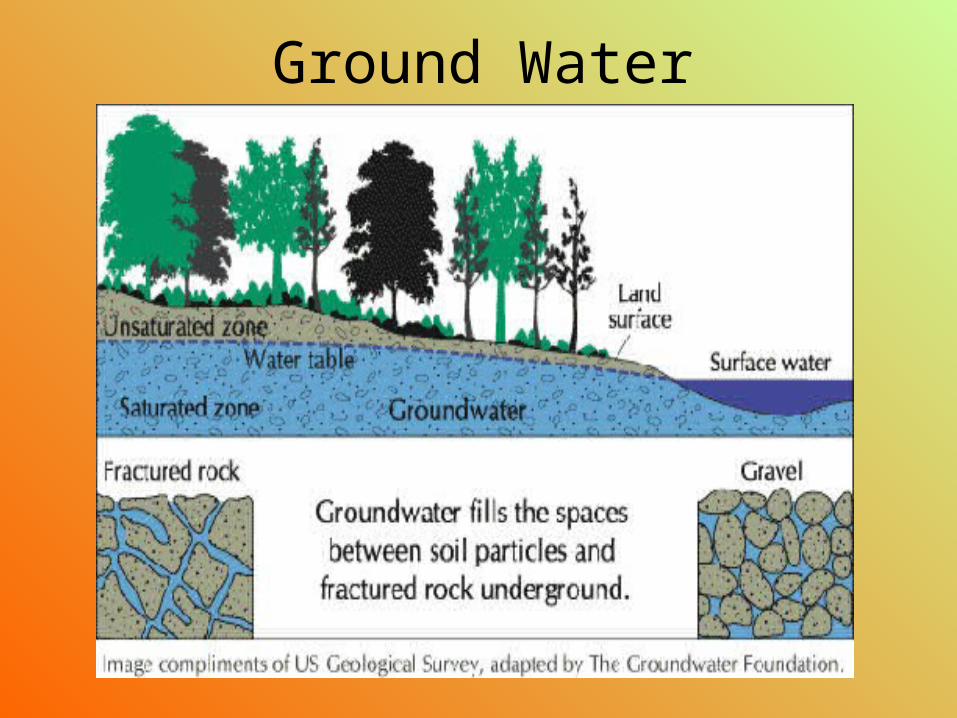
Ground Water
OBJECTIVE
•Preparing ground water prospectus mapping of study area
•Demarcation of zones having different groundwater potentiality is an important task in overall water resources development, planning and management.
• The groundwater exploration approach using i remote sensing, geological and GIS techniques.
MAJOR FACTORS CONTROLING GROUND WATER REGIME
• Geology / Lithology
• Geological structures
• Geomorphology / Landform
• Weather conditions
• Recharge Conditions
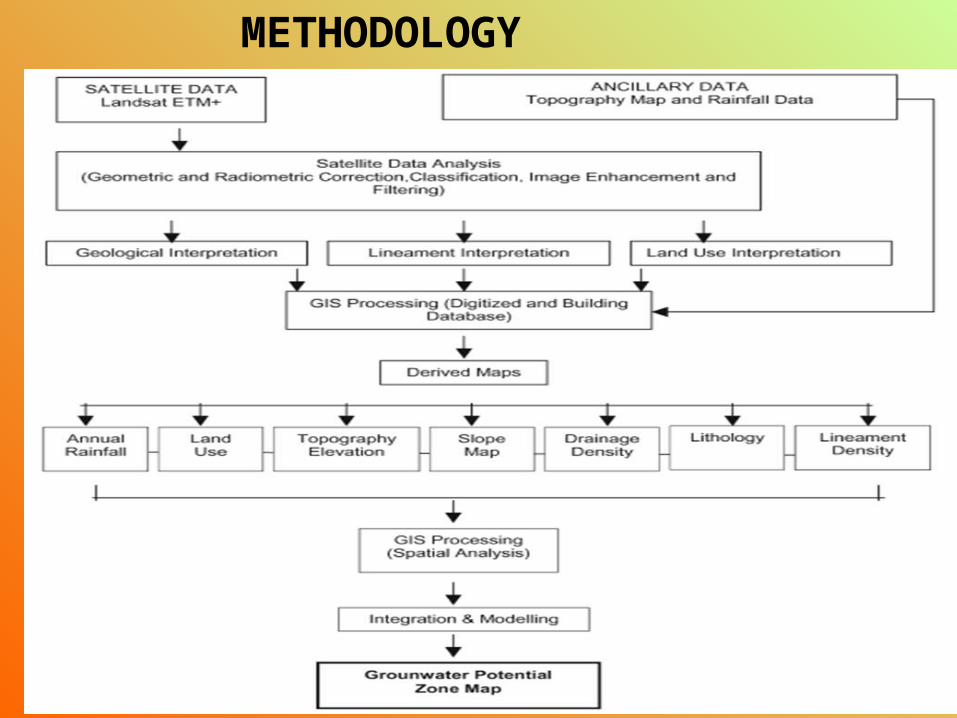
METHODOLOGY
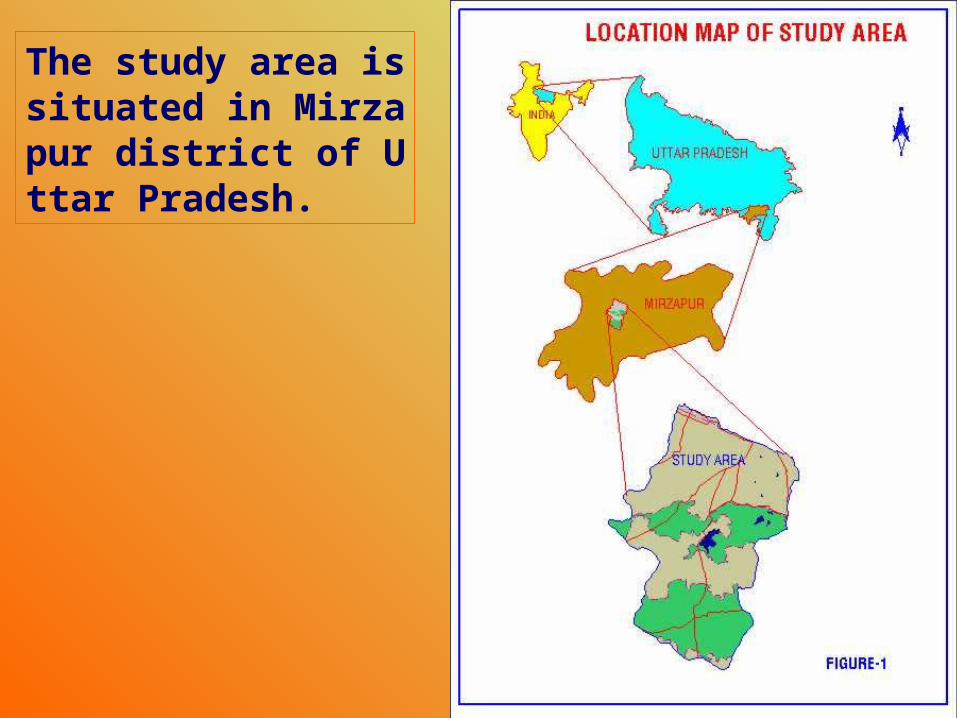
The study area is situated in Mirzapur district of Uttar Pradesh.
DATA USEDThe followings data were used for the study :
•Remotely sensed data, viz. IRS 1B LISS II, of scale 1:50,000
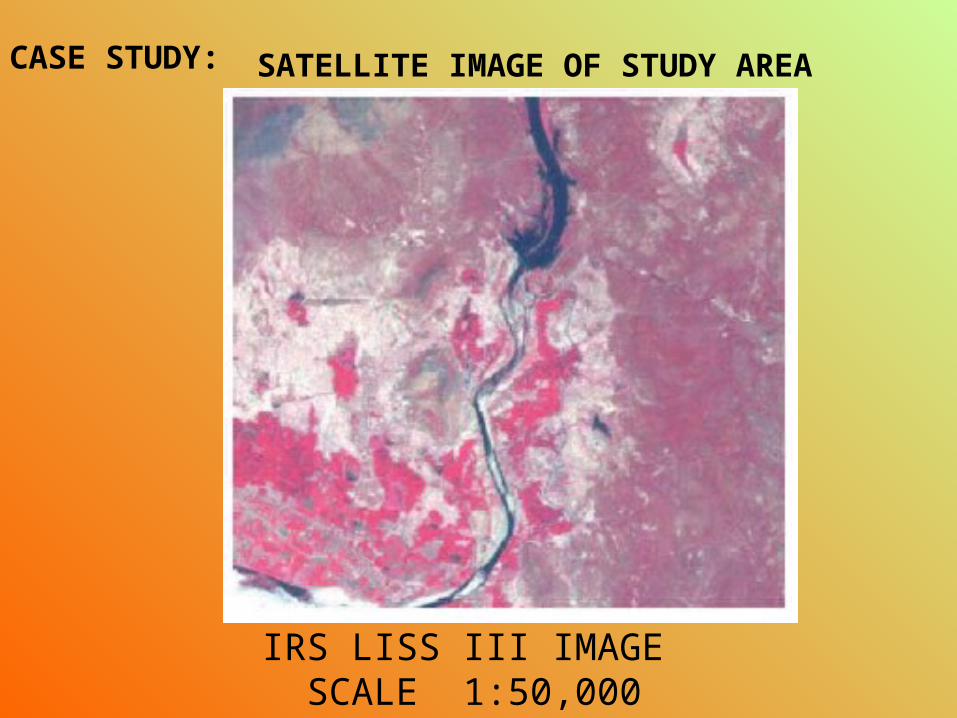
SATELLITE IMAGE OF STUDY AREA
IRS LISS III IMAGE SCALE 1:50,000
CASE STUDY:
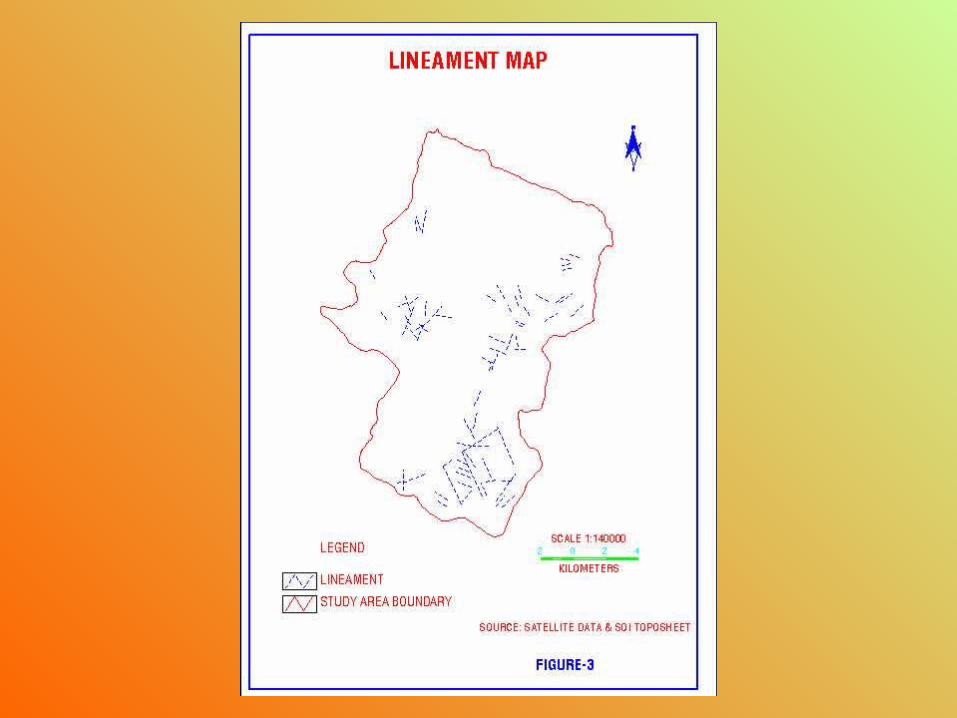
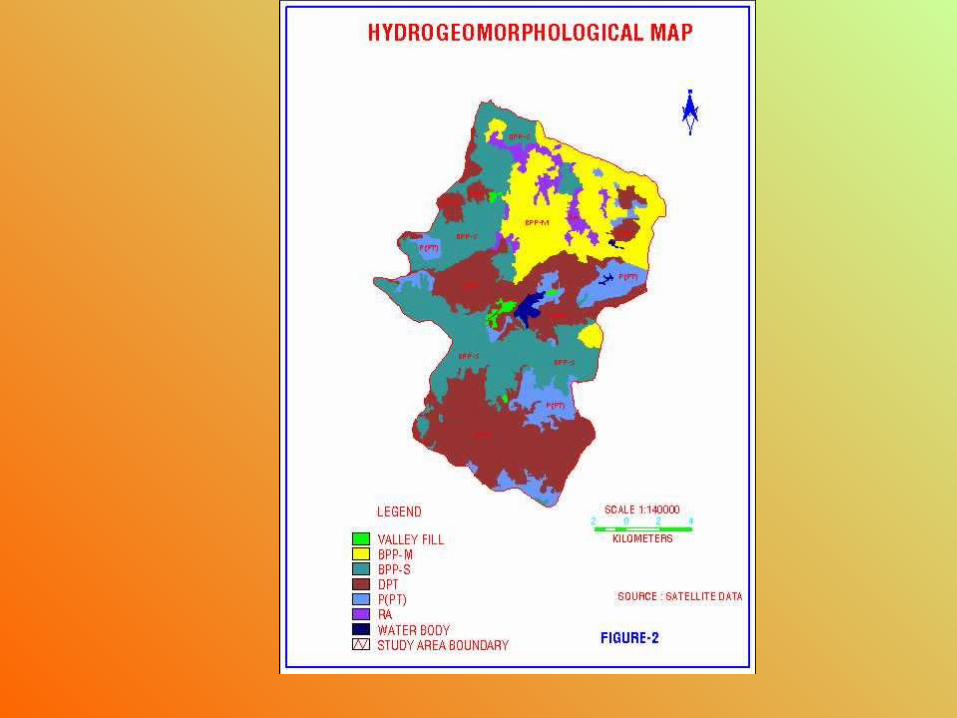
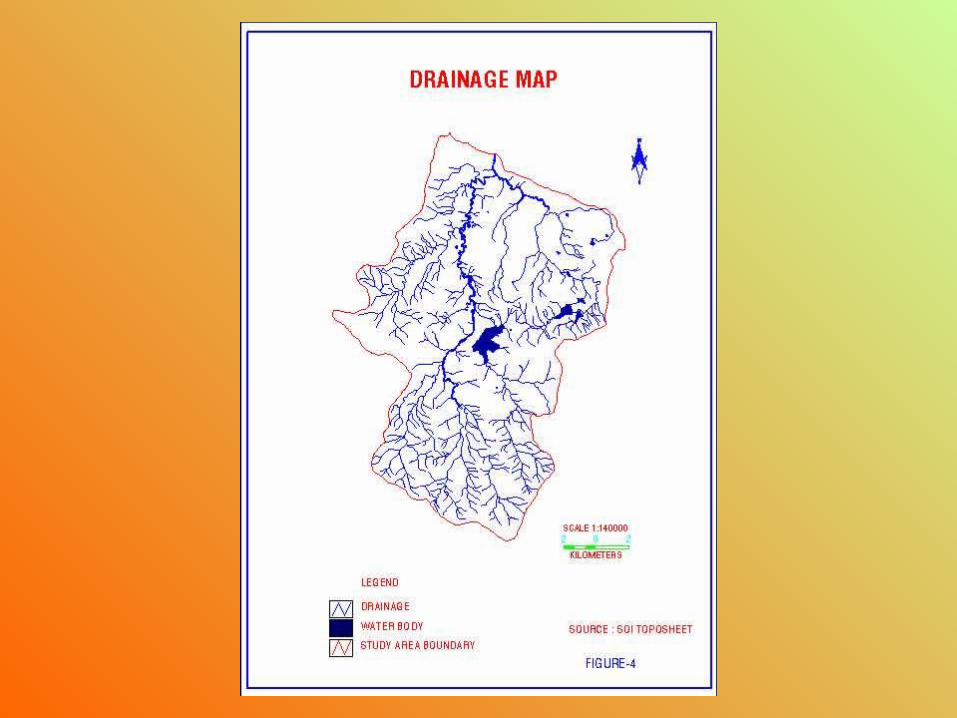
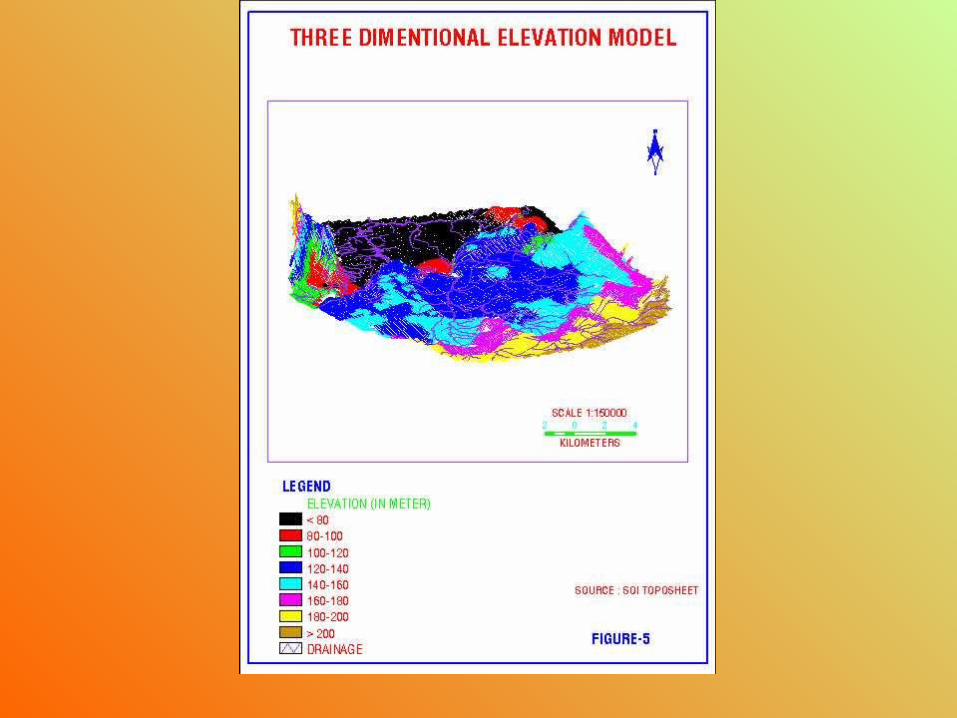
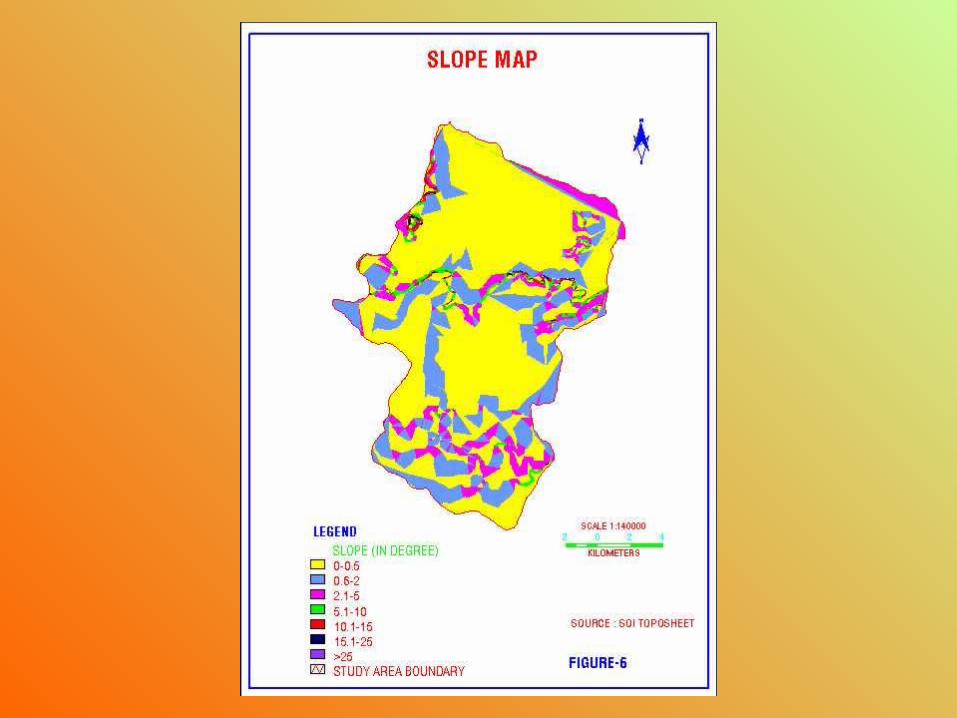
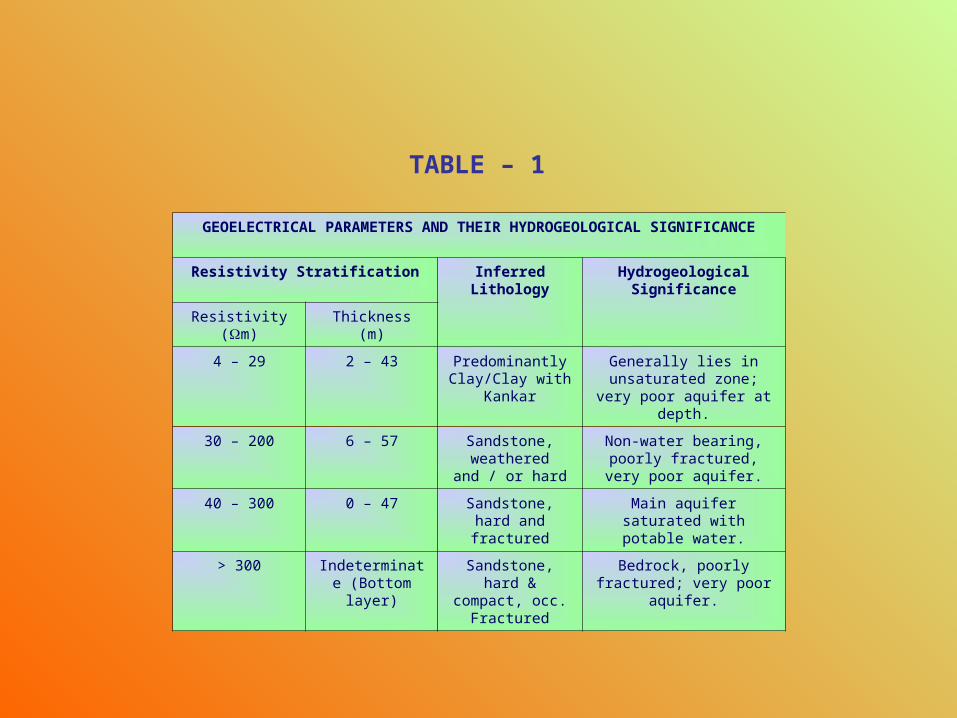
TABLE – 1
GEOELECTRICAL PARAMETERS AND THEIR HYDROGEOLOGICAL SIGNIFICANCE
Resistivity Stratification
Inferred Lithology
Hydrogeological Significance
Resistivity (m) Thickness (m)
4 – 29 2 – 43 Predominantly Clay/Clay with
Kankar
Generally lies in unsaturated zone; very poor aquifer at
depth.
30 – 200 6 – 57 Sandstone, weathered and / or
hard
Non-water bearing, poorly fractured, very poor aquifer.
40 – 300 0 – 47 Sandstone, hard and fractured
Main aquifer saturated with potable water.
> 300 Indeterminate (Bottom layer)
Sandstone, hard & compact, occ.
Fractured
Bedrock, poorly fractured; very poor aquifer.
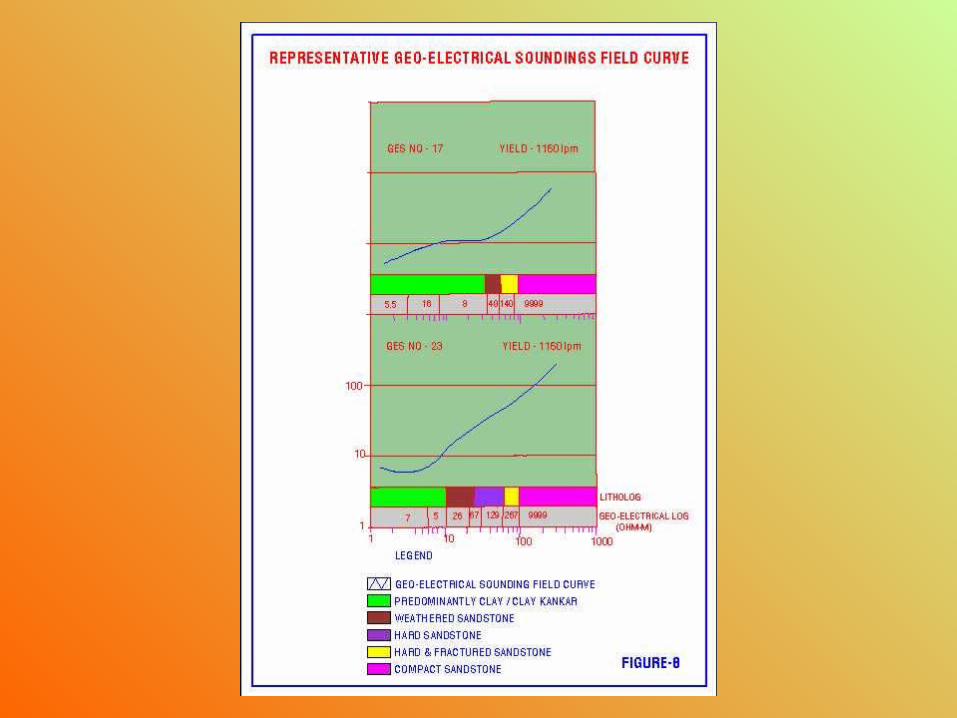
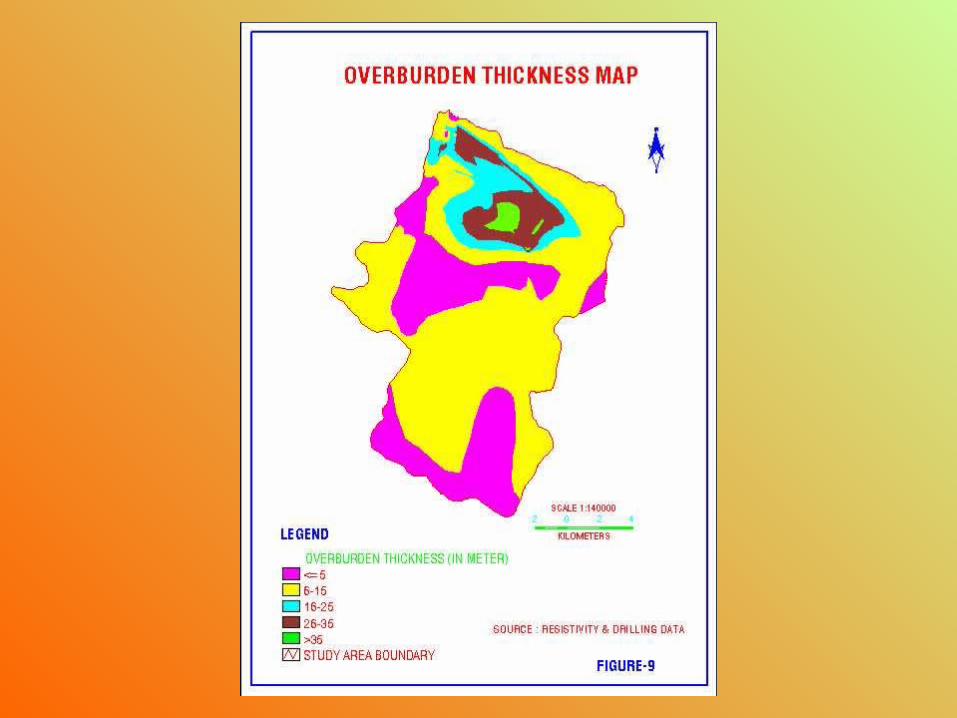
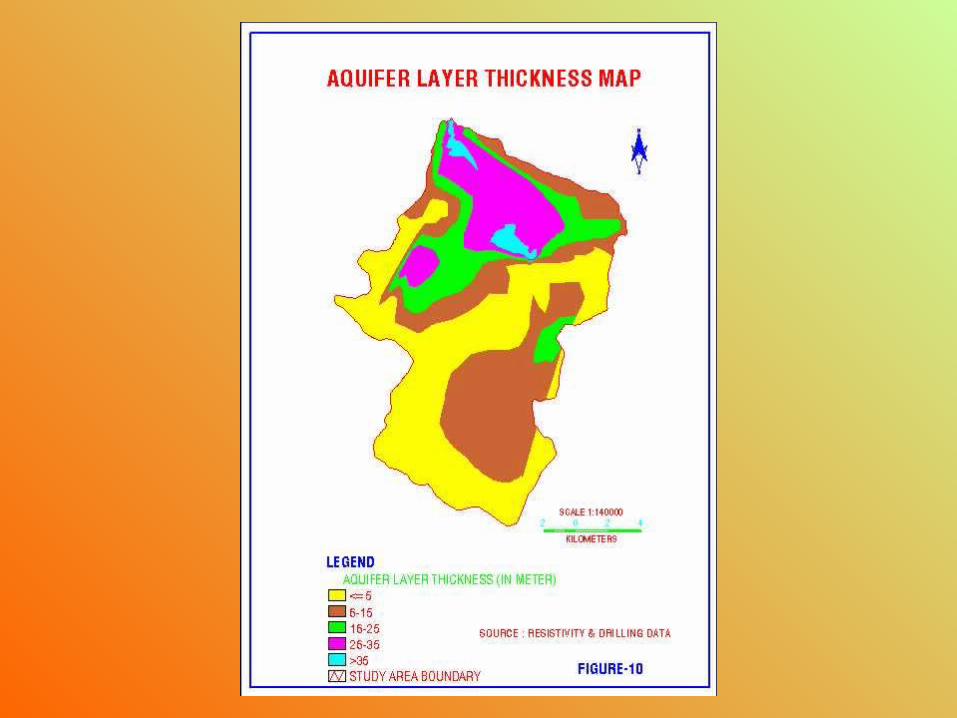
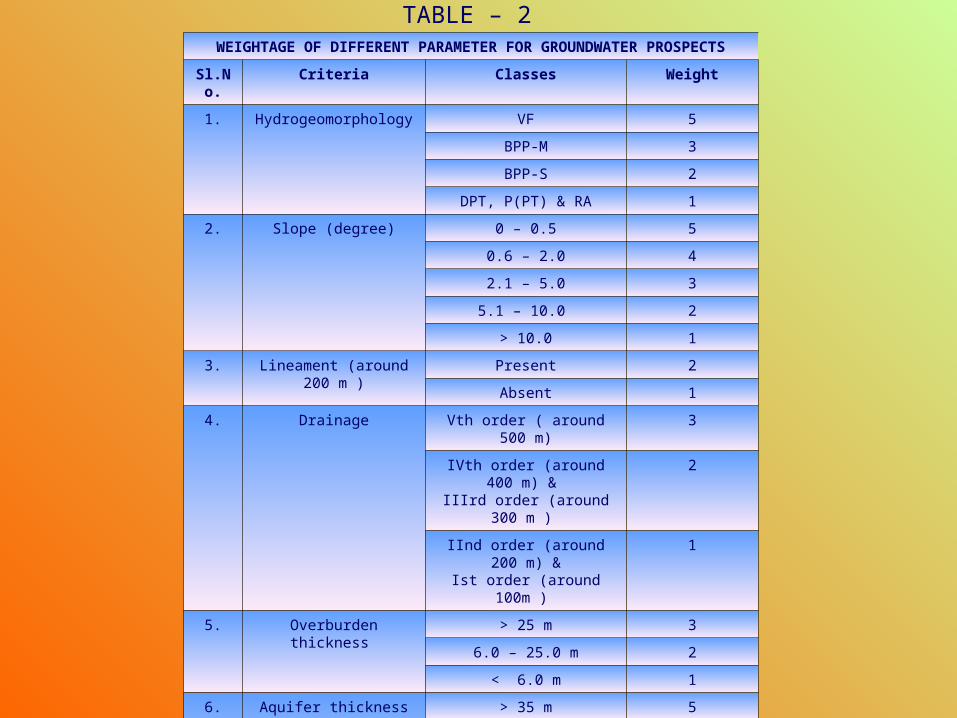
TABLE – 2WEIGHTAGE OF DIFFERENT PARAMETER FOR GROUNDWATER PROSPECTS
Sl.No. Criteria Classes Weight
1. Hydrogeomorphology VF 5
BPP-M 3
BPP-S 2
DPT, P(PT) & RA 1
2. Slope (degree) 0 – 0.5 5
0.6 – 2.0 4
2.1 – 5.0 3
5.1 – 10.0 2
> 10.0 1
3. Lineament (around 200 m ) Present 2
Absent 1
4. Drainage Vth order ( around 500 m) 3
IVth order (around 400 m) & IIIrd order (around 300 m )
2
IInd order (around 200 m) &Ist order (around 100m )
1
5. Overburden thickness > 25 m 3
6.0 – 25.0 m 2
< 6.0 m 1
6. Aquifer thickness > 35 m 5
26.0 - 35.0 m 4
16.0 – 25.0 m 3
6.0 – 15.0 m 2
< 6.0 m 1
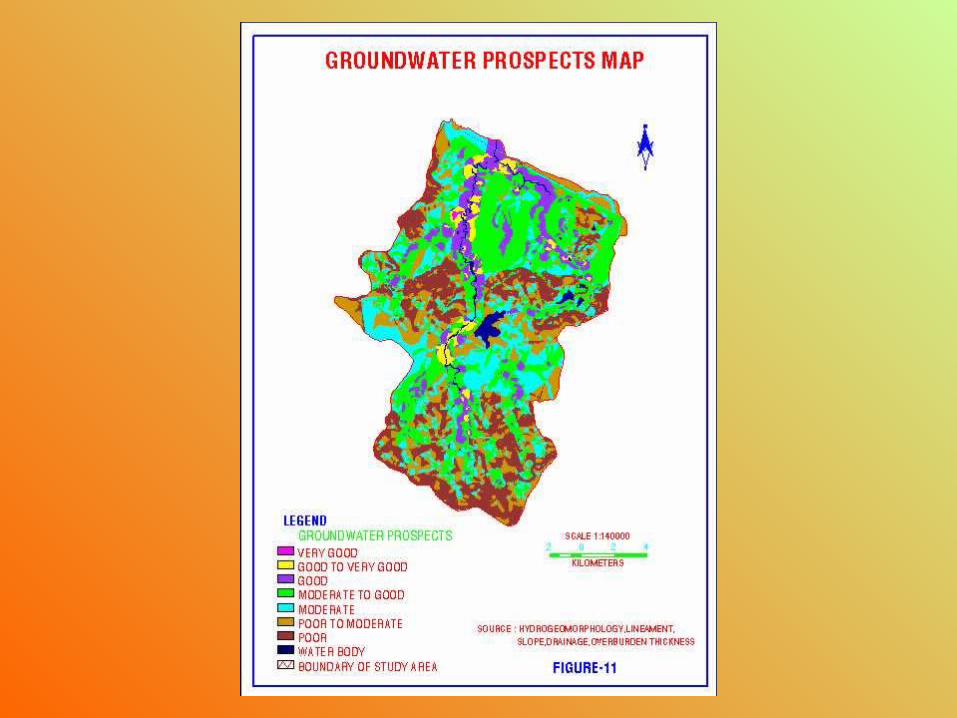
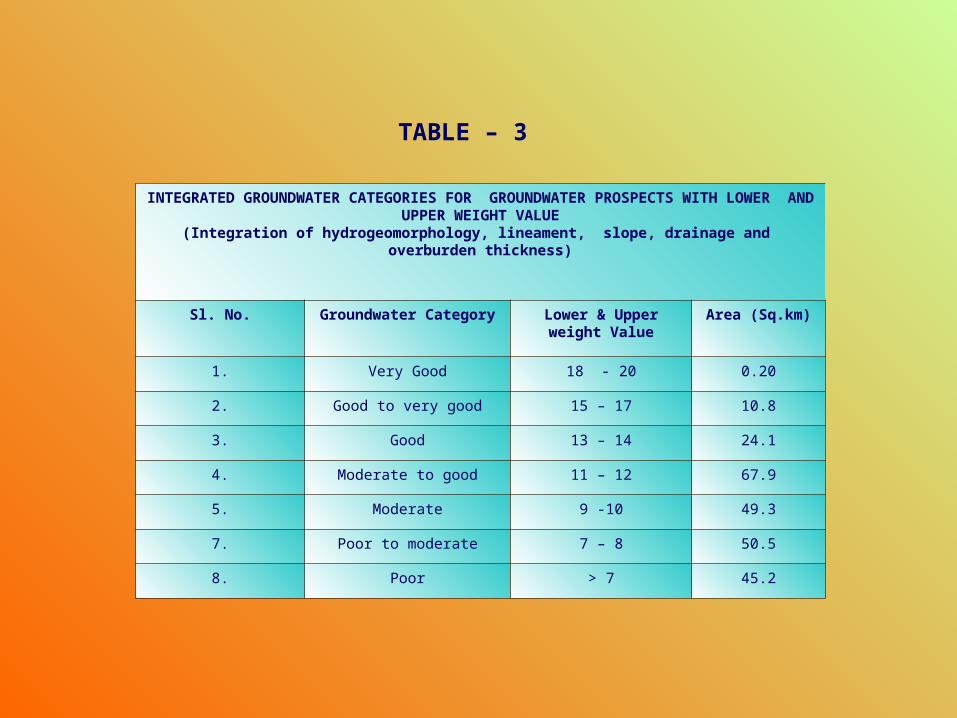
TABLE – 3
INTEGRATED GROUNDWATER CATEGORIES FOR GROUNDWATER PROSPECTS WITH LOWER AND UPPER WEIGHT VALUE
(Integration of hydrogeomorphology, lineament, slope, drainage and overburden thickness)
Sl. No. Groundwater Category Lower & Upper weight Value
Area (Sq.km)
1. Very Good 18 - 20 0.20
2. Good to very good 15 – 17 10.8
3. Good 13 – 14 24.1
4. Moderate to good 11 – 12 67.9
5. Moderate 9 -10 49.3
7. Poor to moderate 7 – 8 50.5
8. Poor > 7 45.2
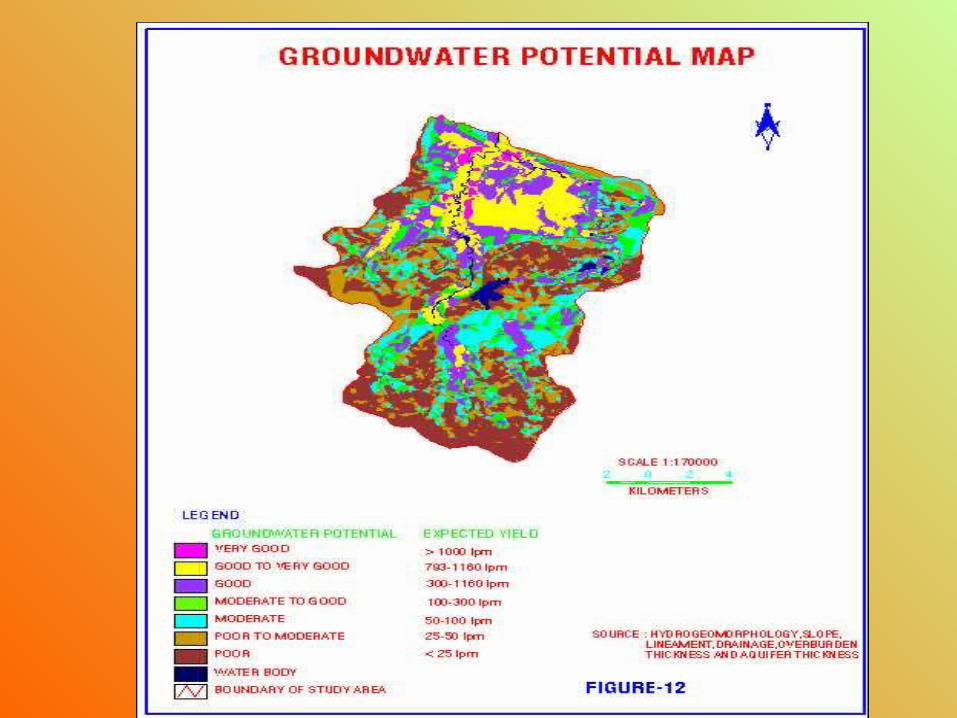
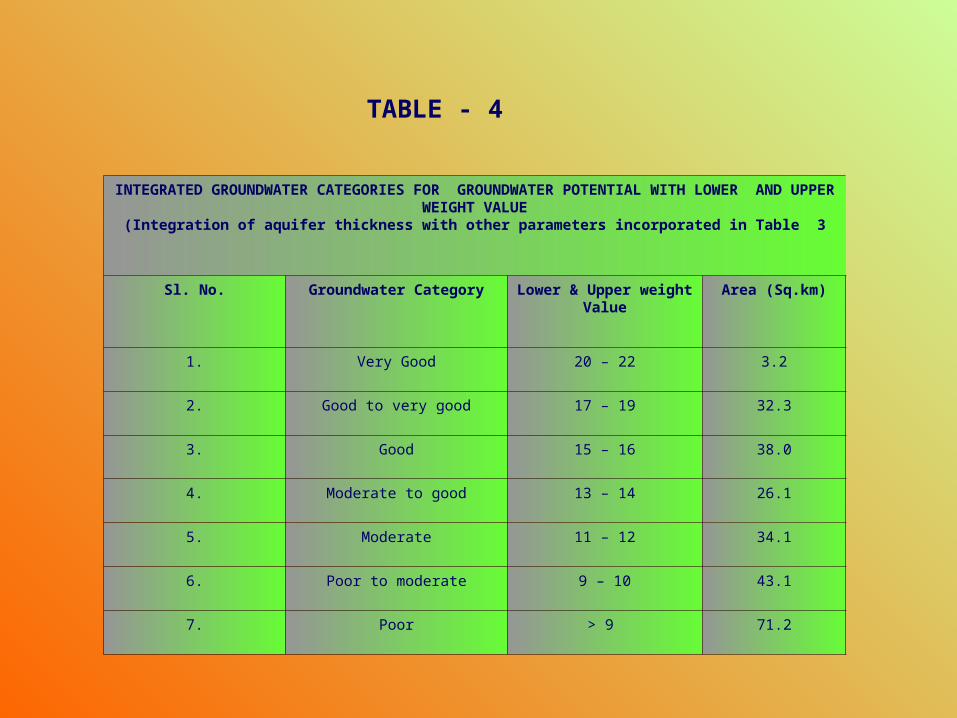
TABLE - 4
INTEGRATED GROUNDWATER CATEGORIES FOR GROUNDWATER POTENTIAL WITH LOWER AND UPPER WEIGHT VALUE
(Integration of aquifer thickness with other parameters incorporated in Table 3
Sl. No. Groundwater Category Lower & Upper weight Value
Area (Sq.km)
1. Very Good 20 – 22 3.2
2. Good to very good 17 – 19 32.3
3. Good 15 – 16 38.0
4. Moderate to good 13 – 14 26.1
5. Moderate 11 – 12 34.1
6. Poor to moderate 9 – 10 43.1
7. Poor > 9 71.2
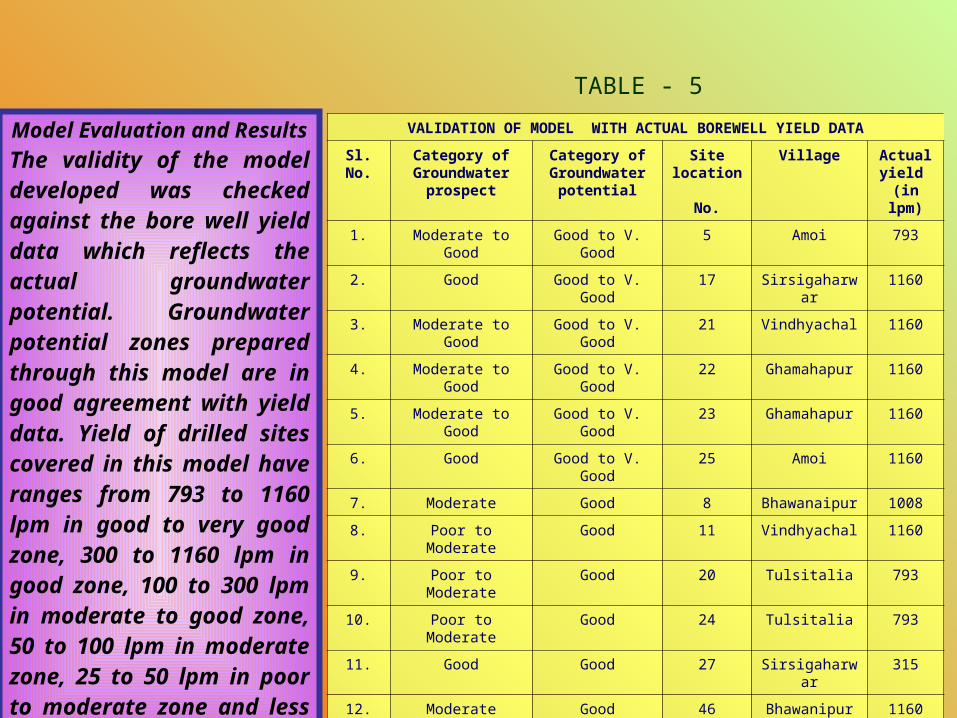
TABLE - 5
VALIDATION OF MODEL WITH ACTUAL BOREWELL YIELD DATA
Sl. No. Category of Groundwater
prospect
Category of Groundwater
potential
Site location
No.
Village Actual yield
(in lpm)
1. Moderate to Good Good to V. Good 5 Amoi 793
2. Good Good to V. Good 17 Sirsigaharwar 1160
3. Moderate to Good Good to V. Good 21 Vindhyachal 1160
4. Moderate to Good Good to V. Good 22 Ghamahapur 1160
5. Moderate to Good Good to V. Good 23 Ghamahapur 1160
6. Good Good to V. Good 25 Amoi 1160
7. Moderate Good 8 Bhawanaipur 1008
8. Poor to Moderate Good 11 Vindhyachal 1160
9. Poor to Moderate Good 20 Tulsitalia 793
10. Poor to Moderate Good 24 Tulsitalia 793
11. Good Good 27 Sirsigaharwar 315
12. Moderate Good 46 Bhawanipur 1160
13. Moderate to Good Good 58 Sirsigaharwar 505
14. Moderate to Good Moderate to Good 38 Hinauti 100
15. Moderate to Good Moderate to Good 40 Hinauti Sarupur 130
16. Poor to Moderate Moderate 34 Sirsigaharwar 80
17. Moderate Poor to Moderate 28 Sirsigaharwar 25
18. Poor Poor 47 Amrawati 24
Model Evaluation and Results
The validity of the model developed was checked against the bore well yield data which reflects the actual groundwater potential. Groundwater potential zones prepared through this model are in good agreement with yield data. Yield of drilled sites covered in this model have ranges from 793 to 1160 lpm in good to very good zone, 300 to 1160 lpm in good zone, 100 to 300 lpm in moderate to good zone, 50 to 100 lpm in moderate zone, 25 to 50 lpm in poor to moderate zone and less than 25 lpm in poor zone.
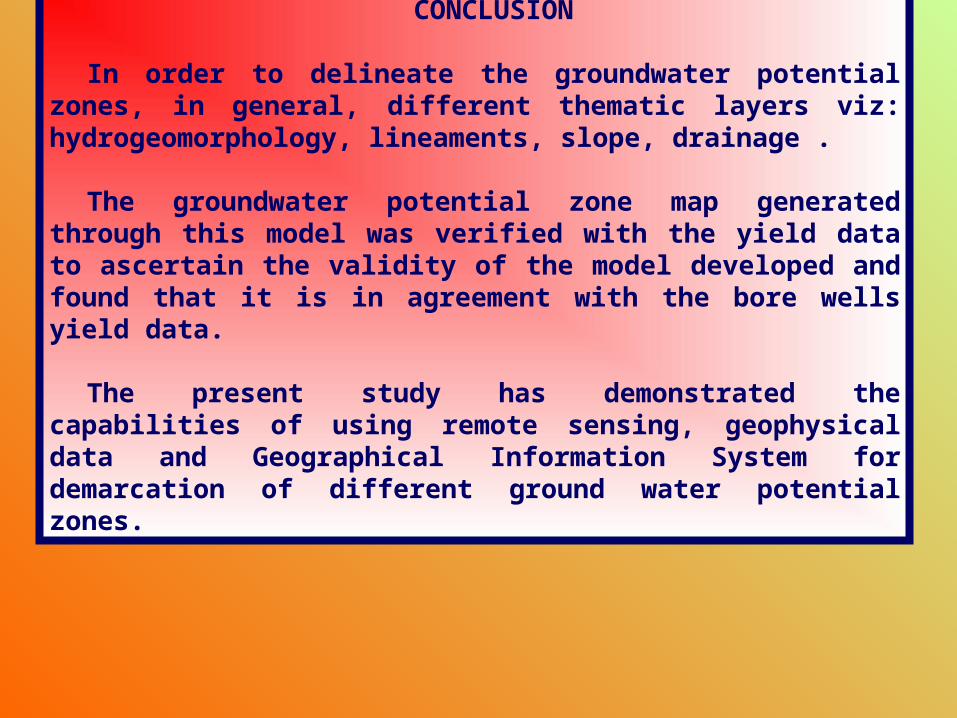
CONCLUSION
In order to delineate the groundwater potential zones, in general, different thematic layers viz: hydrogeomorphology, lineaments, slope, drainage .
The groundwater potential zone map generated through this model was verified with the yield data to ascertain the validity of the model developed and found that it is in agreement with the bore wells yield data.
The present study has demonstrated the capabilities of using remote sensing, geophysical data and Geographical Information System for demarcation of different ground water potential zones.


![GENRAL WIRING (GENRAL WIRING-1) · sdcd vdd(3r3v) sddat0 sd board gnd gnd gnd 3r3v 3r3v gnd maindak maindbk 5v [main dial] pbabk gnd pbbbk pclek pbbak rfl 3r3v 3r3v gnd gnd afl phoe](https://img.pdfslide.us/doc/110x75/5c000ba809d3f2c9268ca1e5/genral-wiring-genral-wiring-1-sdcd-vdd3r3v-sddat0-sd-board-gnd-gnd-gnd-3r3v.jpg)
![F3JR MB R20 1211[31731]ncandelier.free.fr/asus/ASUS_F3JR_R20.pdfH_D#50 H_TMS H_TDO H_TCK H_TRST# H_PREQ# +VCCP +VCCP +VCCP +VCCP GND GND GND GND GND GND GND TPC26T 1 T1 R8 1 2 56Ohm](https://img.pdfslide.us/doc/110x75/5faf0ab01979a324157ec2b6/f3jr-mb-r20-121131731-hd50-htms-htdo-htck-htrst-hpreq-vccp-vccp-vccp.jpg)