Embed Size (px)
Citation preview
© 2012 Cisco and/or its affiliates. All rights reserved. This document is Cisco Public. Page 1 of 1
White Paper
Cisco Global Cloud Index: Forecast and Methodology, 2011–2016
What You Will Learn
The Cisco® Global Cloud Index is an ongoing effort to forecast the growth of global data center and cloud-based
IP traffic. The forecast includes trends associated with data center virtualization and cloud computing. This
document presents the details of the study and the methodology behind it.
Forecast Overview
Global data center traffic:
● Annual global data center IP traffic will reach 6.6 zettabytes by the end of 2016. By 2016, global data
center IP traffic will reach 554 exabytes per month (up from 146 exabytes per month in 2011).
● Global data center IP traffic will nearly quadruple over the next 5 years. Overall, data center IP traffic will
grow at a compound annual growth rate (CAGR) of 31 percent from 2011 to 2016.
Data center virtualization and cloud computing transition:
● The number of workloads per installed traditional server will increase from 1.5 in 2011 to 2.0 by 2016.
● The number of workloads per installed cloud server will increase from 4.2 in 2011 to 8.5 by 2016.
● By 2016, nearly two-thirds of all workloads will be processed in the cloud.
Global cloud traffic:
● Annual global cloud IP traffic will reach 4.3 zettabytes by the end of 2016. By 2016, global cloud IP traffic
will reach 355 exabytes per month (up from 57 exabytes per month in 2011).
● Global cloud IP traffic will increase six-fold over the next 5 years. Overall, cloud IP traffic will grow at
a CAGR of 44 percent from 2011 to 2016.
● Global cloud IP traffic will account for nearly two-thirds of total data center traffic by 2016.
© 2012 Cisco and/or its affiliates. All rights reserved. This document is Cisco Public. Page 2 of 28
Regional cloud readiness:
● North America and Western Europe led in broadband access (fixed and mobile) in 2011 and will continue
to lead in this category through 2016. However, all regions will show measurable improvement in
broadband access to their respective populations throughout the forecast period. Asia Pacific leads in
the number of subscribers throughout the forecast period due to the region’s large population (see
Broadband Ubiquity section for details).
● Western Europe leads all regions with an average fixed download speed of 11.7 Mbps. North America
follows with an average fixed download speed of 10.3 Mbps. Asia Pacific and Central and Eastern Europe
lead all regions in average fixed upload speeds of 6.7 Mbps and 5.9 Mbps, respectively (see Download and
Upload Speed Overview section for details).
● Western Europe and Central and Eastern Europe lead all regions in average fixed network latency with
58 ms and 59 ms, respectively (see Network Latency section for details).
Evolution of Data Center Traffic
In just the past year since the first Cisco Global Cloud Index was released, the industry has seen cloud adoption
evolving from an emerging technology to an established networking solution that is gaining widespread
acceptance and deployment. Enterprise and government organizations are moving from test environments to
placing more of their mission-critical workloads in the cloud. And for consumers, cloud services offer ubiquitous
access to content and services, on multiple devices, almost anywhere network users are located.
Qualitatively, the main drivers for cloud adoption include faster delivery of services and data, increased application
performance, as well as improved operational efficiencies. While security and integration with existing IT
environments continue to represent concerns for some potential cloud-based applications, a growing range of
consumer and business cloud services are currently available. Today’s cloud services address varying customer
requirements (for example, privacy, mobility, and multiple device access) and support near-term opportunities
as well as long-term strategic priorities for network operators, both public and private.
Quantitatively, the impact of cloud computing on data center traffic is clear. It is important to recognize that most
Internet traffic has originated or terminated in a data center since 2008. Data center traffic will continue to
dominate Internet traffic for the foreseeable future, but the nature of data center traffic is undergoing a
fundamental transformation brought about by cloud applications, services, and infrastructure. The importance and
relevance of the global cloud evolution is highlighted by one of the top-line projections from this updated
forecast—by 2016 nearly two-thirds of data center traffic will be cloud traffic.
The following sections summarize not only the volume and growth of traffic entering and exiting the data center,
but also the traffic carried between different functional units within the data center.
© 2012 Cisco and/or its affiliates. All rights reserved. This document is Cisco Public. Page 3 of 28
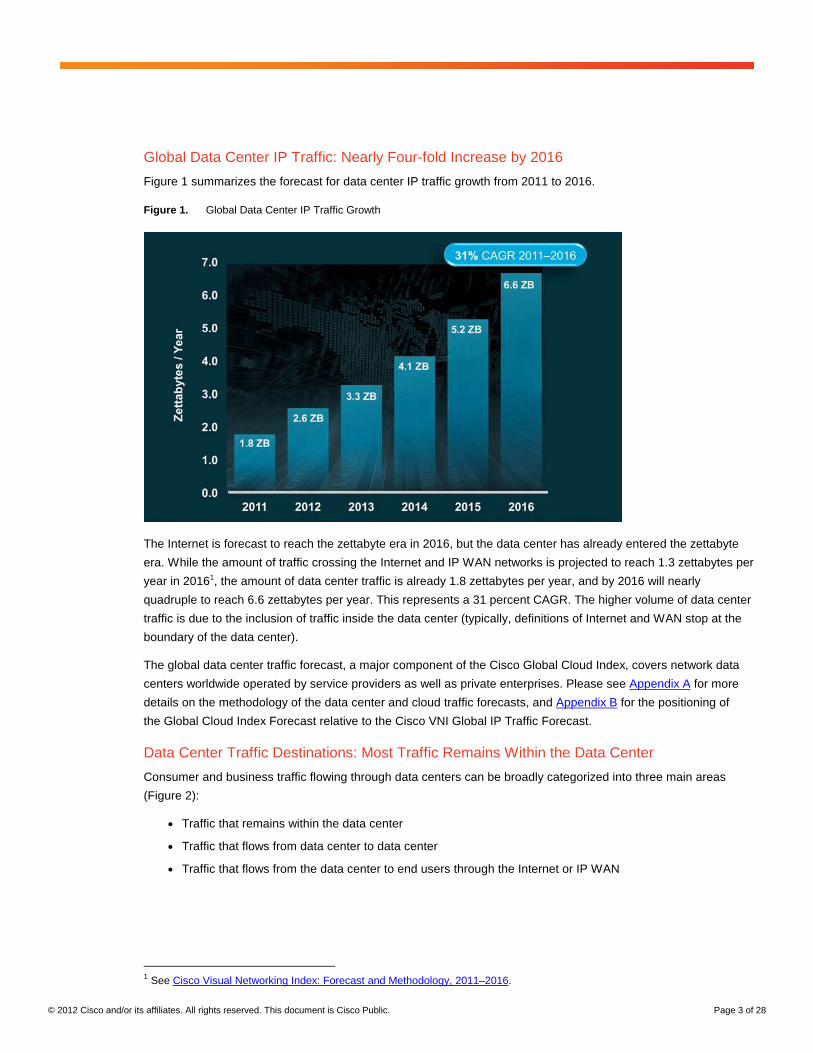
Global Data Center IP Traffic: Nearly Four-fold Increase by 2016
Figure 1 summarizes the forecast for data center IP traffic growth from 2011 to 2016.
Figure 1. Global Data Center IP Traffic Growth
The Internet is forecast to reach the zettabyte era in 2016, but the data center has already entered the zettabyte
era. While the amount of traffic crossing the Internet and IP WAN networks is projected to reach 1.3 zettabytes per
year in 20161, the amount of data center traffic is already 1.8 zettabytes per year, and by 2016 will nearly
quadruple to reach 6.6 zettabytes per year. This represents a 31 percent CAGR. The higher volume of data center
traffic is due to the inclusion of traffic inside the data center (typically, definitions of Internet and WAN stop at the
boundary of the data center).
The global data center traffic forecast, a major component of the Cisco Global Cloud Index, covers network data
centers worldwide operated by service providers as well as private enterprises. Please see Appendix A for more
details on the methodology of the data center and cloud traffic forecasts, and Appendix B for the positioning of
the Global Cloud Index Forecast relative to the Cisco VNI Global IP Traffic Forecast.
Data Center Traffic Destinations: Most Traffic Remains Within the Data Center
Consumer and business traffic flowing through data centers can be broadly categorized into three main areas
(Figure 2):
● Traffic that remains within the data center
● Traffic that flows from data center to data center
● Traffic that flows from the data center to end users through the Internet or IP WAN
1 See Cisco Visual Networking Index: Forecast and Methodology, 2011–2016.
© 2012 Cisco and/or its affiliates. All rights reserved. This document is Cisco Public. Page 4 of 28
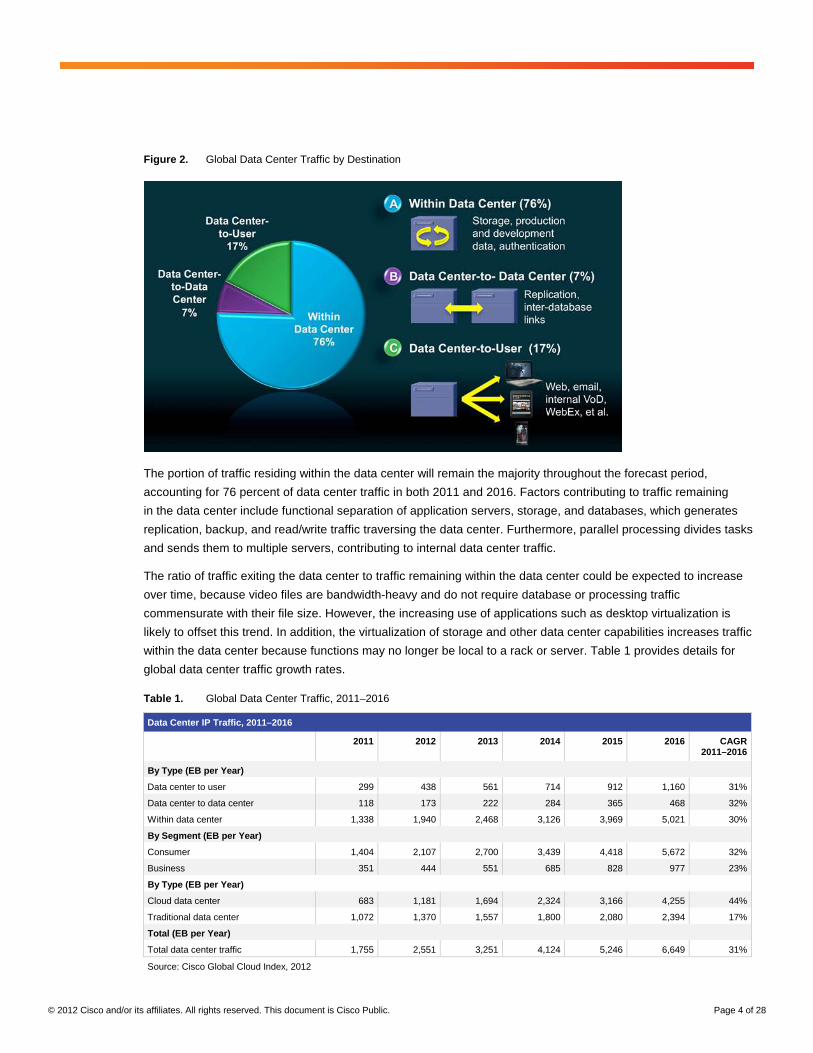
Figure 2. Global Data Center Traffic by Destination
The portion of traffic residing within the data center will remain the majority throughout the forecast period,
accounting for 76 percent of data center traffic in both 2011 and 2016. Factors contributing to traffic remaining
in the data center include functional separation of application servers, storage, and databases, which generates
replication, backup, and read/write traffic traversing the data center. Furthermore, parallel processing divides tasks
and sends them to multiple servers, contributing to internal data center traffic.
The ratio of traffic exiting the data center to traffic remaining within the data center could be expected to increase
over time, because video files are bandwidth-heavy and do not require database or processing traffic
commensurate with their file size. However, the increasing use of applications such as desktop virtualization is
likely to offset this trend. In addition, the virtualization of storage and other data center capabilities increases traffic
within the data center because functions may no longer be local to a rack or server. Table 1 provides details for
global data center traffic growth rates.
Table 1. Global Data Center Traffic, 2011–2016
Data Center IP Traffic, 2011–2016
2011 2012 2013 2014 2015 2016 CAGR 2011–2016
By Type (EB per Year)
Data center to user 299 438 561 714 912 1,160 31%
Data center to data center 118 173 222 284 365 468 32%
Within data center 1,338 1,940 2,468 3,126 3,969 5,021 30%
By Segment (EB per Year)
Consumer 1,404 2,107 2,700 3,439 4,418 5,672 32%
Business 351 444 551 685 828 977 23%
By Type (EB per Year)
Cloud data center 683 1,181 1,694 2,324 3,166 4,255 44%
Traditional data center 1,072 1,370 1,557 1,800 2,080 2,394 17%
Total (EB per Year)
Total data center traffic 1,755 2,551 3,251 4,124 5,246 6,649 31%
Source: Cisco Global Cloud Index, 2012
© 2012 Cisco and/or its affiliates. All rights reserved. This document is Cisco Public. Page 5 of 28
Definitions:
● Data center to user : Traffic that flows from the data center to end users through the Internet or IP WAN
● Data center to data center : Traffic that flows from data center to data center
● Within data center : Traffic that remains within the data center
● Consumer : Traffic originating with or destined for consumer end users
● Business : Traffic originating with or destined for business end users
● Cloud data center : Traffic associated with cloud consumer and business applications
● Traditional data center : Traffic associated with noncloud consumer and business applications
Data Center Workloads: Nearly Two-Thirds Will Be Cloud-Based by 2016
A workload can be defined as the amount of processing a server undertakes to run an application and support a
number of users interacting with the application. The Cisco Global Cloud Index forecasts the continued transition
of workloads from traditional data centers to cloud data centers. By 2016, nearly two-thirds of all workloads will
be processed in cloud data centers (Figure 3). For regional distributions of workloads, see Appendix E.
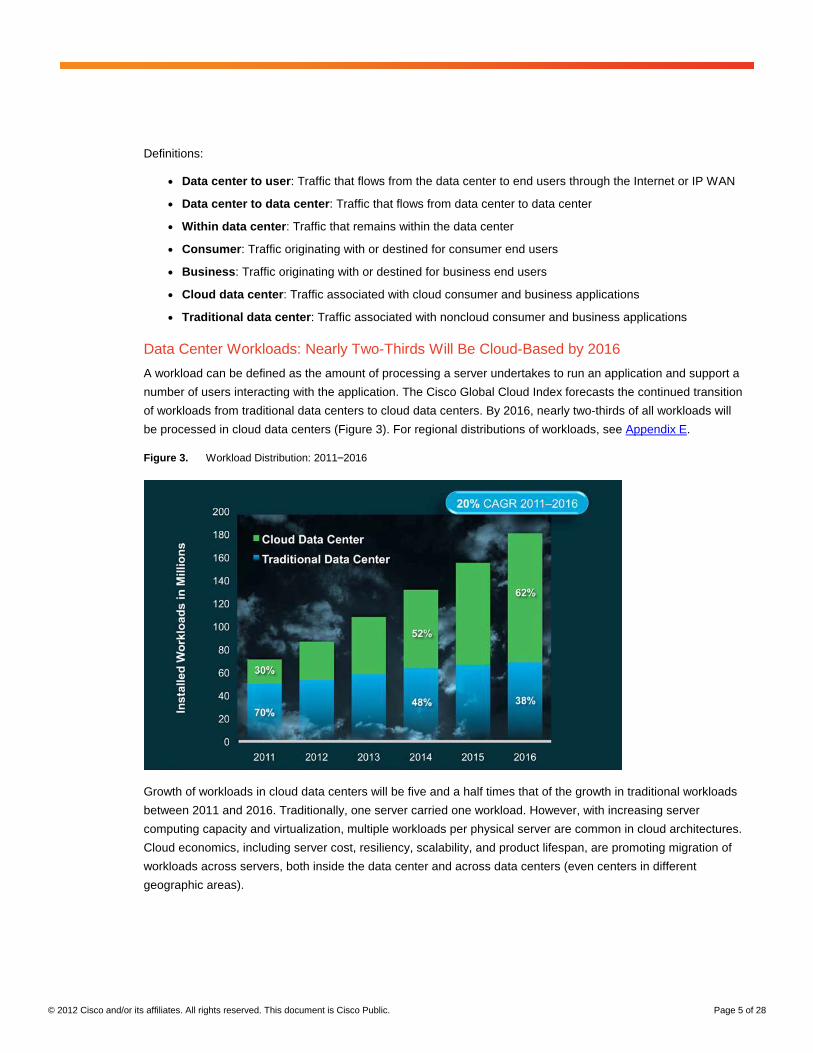
Figure 3. Workload Distribution: 2011–2016
Growth of workloads in cloud data centers will be five and a half times that of the growth in traditional workloads
between 2011 and 2016. Traditionally, one server carried one workload. However, with increasing server
computing capacity and virtualization, multiple workloads per physical server are common in cloud architectures.
Cloud economics, including server cost, resiliency, scalability, and product lifespan, are promoting migration of
workloads across servers, both inside the data center and across data centers (even centers in different
geographic areas).
© 2012 Cisco and/or its affiliates. All rights reserved. This document is Cisco Public. Page 6 of 28
Often an end-user application can be supported by several workloads distributed across servers. This can
generate multiple streams of traffic within and between data centers, in addition to traffic to and from the end user.
The average workload per cloud server will grow from a little over four in 2011 to eight and a half by 2016. In
comparison, the average workload per traditional data center server will grow from one and a half in 2011 to
two in 2016. Table 2 provides details on workloads shifting from traditional data centers to cloud data centers.
Table 2. Workload Shift from Traditional Data Center to Cloud Data Center
Global Data Center Workloads in Millions
2011 2012 2013 2014 2015 2016 CAGR 2011–2016
Traditional data center workloads 49.8 53.1 58.3 63.7 66.7 68.5 7%
Cloud data center workloads 21.3 33.5 49.7 67.9 88.4 112.1 39%
Total data center workloads 71.1 86.6 108.0 131.6 155.1 180.6 20%
Cloud workloads as a percentage of total data center workloads
30% 39% 46% 52% 57% 62% NA
Traditional workloads as a percentage of total data center workloads
70% 61% 54% 48% 43% 38% NA
Source: Cisco Global Cloud Index, 2012
Global Data Center and Cloud IP Traffic Growth
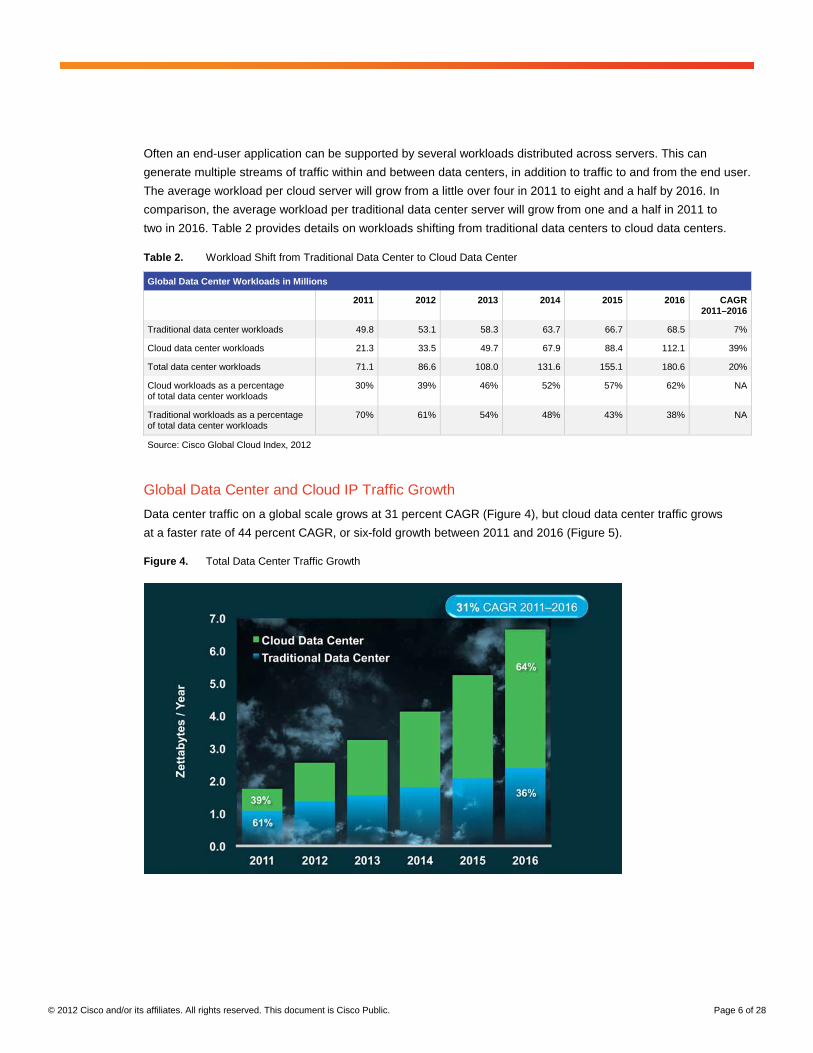
Data center traffic on a global scale grows at 31 percent CAGR (Figure 4), but cloud data center traffic grows
at a faster rate of 44 percent CAGR, or six-fold growth between 2011 and 2016 (Figure 5).
Figure 4. Total Data Center Traffic Growth

© 2012 Cisco and/or its affiliates. All rights reserved. This document is Cisco Public. Page 7 of 28
Figure 5. Cloud Data Center Traffic Growth
Cloud traffic will cross the zettabyte threshold in 2012, and by 2016, nearly two-thirds of all data center traffic will
be based in the cloud. It is important to note that the methodology for the estimation of cloud data center traffic
has changed since the initial release of the Cisco Global Cloud Index in 2011. The previous methodology
positioned all storage traffic in the noncloud traffic category. The updated methodology now distinguishes storage
traffic associated with cloud workloads and positions it within the cloud traffic category.
For example, storage traffic associated with cloud application development would be counted as cloud traffic in the
updated methodology, but would have been excluded in the previous methodology. Because storage accounts for
approximately 40 percent of data center traffic, the change in methodology substantially raises the overall cloud
percentage of data center traffic. Using the updated methodology, cloud traffic will represent 64 percent of total
data center traffic by 2016. Using the previous methodology, cloud traffic would have represented only 36 percent
of total data center traffic by 2016.
Significant promoters of cloud traffic growth are the rapid adoption of and migration to cloud architectures,
along with the ability of cloud data centers to handle significantly higher traffic loads. Cloud data centers support
increased virtualization, standardization, and automation. These factors lead to increased performance, as well as
higher capacity and throughput.
Global Business and Consumer Cloud Growth
For the purposes of this study, the Cisco Global Cloud Index characterizes traffic based on services delivered to
the end user. Business data centers are typically dedicated to organizational needs and handle traffic for business
needs that may adhere to stronger security guidelines. Consumer data centers typically cater to a wider audience
and handle traffic for the mass consumer base.
Within the cloud data center traffic forecast, consumer traffic leads with a CAGR of 46 percent, reaching 3.6 ZB
annually by 2016. Business cloud traffic grows at a CAGR of 37 percent, increasing to 596 PB annually by 2016.
Table 3 provides details for global consumer and business cloud traffic growth rates.

© 2012 Cisco and/or its affiliates. All rights reserved. This document is Cisco Public. Page 8 of 28
Table 3. Global Cloud Traffic, 2011–2016
Cloud IP Traffic, 2011–2016
2011 2012 2013 2014 2015 2016 CAGR 2011–2016
By Segment (EB per Year)
Consumer 559 992 1,426 1,960 2,692 3,659 46%
Business 124 189 268 364 474 596 37%
Total (EB per Year)
Total cloud traffic 683 1,181 1,694 2,324 3,166 4,255 44%
Source: Cisco Global Cloud Index, 2012
Crucial applications are contributing to increased cloud adoption in both the business and consumer segments.
For business, the necessity to provide fast and flexible access to large data archives is an important objective for
IT organizations considering cloud-based solutions. In addition, enabling advanced analytics to tap into the wealth
of information contained in largely unstructured data archives can create a valuable competitive business
advantage. And enhanced collaboration services delivered through the cloud can increase employee productivity
and customer satisfaction.
In the consumer space, applications such as video and audio streaming are strong factors in cloud traffic growth,
while newer services such as personal content lockers are also gaining in popularity. In personal content lockers,
users can store and share music, photos, and videos through an easy-to-use interface at relatively low or no cost.
Furthermore, the proliferation of tablets, smartphones, and other mobile devices allow access to personal content
lockers in a manner convenient to the user.
Cisco GCI forecasts that personal cloud traffic will increase from .6 EB annually in 2011 to 25 EB in 2016, at
a CAGR of 111 percent (Figure 6).
Figure 6. Personal Content Locker Traffic Growth

© 2012 Cisco and/or its affiliates. All rights reserved. This document is Cisco Public. Page 9 of 28
Cloud Traffic Growth by Region
The Cisco Global Cloud Index now includes regional forecast data for cloud traffic growth (Figure 7).
● In 2011, North America generated the most cloud traffic (261 exabytes annually); followed by Asia Pacific
(216 exabytes annually); and Western Europe (156 exabytes annually).
● By 2016, Asia Pacific will generate the most cloud traffic (1.5 zettabytes annually); followed by North
America (1.1 zettabytes annually); and Western Europe (1 zettabyte annually).
● From 2011–2016, the Middle East and Africa is expected to have the highest cloud traffic growth rate
(79 percent CAGR); followed by Latin America (66 percent CAGR); and Central and Eastern Europe
(55 percent CAGR). These regions are starting from a smaller cloud traffic base than other regions.
Please refer to Appendix F for further details.
Figure 7. Cloud Traffic Growth by Region
Global Cloud Readiness
The cloud readiness segment of this study offers a regional view of the requirements for broadband and mobile
networks to deliver next-generation cloud services. The enhancements and reliability of these networks will
support the increased adoption of business consumer cloud computing solutions that deliver basic as well as
advanced application services. For example, consumers expect to be able to communicate with friends as well as
stream music and videos any time, any place. Business users require continuous access to business
communications and mobile solutions for videoconferencing and mission-critical customer and operational
management systems.
Download and upload speeds as well as latencies are essential measures to assess network capabilities for cloud
readiness. Figure 8 provides the sample business and consumer cloud service categories and the corresponding
network requirements used for this study. Note that the concurrent use of applications can further influence the
user experience and cloud accessibility.

© 2012 Cisco and/or its affiliates. All rights reserved. This document is Cisco Public. Page 10 of 28
Figure 8. Sample Business and Consumer Cloud Service Categories
Regional network performance statistics were ranked by their ability to support these three cloud service
categories. Over 90 million records from Ookla2, the Cisco GIST application, and the International
Telecommunication Union (ITU) were analyzed from nearly 150 countries around the world, covering a
span of two years of data. The regional averages of these measures are included below and in Appendix G.
The cloud readiness characteristics are as follows.
Network Access:
● Broadband ubiquity : This indicator measures fixed and mobile broadband penetration while considering
population demographics to understand the pervasiveness and expected connectivity in various regions.
Network Performance:
● Download speed : With increased adoption of mobile and fixed bandwidth-intensive applications, end-user
download speed is an important characteristic. This indicator will continue to be critical for the quality of
service delivered to virtual machines, customer relationship management (CRM), and enterprise resource
planning (ERP) cloud platforms for businesses, and video download and content retrieval cloud services
for consumers.
● Upload speed : With the increased adoption of virtual machines, tablets, and videoconferencing in
enterprises as well as by consumers on both fixed and mobile networks, upload speeds are especially
critical for delivery of content to the cloud. The importance of upload speeds will continue to increase over
time, promoted by the dominance of cloud computing and data center virtualization, the need to transmit
many millions of software updates and patches, the distribution of large files in virtual file systems, and
the demand for consumer cloud game services and backup storage.
2 Measured by Speedtest.net, small binary files are downloaded and uploaded between the web server and the client to estimate the connection speed in kilobits per second (kbps).

© 2012 Cisco and/or its affiliates. All rights reserved. This document is Cisco Public. Page 11 of 28
● Network latency : Delays experienced with voice over IP (VoIP), viewing and uploading videos, online
banking on mobile broadband, or viewing hospital records in a healthcare setting, are due to high latencies
(usually reported in milliseconds). Reducing delay in delivering packets to and from the cloud is crucial
to delivering today’s advanced services (and ensuring a high-quality end-user experience).
Broadband Ubiquity
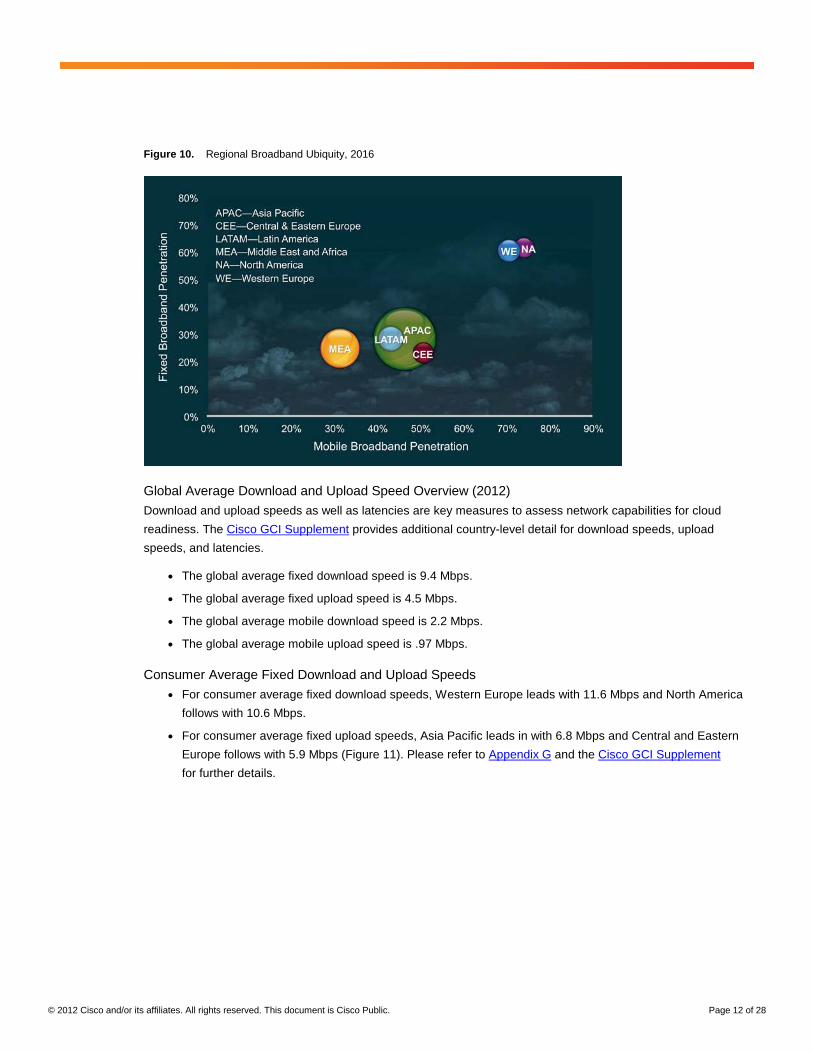
Figures 9 and 10 summarize broadband penetration by region in 2011 and 2016. North America and Western
Europe led in broadband access (fixed and mobile) in 2011 and will continue to lead by 2016. However, all regions
will show measurable improvement in broadband access to their respective populations throughout the forecast
period. Asia Pacific leads in the number of subscribers throughout the forecast period due to the region’s large
population.
The methodology for estimating of broadband ubiquity has changed since the initial release of the Cisco Global
Cloud Index in 2011. This year, internal projections were used based on a bottom-up approach that includes
estimating broadband lines and average users per household, and then validating the country estimates against
country-specific telecom-reported data. On the mobile side, the approach focuses on mobile Internet users instead
of subscriptions, which prevents duplicative calculations (because some users may have multiple subscriptions).
Please refer to Appendix H for further details.
Figure 9. Regional Broadband Ubiquity, 2011
© 2012 Cisco and/or its affiliates. All rights reserved. This document is Cisco Public. Page 12 of 28
Figure 10. Regional Broadband Ubiquity, 2016
Global Average Download and Upload Speed Overview (2012)
Download and upload speeds as well as latencies are key measures to assess network capabilities for cloud
readiness. The Cisco GCI Supplement provides additional country-level detail for download speeds, upload
speeds, and latencies.
● The global average fixed download speed is 9.4 Mbps.
● The global average fixed upload speed is 4.5 Mbps.
● The global average mobile download speed is 2.2 Mbps.
● The global average mobile upload speed is .97 Mbps.
Consumer Average Fixed Download and Upload Speeds ● For consumer average fixed download speeds, Western Europe leads with 11.6 Mbps and North America
follows with 10.6 Mbps.
● For consumer average fixed upload speeds, Asia Pacific leads in with 6.8 Mbps and Central and Eastern
Europe follows with 5.9 Mbps (Figure 11). Please refer to Appendix G and the Cisco GCI Supplement
for further details.

© 2012 Cisco and/or its affiliates. All rights reserved. This document is Cisco Public. Page 13 of 28
Figure 11. Regional Consumer Average Fixed Speeds, 2012
Consumer Average Mobile Download and Upload Speeds ● For consumer average mobile download speeds, North America leads with 3.3 Mbps and Western Europe
follows with 2.7 Mbps.
● For consumer average mobile upload speeds, North America leads with 1.6 Mbps, and Western Europe
follows with 1.2 Mbps (Figure 12). Please refer to Appendix G and the Cisco GCI Supplement for further
details.
Figure 12. Regional Consumer Average Mobile Speeds, 2012

© 2012 Cisco and/or its affiliates. All rights reserved. This document is Cisco Public. Page 14 of 28
Business Average Fixed Download and Upload Speeds ● For business average fixed download speeds, Western Europe leads with 15.8 Mbps and Central and
Eastern Europe is next with 11.5 Mbps.
● For business average fixed upload speeds, Western Europe leads with 11.3 Mbps and Central and
Eastern Europe is next with 7.6 Mbps (Figure 13). Please refer to Appendix G and the Cisco GCI
Supplement for further details.
Figure 13. Regional Business Average Fixed Speeds, 2012
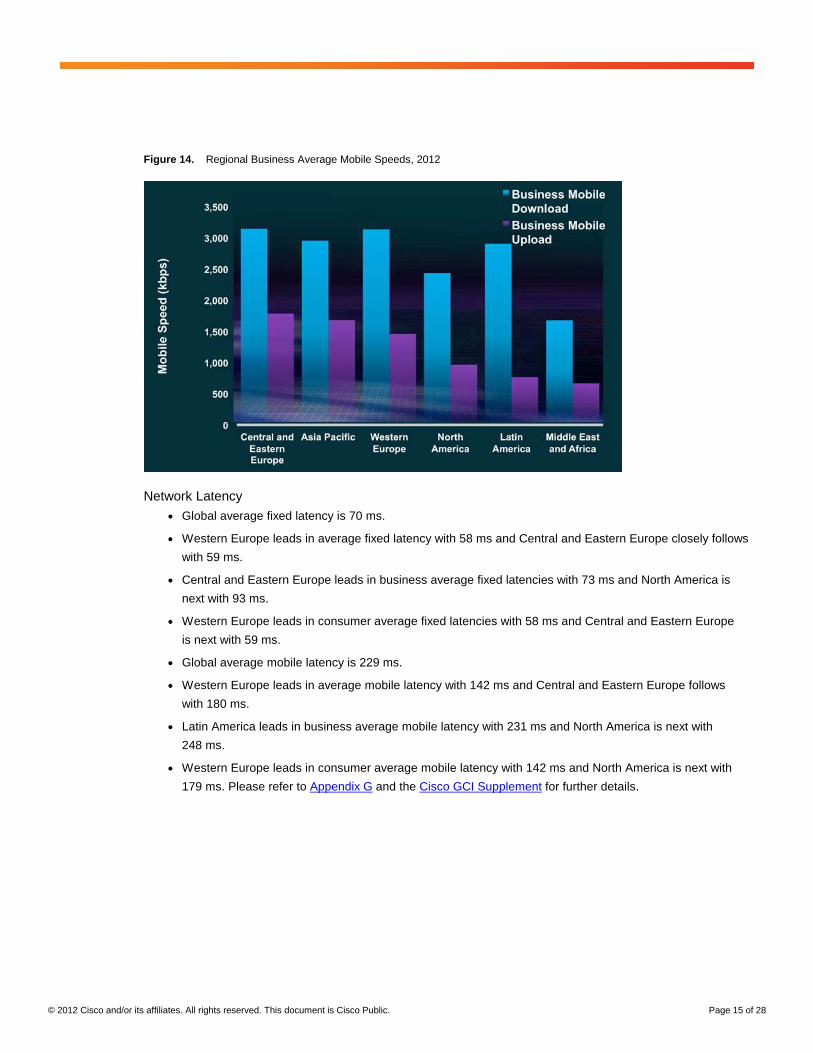
Business Mobile Download and Upload Speeds ● For business average mobile download speeds, Central and Eastern Europe leads with 3.14 Mbps and
Western Europe follows with 3.13 Mbps.
● For business average mobile download speeds, Central and Eastern Europe leads with 1.7 Mbps and
Asia Pacific follows with 1.6 Mbps (Figure 14). Please refer to Appendix G and the Cisco GCI Supplement
for further details.
© 2012 Cisco and/or its affiliates. All rights reserved. This document is Cisco Public. Page 15 of 28
Figure 14. Regional Business Average Mobile Speeds, 2012
Network Latency ● Global average fixed latency is 70 ms.
● Western Europe leads in average fixed latency with 58 ms and Central and Eastern Europe closely follows
with 59 ms.
● Central and Eastern Europe leads in business average fixed latencies with 73 ms and North America is
next with 93 ms.
● Western Europe leads in consumer average fixed latencies with 58 ms and Central and Eastern Europe
is next with 59 ms.
● Global average mobile latency is 229 ms.
● Western Europe leads in average mobile latency with 142 ms and Central and Eastern Europe follows
with 180 ms.
● Latin America leads in business average mobile latency with 231 ms and North America is next with
248 ms.
● Western Europe leads in consumer average mobile latency with 142 ms and North America is next with
179 ms. Please refer to Appendix G and the Cisco GCI Supplement for further details.

© 2012 Cisco and/or its affiliates. All rights reserved. This document is Cisco Public. Page 16 of 28
Conclusion
In summary, there are several main conclusions from the Cisco Global Cloud Index 2011–2016.
Global data center traffic is firmly in the zettabyte era and will nearly quadruple from 2011 to reach 6.6 zettabytes
annually by 2016. A rapidly growing segment of data center traffic is cloud traffic, which will increase six-fold over
the forecast period and represent nearly two-thirds of all data center traffic by 2016.
An important traffic promoter in the rapid expansion of cloud computing is increasing data center virtualization,
which provides services that are flexible, fast to deploy, and efficient. Additional trends influencing the growth of
cloud computing include the widespread adoption of multiple devices combined with increasing user expectations
to access applications and content anytime, from anywhere, over any network. To address these rising user
demands, cloud-based data centers can support more virtual machines and workloads per physical server than
traditional data centers. By 2016, nearly two-thirds of all workloads will be processed in the cloud.
This study also considers the importance of broadband ubiquity and its relationship to cloud readiness. Based on
the regional average download and upload speeds and latencies for business and consumer traffic on mobile and
fixed connections, all regions can support at least a basic level of cloud services. The focus now turns to
continuing to improve network capabilities to support the advanced cloud applications that organizations and end-
users expect and rely upon.
For More Information
For more information, please see www.cisco.com/go/cloudindex.

© 2012 Cisco and/or its affiliates. All rights reserved. This document is Cisco Public. Page 17 of 28
Appendix A: Data Center Traffic Forecast Methodology
Figure 15 outlines the methodology used to forecast data center and cloud traffic. The methodology begins with
the installed base of workloads categorized by workload type and implementation and then applies the volume of
bytes per workload per month to obtain the traffic for current and future years.
Figure 15. Data Center Traffic Forecast Methodology
Analyst Data
Data from several analyst firms and international agencies (including Gartner, IDC, Informa, Ovum, ITU, United
Nations) was used as inputs to the Global Cloud Index analysis. For example, analyst data was considered to
calculate an installed base of workloads by workload type and implementation (cloud or noncloud). The analyst
input consisted of server shipments with specified workload types and implementations. Cisco then estimated the
installed base of servers and the number of workloads per server to obtain an installed base of workloads.
Measured Data
Network data was collected from 10 enterprise and Internet centers. The architectures of the data centers
analyzed vary, with some having a three-tiered and others a two-tiered architecture. For three-tiered data centers,
data was collected from four points: the link from the access routers to the aggregation routers, the link from the
aggregation switches or routers to the site or regional backbone router, the WAN gateway, and the Internet
gateway. For two-tiered data centers, data was collected from three points: the link from the access routers to the
aggregation routers, the WAN gateway, and the Internet gateway.
For enterprise data centers, any traffic measured northbound of the aggregation also carries non-data-center
traffic to and from the local business campus. For this reason, to obtain ratios of the volume of traffic carried at
each tier, it was necessary to measure the traffic by conversations between hosts rather than traffic between
interfaces, so that the non-data-center conversations could be eliminated. The hosts at either end of the
conversation were identified and categorized by location and type. To be considered data center traffic, at least
one of the conversation pairs had to be identified as appearing in the link between the data center aggregation
switch or router and the access switch or router. A volume of 40 terabytes of traffic for each month was analyzed.
Included in this study were the 12 months ending September 2012.
In addition, as noted in the white paper, the methodology for the estimation of cloud data center traffic has
changed since the last release of the Cisco Global Cloud Index. The previous methodology included all storage
traffic in the noncloud traffic category. The updated methodology includes storage traffic associated with cloud
workloads in the cloud traffic category. For example, storage traffic associated with cloud application development
would be counted as cloud traffic in the updated methodology, but would have been excluded in the previous
methodology.

© 2012 Cisco and/or its affiliates. All rights reserved. This document is Cisco Public. Page 18 of 28
Appendix B: Global Cloud Index and Visual Networking Index
The Cisco Global Cloud Index and Cisco Visual Networking Index are distinct forecasts that have an area of
overlap. The Cisco VNI forecasts the amount of traffic crossing the Internet and IP WAN networks, while the
Cisco GCI forecasts traffic within the data center, from data center to data center, and from data center to user.
The Cisco VNI forecast consists of data-center-to-user traffic, along with non-data-center traffic not included in
the Cisco GCI (various types of peer-to-peer traffic).
The Cisco GCI includes data-center-to-user traffic (this is the overlap with the Cisco VNI) data-center-to-data-
center traffic, and traffic within the data center. The Cisco VNI forecasts the amount of traffic crossing the Internet
and IP WAN networks (Figure 16).
Figure 16. Cisco VNI and Global Cloud Index
© 2012 Cisco and/or its affiliates. All rights reserved. This document is Cisco Public. Page 19 of 28
Appendix C: Multiple Device Proliferation
The rapid growth in the adoption of multiple devices by end users, consumers and businesses alike, has been
noted in this white paper as a major factor in the transition to cloud-based services that can provide ubiquitous
access to content and applications through any device at any location.
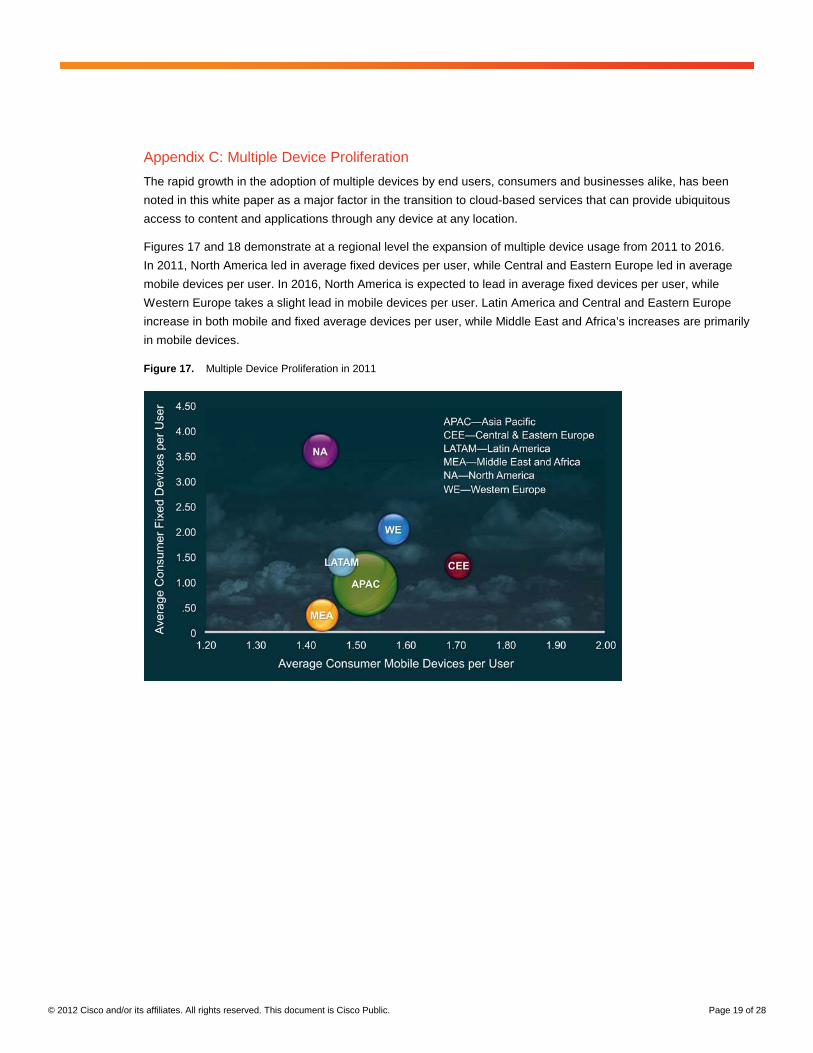
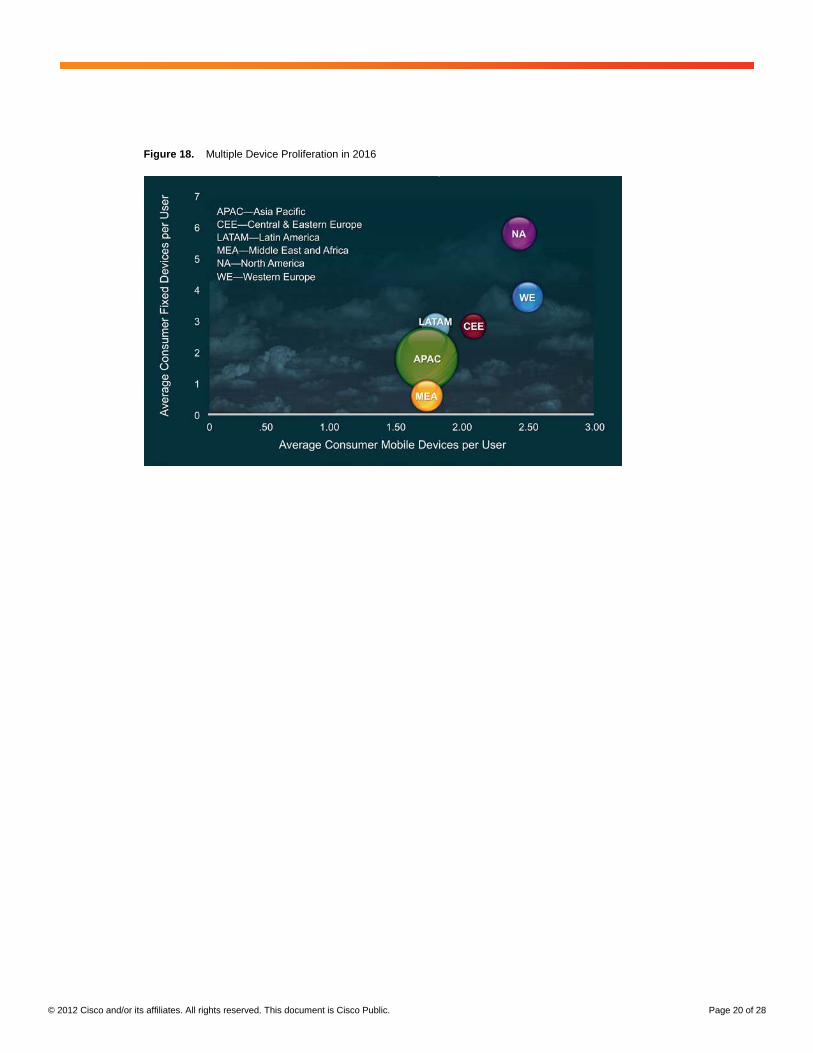
Figures 17 and 18 demonstrate at a regional level the expansion of multiple device usage from 2011 to 2016.
In 2011, North America led in average fixed devices per user, while Central and Eastern Europe led in average
mobile devices per user. In 2016, North America is expected to lead in average fixed devices per user, while
Western Europe takes a slight lead in mobile devices per user. Latin America and Central and Eastern Europe
increase in both mobile and fixed average devices per user, while Middle East and Africa’s increases are primarily
in mobile devices.
Figure 17. Multiple Device Proliferation in 2011
© 2012 Cisco and/or its affiliates. All rights reserved. This document is Cisco Public. Page 20 of 28
Figure 18. Multiple Device Proliferation in 2016
© 2012 Cisco and/or its affiliates. All rights reserved. This document is Cisco Public. Page 21 of 28
Appendix D: IPv6 and Cloud Traffic
As indicated by the Cisco Global Cloud Index, 2011–2016, strong cloud traffic growth is expected over the next
few years. This growth is largely due to businesses, public sector organizations, and consumers who are
increasingly connecting to business-critical applications, communications services, and interactive multimedia
content through the cloud, using multiple devices.
Each network-connected device or node (including smartphones, tablets, PCs, TVs, and M2M) will require an IP
address, but IPv4 address space is rapidly depleting. IPv6, however, is well-positioned to deliver the scalability
and operational efficiencies that will deliver an environment where every “thing” could be part of the cloud.
The IPv6 cloud transformation is already underway, with providers enabling IPv6 for their service offerings,
including:
● Cisco WebEx® offering the first Collaboration Cloud service over IPv6 before year end, and the first to
U.S. federal customers
● Cloud infrastructure providers such as Rackspace, Amazon, and OVH enabling IPv6 by default
● StratoGen managed hosting of 4 million domain names over IPv6
● Cloud services running over IPv6, such as Google Gmail or GDoc for enterprises and the public sector
● Content delivery network providers Akamai and Limelight deploying IPv6 throughout their infrastructures,
and offering IPv6 caching and transition services to their enterprise customers
In addition, progress is being made in the IPv6 enablement of web content likely to traverse the cloud, including
such popular sites as Facebook, YouTube, and Netflix. The Cisco IPv6 Lab tracks the top 500 websites in more
than 120 countries, providing insights into the growing trend of web content available over IPv6 (Figure 19).
For example, in the Czech Republic, 59.4 percent of web pages are available over IPv6, and 52.9 percent are
available in Brazil. Comparatively, France has 49 percent; while the United States has 43.8 percent. Some
countries have much more room to grow in terms of IPv6 website availability, such as Russia (28.8 percent) or
China (17.8 percent). Obviously these percentages of pages available to users with IPv6 connectivity are delivered
from a relatively small number of websites that rank high as most visited. In other words, a small number of
websites among the top visited sites account for the majority of the content visited over IPv6.

© 2012 Cisco and/or its affiliates. All rights reserved. This document is Cisco Public. Page 22 of 28
Figure 19. Global Websites Available over IPv6
Source: Cisco IPv6Lab, http://6lab.cisco.com/stats
Another perspective to consider is the capability of devices to connect to an IPv6 network when it becomes
enabled. As forecast in the Cisco VNI 2011–2016 Update, 40.3 percent of fixed and mobile devices will be
IPv6-capable by 2016, increasing from 1.03 billion devices in 2011 to 7.6 billion in 2016, at a 49 percent CAGR.
With this convergence of cloud adoption and IPv6 enablement, the question is not if IPv6 cloud transformation
will occur, but rather how quickly, and whether service providers and enterprises will be prepared to take
advantage of the opportunities ahead.
“In a world of IPv4 scarcity, and as users will be connected using either IPv6 or shared IPv4, it is in both the
interest of cloud providers and users to use end-to-end IPv6 connectivity to access their data and applications,
without incurring the risk of impacting the performance, security, and user experience created by the IPv4 address
sharing mechanism. It requires enterprise and cloud providers alike to enable IPv6 access to their applications
whether they reside in the cloud or in their own data center.” – Alain Fiocco, Senior Director, Cisco IPv6 High
Impact Project

© 2012 Cisco and/or its affiliates. All rights reserved. This document is Cisco Public. Page 23 of 28
Appendix E: Workload Distribution by Region
Tables 4, 5, and 6 summarize data center workloads by type and region.
Table 4. Regional Distribution of Total Data Center Workloads, in Millions
Region 2011 2012 2013 2014 2015 2016 CAGR 2011–16
Asia Pacific 23.0 28.1 36.0 45.8 55.7 66.7 24%
Central and Eastern Europe 2.2 2.7 3.6 4.9 6.4 8.0 29%
Latin America 2.3 3.0 4.4 6.4 8.7 11.4 38%
Middle East and Africa 1.0 1.3 2.0 3.0 4.6 6.8 48%
North America 26.4 31.5 36.5 40.0 43.4 47.1 12%
Western Europe 16.3 20.1 25.6 31.5 36.3 40.7 20%
Source: Cisco Analysis, 2012
Table 5. Regional Distribution of Cloud Workloads, in Millions
Region 2011 2012 2013 2014 2015 2016 CAGR 2011–16
Asia Pacific 6.7 10.6 16.2 23.2 31.2 40.6 43%
Central and Eastern Europe 0.7 1.0 1.7 2.5 3.7 5.0 50%
Latin America 0.7 1.1 2.0 3.3 5.0 7.2 60%
Middle East and Africa 0.3 0.5 0.9 1.5 2.6 4.2 73%
North America 8.1 12.5 17.1 21.0 25.1 29.7 30%
Western Europe 4.9 7.8 11.7 16.2 20.7 25.4 39%
Source: Cisco Analysis, 2012
Table 6. Regional Distribution of Traditional Data Center Workloads, in Millions
Region 2011 2012 2013 2014 2015 2016 CAGR 2011–16
Asia Pacific 16.3 17.4 19.8 22.6 24.5 26.0 10%
Central and Eastern Europe 1.6 1.7 2.0 2.4 2.7 3.0 14%
Latin America 1.6 1.8 2.3 3.0 3.6 4.2 21%
Middle East and Africa 0.7 0.8 1.1 1.5 2.0 2.6 30%
North America 18.3 19.0 19.3 19.0 18.2 17.4 -1%
Western Europe 11.4 12.4 13.8 15.3 15.6 15.3 6%
Source: Cisco Analysis, 2012
© 2012 Cisco and/or its affiliates. All rights reserved. This document is Cisco Public. Page 24 of 28
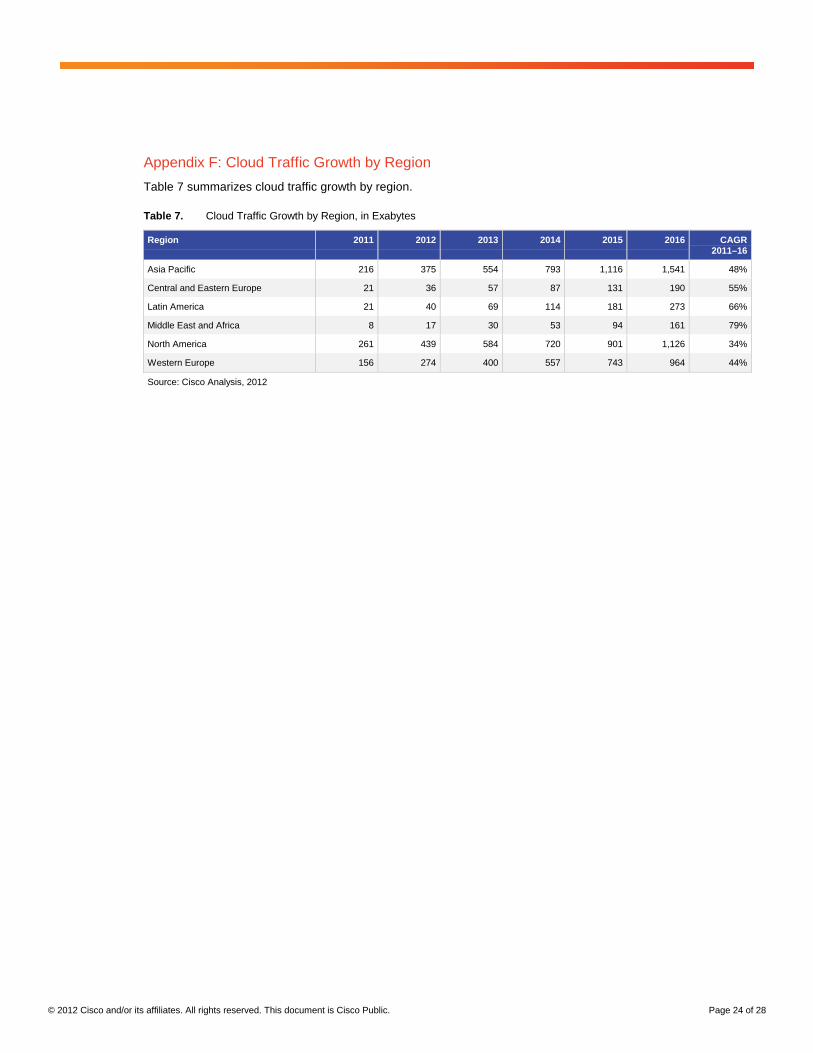
Appendix F: Cloud Traffic Growth by Region
Table 7 summarizes cloud traffic growth by region.
Table 7. Cloud Traffic Growth by Region, in Exabytes
Region 2011 2012 2013 2014 2015 2016 CAGR 2011–16
Asia Pacific 216 375 554 793 1,116 1,541 48%
Central and Eastern Europe 21 36 57 87 131 190 55%
Latin America 21 40 69 114 181 273 66%
Middle East and Africa 8 17 30 53 94 161 79%
North America 261 439 584 720 901 1,126 34%
Western Europe 156 274 400 557 743 964 44%
Source: Cisco Analysis, 2012

© 2012 Cisco and/or its affiliates. All rights reserved. This document is Cisco Public. Page 25 of 28
Appendix G: Regional Cloud Readiness Summary
Table 8 summarizes cloud readiness by region, considering download and upload speeds, and latency. Please
refer to the Cisco GCI Supplement for more detail.
Table 8. Regional Cloud Readiness
Network Segment Region Average Download Speeds (kbps)
Average Upload Speeds (kbps)
Average Latency (ms)
Fixed Business Asia Pacific 8,190 5,433 215
Central and Eastern Europe 11,477 7,635 73
Latin America 7,606 6,809 117
Middle East and Africa 2,349 976 442
North America 9,420 7,538 93
Western Europe 15,755 11,305 94
Business average 10,056 7,505 154
Consumer Asia Pacific 9,367 6,790 76
Central and Eastern Europe 9,119 5,967 59
Latin America 3,919 989 92
Middle East and Africa 3,457 1,021 120
North America 10,588 2,714 62
Western Europe 11,610 2,515 58
Consumer average 9,469 4,490 70
Fixed Average 9,438 4,514 70
Mobile Business Asia Pacific 2,955 1,680 347
Central and Eastern Europe 3,143 1,784 309
Latin America 2,907 763 231
Middle East and Africa 1,677 666 388
North America 2,432 963 248
Western Europe 3,136 1,461 264
Business average 2,919 1,443 266
Consumer Asia Pacific 1,670 757 449
Central and Eastern Europe 2,130 927 197
Latin America 1,222 585 247
Middle East and Africa 1,922 727 323
North America 3,315 1,563 179
Western Europe 2,651 1,152 142
Consumer average 2,209 967 231
Mobile Average 2,218 964 229
Source: Cisco Analysis, 2012

© 2012 Cisco and/or its affiliates. All rights reserved. This document is Cisco Public. Page 26 of 28
Appendix H: Broadband Ubiquity
Tables 9 and 10 summarize regional broadband penetration for 2011 and 2016. The methodology for the
estimation of broadband and Internet ubiquity has changed since the initial release of the Global Cloud Index
in 2011. This year, internal projections were used based on a bottom-up approach that includes estimating
broadband lines and average users per household, and then validating the country estimates against country-
specific telecom-reported data. On the mobile side, the approach focuses on mobile Internet users instead of
subscriptions, which prevents duplicative calculations (as some users may have multiple subscriptions).
Table 9. Regional Broadband Penetration (Percentages Indicate Users with Broadband Access Per Region) in 2011
Region Fixed Broadband Subscriptions (2011)
Mobile Broadband Users (2011)
Population (2011)
Asia Pacific 815,516,524 (21%) 627,271,466 (16%) 3,880,762,984
Central and Eastern Europe 92,426,466 (19%) 67,546,558 (14%) 491,195,658
Latin America 141,743,264 (23%) 79,083,243 (13%) 605,241,915
Middle East and Africa 223,884,843 (17%) 74,891,178 (6%) 1,305,228,573
North America 226,280,637 (63%) 106,975,042 (30%) 360,824,514
Western Europe 252,360,141 (58%) 111,968,203 (26%) 434,200,925
Source: Cisco Analysis, 2012
Table 10. Regional Broadband Penetration (Percentages Indicate Users with Broadband Access Per Region) in 2016
Region Fixed Broadband Subscriptions (2016)
Mobile Broadband Users (2016)
Population (2016)
Asia Pacific 1,130,347,660 (28%) 1,689,910,551 (42%) 4,066,889,702
Central and Eastern Europe 113,441,563 (23%) 210,862,009 (42%) 498,003,945
Latin America 178,876,168 (28%) 251,529,890 (39%) 639,071,873
Middle East and Africa 350,433,532 (24%) 426,103,680 (29%) 1,458,984,051
North America 232,197,863 (62%) 216,644,001 (58%) 376,433,836
Western Europe 269,376,918 (61%) 247,291,265 (56%) 442,819,648
Source: Cisco Analysis, 2012

© 2012 Cisco and/or its affiliates. All rights reserved. This document is Cisco Public. Page 27 of 28
Appendix I: Regional Download and Upload Peak Speeds
Download and upload peak speeds measured are shown in Table 11.
Table 11. Regional Download and Upload Peak Speeds
Network Segment Region Peak Download Speeds (kbps)
Peak Upload Speeds (kbps)
Fixed Business Asia Pacific 100,418 85,023
Central and Eastern Europe 931,107 663,801
Latin America 43,318 59,257
Middle East and Africa 145,720 97,122
North America 61,237 479,006
Western Europe 218,480 243,480
Consumer Asia Pacific 34,118 130,832
Central and Eastern Europe 44,141 315,950
Latin America 15,280 166,218
Middle East and Africa 15,798 136,316
North America 36,096 246,634
Western Europe 49,618 406,175
Mobile Business Asia Pacific 16,634 21,166
Central and Eastern Europe 21,835 19,736
Latin America 32,889 33,216
Middle East and Africa 16,992 18,085
North America 10,894 36,252
Western Europe 15,485 16,068
Consumer Asia Pacific 5,273 19,152
Central and Eastern Europe 7,563 13,414
Latin America 3,969 13,600
Middle East and Africa 5,577 9,240
North America 18,172 42,198
Western Europe 8,479 16,357
Source: Cisco Analysis, 2012

© 2012 Cisco and/or its affiliates. All rights reserved. This document is Cisco Public. Page 28 of 28
Printed in USA FLGD 10656 10/12