Embed Size (px)
Citation preview

The CowsBy TN

CowMilk
Boss of Milk-Cow Farm

After came back from the statistic class of Mr.K
He started gather the data about the milk of his cows in a month, and he made this table

a/ Is the data approximates the normal distribution? Using the probabilities of the normal distribution.
b/ Mr.K makes a small party in his class. CowMilk decided that he will kill all of the cows which give him less than 50% of the normal milk to make the steaks and get milk from the cows which give him greater than 80% of the normal. What is the number of cows he will use?
C/ After the party, Cow Milk decided that he will buy a car which total cost 300 000$.He’s going to rent the money from the bank which give him 7.5% annually interest in 5 years, compound monthly. CowMilk is also going to, How much he can save in the total if CowMilk uses all the money from selling milk of the cows he has to pay the interest otherwise he pay exactly the number of payment monthly the bank will give him?

Oki… lets start …..
Question a. “Is the data approximates the normal distribution? Using the probabilities of the normal distribution.”
1 σ
2σ
3 σ
Remember Standard Normal Distribution curve!
To determine . We need to imagine that the number of cow should lay on x-axis and the number of milk should lay on the y-axis
Number of Cow Number of
Milk
So….

We need to calculate the mean(μ) and standard deviation (σ) base on the data of Milk and Cows !
To calculate mean and standard deviation, we can use the calculator:
List 2 List 1
We put the number of cow to List 2 and the number of Milk to List 1
Use 1-Var stats to calculate σ and μ:[stat] => CALC => 1-Var Stats => [ENTER]
And set up the screen like this …

1-Var Stats L1,L2
The number of Milk
Frequency ( the number of Cow)
And….ENTERWe will see on the main screen of the calculator:
σ
μFor convenient, we can save the result of μ and σ by use :[VARS] => Statistics… => =>[STO] => [ALPHA] => [M]( the divide key) => [ENTER]

And now, we have mean and standard deviation, Lets calculate 1 σ , 2 σ, and 3σ
1-Standard deviation :
Max: + =20.7Min: - =17.12
So the Cows which give the milk between 17.12L and 20.7L .. uhmm lets count …There are 153 Cows
2-Standard deviation :
Max: + 2 =20.7Min: - 2 =17.12
3-Standard deviation :
Max: + 3 =20.7Min: - 3 =17.12
There are 193 Cows
There are 209 Cows

After that, we change the number of Cows to %, because we want to compare with “68-95-99 rule”
1-Standard deviation : 2-Standard deviation : 3-Standard deviation :
153/209=73.2%
We know total of the Cows : 209 Cows
193/209=92.34% 209/209=100%
Base on “68-95-99 rule” the data approximates the normal distribution
To be..continue =>

……Time to Party ^_^!
And now….
B/Mr.K makes a small party in his class. CowMilk decided that he will kill all of the cows which give him less than 50% of the normal milk to make the steaks and get milk from the cows which give him greater than 80% of the normal. What is the number of cows he will use?

When solve any kind of this question, we usually need a GRAPH
Because we know that the data approximates the normal distribution (question a/) . We can make a graph
“…he will kill all of the cows which give him less than 50% of the normal milk… “
“…get milk from the cows which give him greater than 80% of the normal…”
The question give us the %, we need to change it to the z-score to put on the graph !

To convert from % to Z-score, we use the calculator to convert : [2ND] => [VARS] => invNorm( => [ENTER]
And then put 0.80 (80%) => [ENTER]
The calculator will give us z-score of 0.80(80%) , this is 0.84162
0.84162
So on for 50% REMEMBER put invNorm(0.5) in the calculator
We will have z-score of 0.50(50%) = 0
0

0.841620
“…get milk from the cows which give him greater than 80% of the normal…”
“…he will kill all of the cows which give him less than 50% of the normal milk… “
Look at the question
So, look at the graph, we will see the cows he will use
The Cows he will use
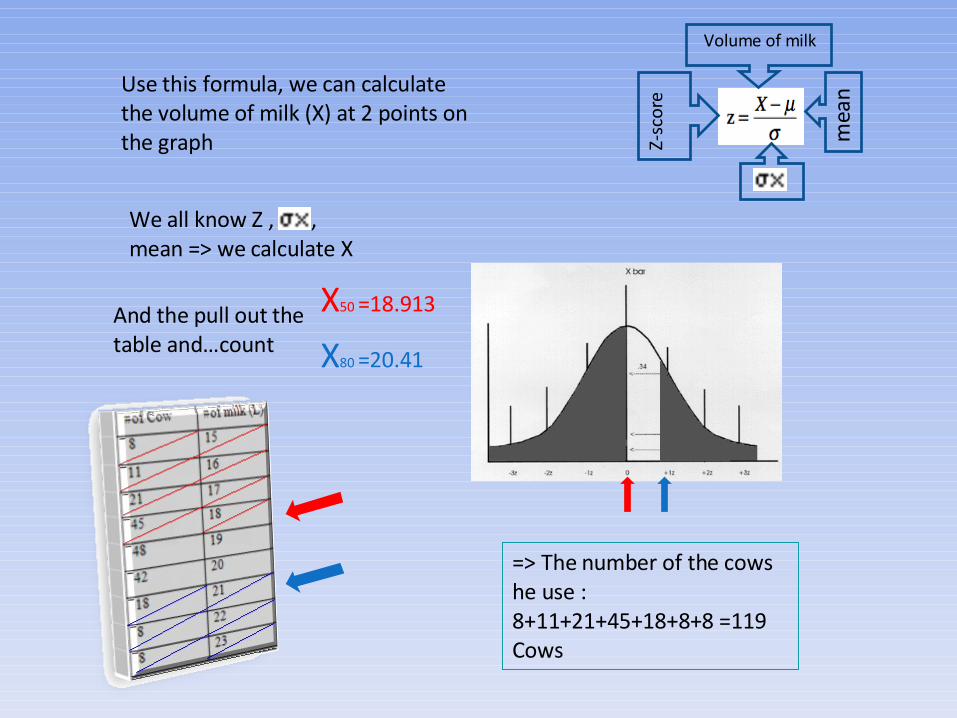
Use this formula, we can calculate the volume of milk (X) at 2 points on the graph m
ean
Z-sc
ore
Volume of milk
We all know Z , , mean => we calculate X
X50 =18.913
X80 =20.41
And the pull out the table and…count
=> The number of the cows he use :8+11+21+45+18+8+8 =119 Cows


Can I borrow 300 000$ to buy that
Car ?
Uhmmm…we offer the loan with 7.5% annually interest
for 5 years, compound monthly
Ok !!

if I use all the money from selling milk of the cows I have, to pay the interest otherwise pay exactly the number of payment monthly the
bank will offer.
• Assume The amount of milk every month doesn’t change and 1L Milk =3$
HOW MUCH CAN I SAVE ?

At first, he need to calculate the total amount of milk he have in 1 month : 48*19 + 42*20 + 18*21 + 8*22 + 8*23 = 2490 L (The rest were killed to make steak).
=> Total $/month = 2490L * 3$/L = $7470

After that, he take his calculate and use TVM solve to calculate the monthly payment which can be offered by the bank:
TVM solve :[APPS] => Finance…=> TVM solve
=> payment/month =$ 6011.38
Total payment : $6011.38 * 60 = $360682.8

If he use all of the money he have from selling the milk to pay for monthly payment , he must find how long it will take …
….so that, he also use TVM solve with PMT = $7410
Total amount : 46.82 * $7410 = $346936.2

Consider 2 results, we can know the difference :
$360682.8 -346936.2 =$13749.6
SO…if he use all the money from selling the milk, he can make 46.8 ~ 47 payments ( 47/12 ~4 years) and save $13749.6 !!! He should do it.. I mean.. I should do it ^^