Embed Size (px)
Citation preview
Everybody Counts in Public Transport
Improve decision making, optimise services and increase
customer satisfaction
M2M Innovation World Congress
Marseille, September 2014
Public
Safety
Traffic
Management
Energy
Management
Water
Manageme
nt
Tram
Train Subway
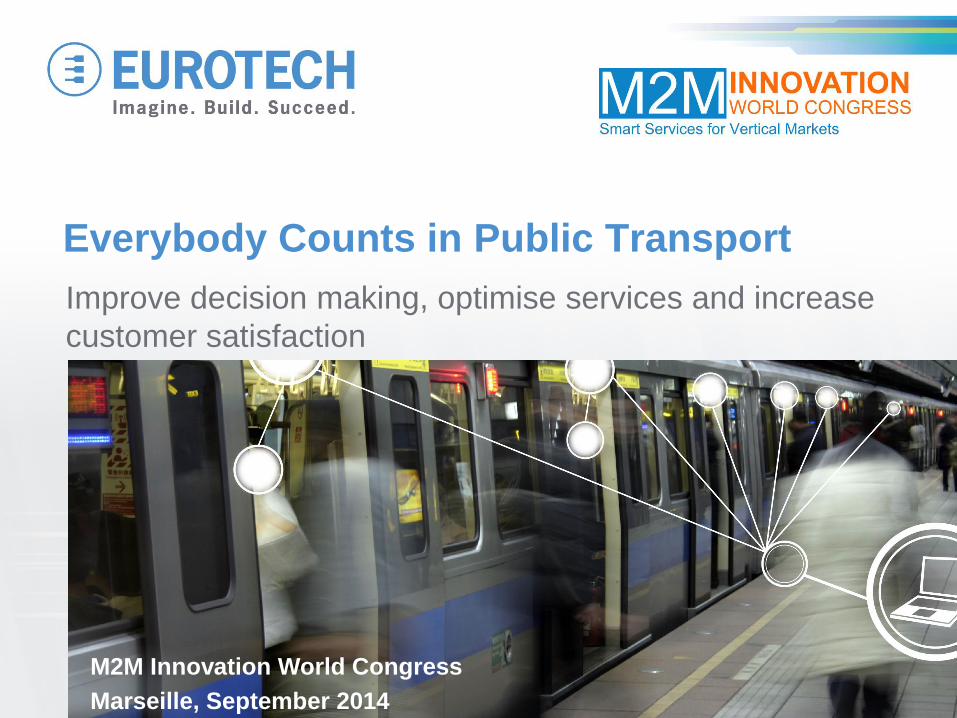
People / Passenger Counting Many Use Cases
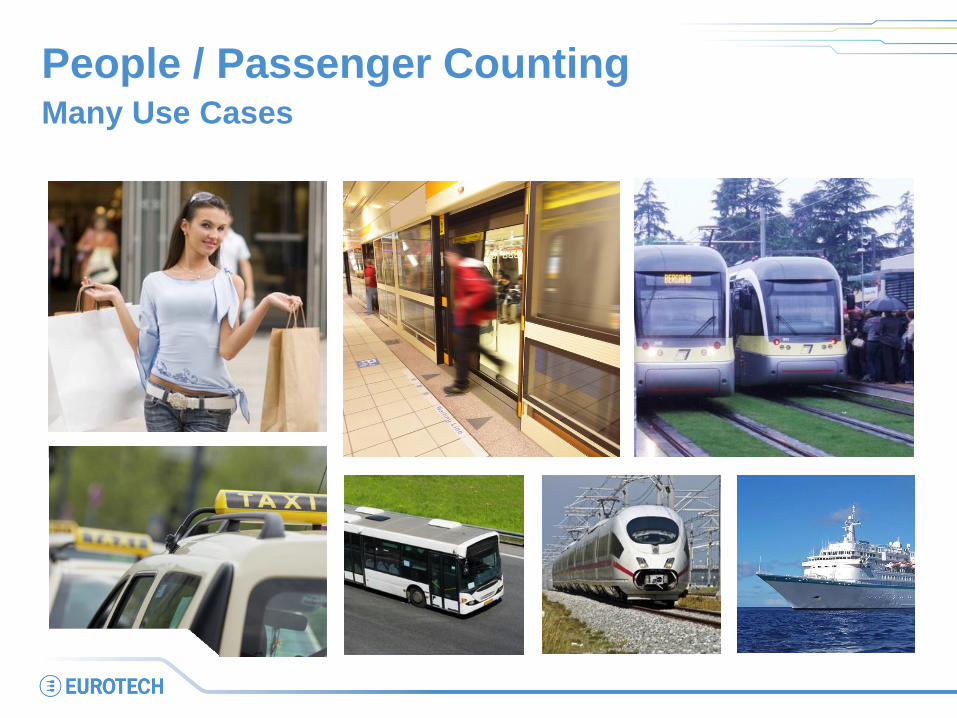
People Counting Applications
• Transportation
– Route optimisation
– Schedule modification
– Customer information and behaviour modification
– Fraud prevention and revenue protection
– Regulatory compliance
• Retail
– Foot fall analysis to monitor sales promotions or merchandising
– Deployment of staff to meet customer demand
• Facilities Management
– Smart energy planning
– Service schedule optimisation
– Compliance to building safety regulations
• Tourism
– Visitor numbers and queue management
Why count people ?
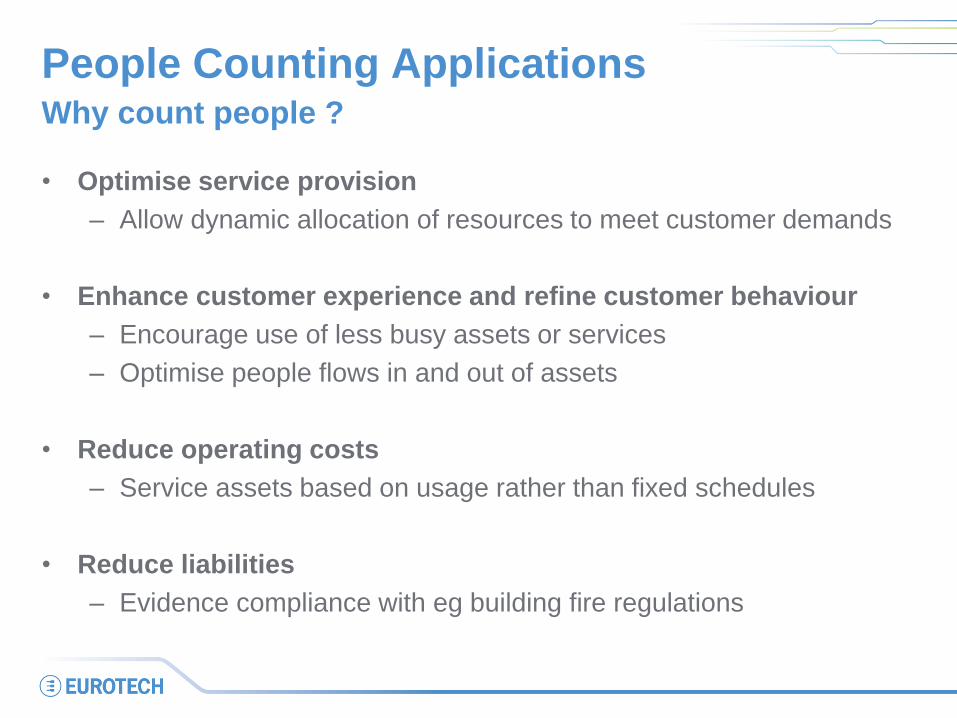
People Counting Applications
• Optimise service provision
– Allow dynamic allocation of resources to meet customer demands
• Enhance customer experience and refine customer behaviour
– Encourage use of less busy assets or services
– Optimise people flows in and out of assets
• Reduce operating costs
– Service assets based on usage rather than fixed schedules
• Reduce liabilities
– Evidence compliance with eg building fire regulations
Why count people ?
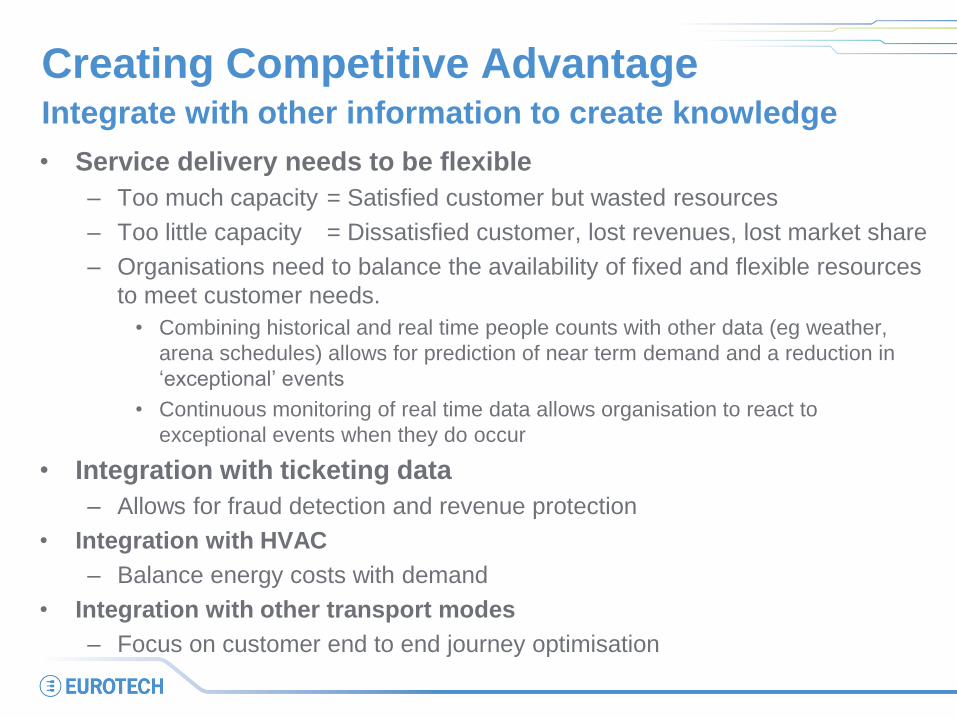
Creating Competitive Advantage
• Service delivery needs to be flexible
– Too much capacity = Satisfied customer but wasted resources
– Too little capacity = Dissatisfied customer, lost revenues, lost market share
– Organisations need to balance the availability of fixed and flexible resources
to meet customer needs.
• Combining historical and real time people counts with other data (eg weather,
arena schedules) allows for prediction of near term demand and a reduction in
‘exceptional’ events
• Continuous monitoring of real time data allows organisation to react to
exceptional events when they do occur
• Integration with ticketing data
– Allows for fraud detection and revenue protection
• Integration with HVAC
– Balance energy costs with demand
• Integration with other transport modes
– Focus on customer end to end journey optimisation
Integrate with other information to create knowledge
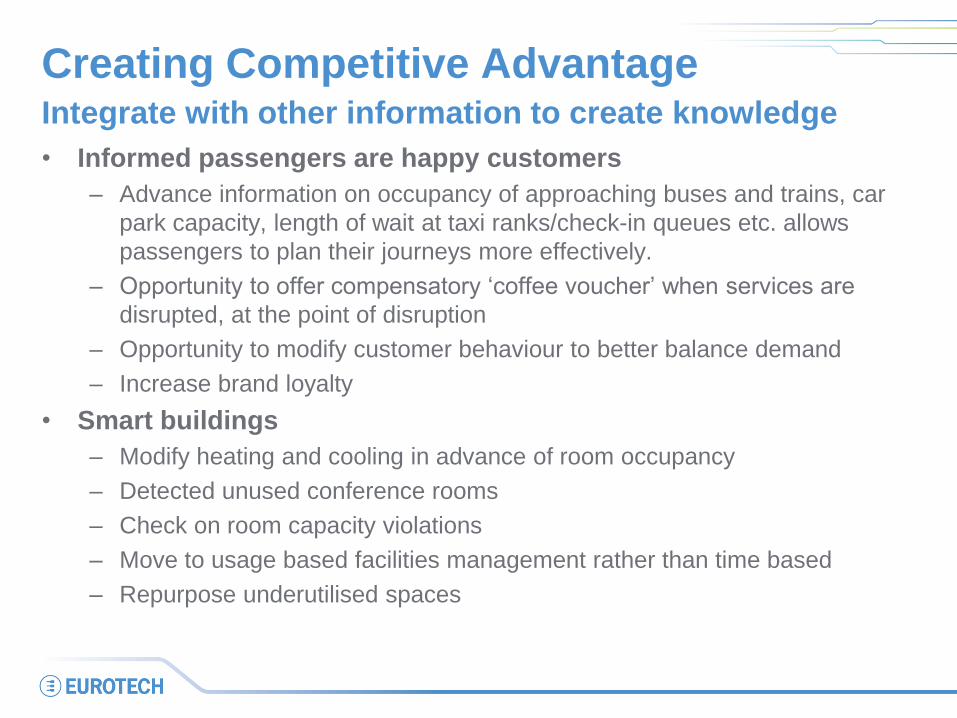
Creating Competitive Advantage
• Informed passengers are happy customers
– Advance information on occupancy of approaching buses and trains, car
park capacity, length of wait at taxi ranks/check-in queues etc. allows
passengers to plan their journeys more effectively.
– Opportunity to offer compensatory ‘coffee voucher’ when services are
disrupted, at the point of disruption
– Opportunity to modify customer behaviour to better balance demand
– Increase brand loyalty
• Smart buildings
– Modify heating and cooling in advance of room occupancy
– Detected unused conference rooms
– Check on room capacity violations
– Move to usage based facilities management rather than time based
– Repurpose underutilised spaces
Integrate with other information to create knowledge
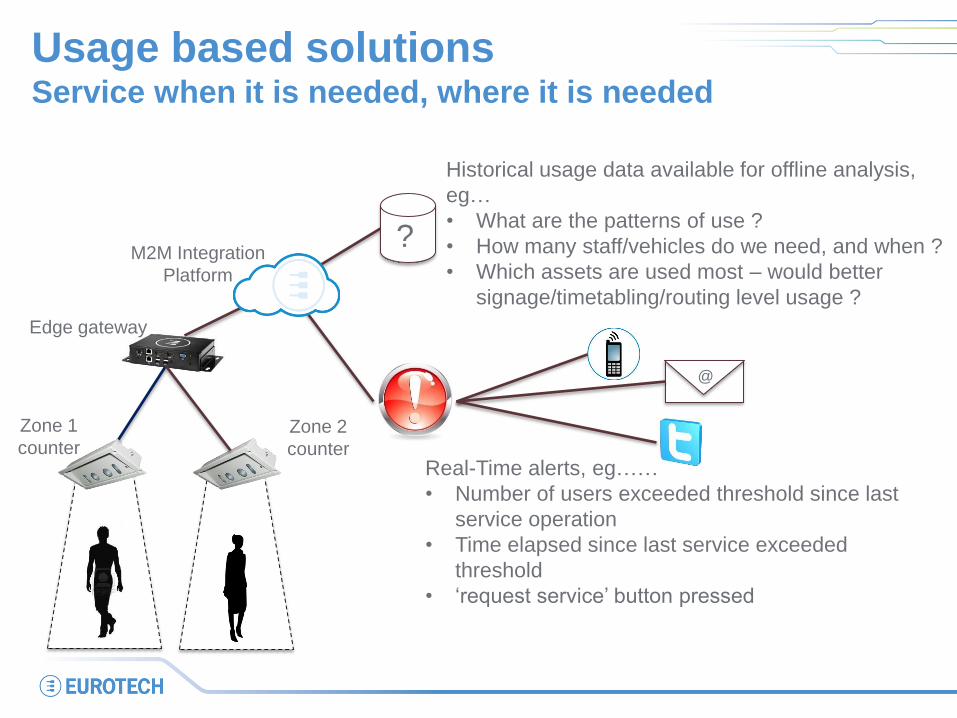
Usage based solutions Service when it is needed, where it is needed
Zone 1
counter Zone 2
counter
Historical usage data available for offline analysis,
eg…
• What are the patterns of use ?
• How many staff/vehicles do we need, and when ?
• Which assets are used most – would better
signage/timetabling/routing level usage ?
Real-Time alerts, eg……
• Number of users exceeded threshold since last
service operation
• Time elapsed since last service exceeded
threshold
• ‘request service’ button pressed
M2M Integration
Platform
@
?
Edge gateway
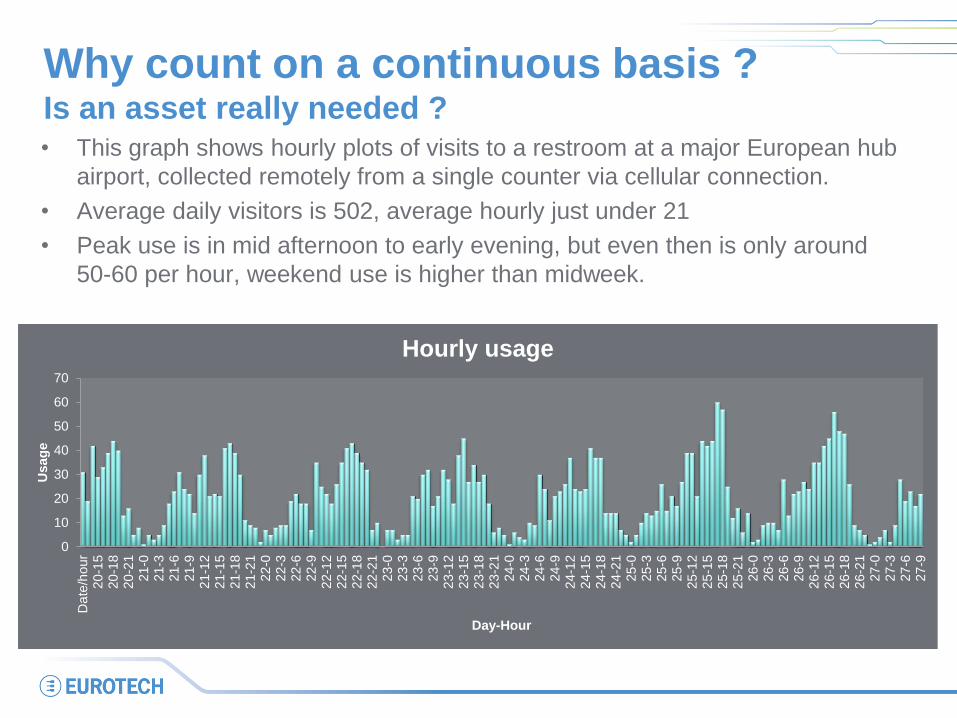
Why count on a continuous basis ? Is an asset really needed ? • This graph shows hourly plots of visits to a restroom at a major European hub
airport, collected remotely from a single counter via cellular connection.
• Average daily visitors is 502, average hourly just under 21
• Peak use is in mid afternoon to early evening, but even then is only around
50-60 per hour, weekend use is higher than midweek.
0
10
20
30
40
50
60
70
Da
te/h
our
20
-15
20
-18
20
-21
21
-021
-321
-621
-921
-12
21
-15
21
-18
21
-21
22
-022
-322
-622
-922
-12
22
-15
22
-18
22
-21
23
-023
-323
-623
-923
-12
23
-15
23
-18
23
-21
24
-024
-324
-624
-924
-12
24
-15
24
-18
24
-21
25
-025
-325
-625
-925
-12
25
-15
25
-18
25
-21
26
-026
-326
-626
-926
-12
26
-15
26
-18
26
-21
27
-027
-327
-627
-9
Usag
e
Day-Hour
Hourly usage
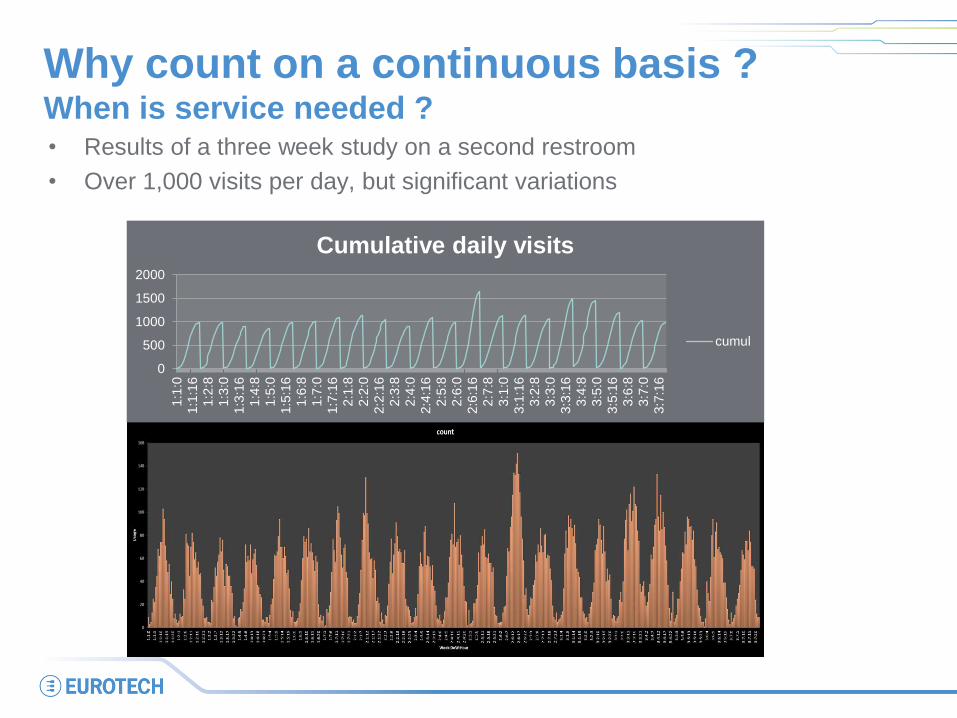
Why count on a continuous basis ? When is service needed ? • Results of a three week study on a second restroom
• Over 1,000 visits per day, but significant variations
0
500
1000
1500
2000
1:1
:0
1:1
:16
1:2
:81:3
:0
1:3
:16
1:4
:8
1:5
:0
1:5
:16
1:6
:8
1:7
:0
1:7
:16
2:1
:8
2:2
:0
2:2
:16
2:3
:8
2:4
:0
2:4
:16
2:5
:8
2:6
:0
2:6
:16
2:7
:8
3:1
:0
3:1
:16
3:2
:8
3:3
:0
3:3
:16
3:4
:8
3:5
:0
3:5
:16
3:6
:8
3:7
:0
3:7
:16
Cumulative daily visits
cumul
Why count on a continuous basis ? When is service needed ?
diff 200
wk 2
Average of time diff 50 wkday
cleaner visits Monday Tuesday Wednesday Thursday Friday Saturday Sunday Monday Tuesday Wednesday Thursday Friday Saturday Sunday
1 08:55:14 08:36:47 08:58:22 09:05:25 09:04:16 09:12:15 07:29:35 08:55:14 08:36:47 08:58:22 09:05:25 09:04:16 09:12:15 07:29:35
2 02:02:24 03:07:02 03:07:31 02:36:36 02:58:48 02:32:29 03:02:28 10:57:38 11:43:49 12:05:53 11:42:01 12:03:04 11:44:44 10:32:03
3 01:46:05 02:33:45 02:56:31 02:17:40 02:44:28 01:40:22 02:35:25 12:43:43 14:17:34 15:02:24 13:59:41 14:47:32 13:25:06 13:07:28
4 02:31:33 02:57:23 03:52:27 02:55:23 03:18:12 01:28:29 02:34:15 15:15:16 17:14:57 18:54:51 16:55:04 18:05:44 14:53:35 15:41:43
5 03:39:46 04:00:50 03:04:43 01:20:09 03:18:05 18:55:02 21:15:47 00:00:00 19:59:47 00:00:00 16:13:44 18:59:48
6 01:26:11 00:00:00 00:00:00 00:00:00 17:39:55 00:00:00
7 01:48:20 19:28:15
8 03:02:00 22:30:15
00:00:00
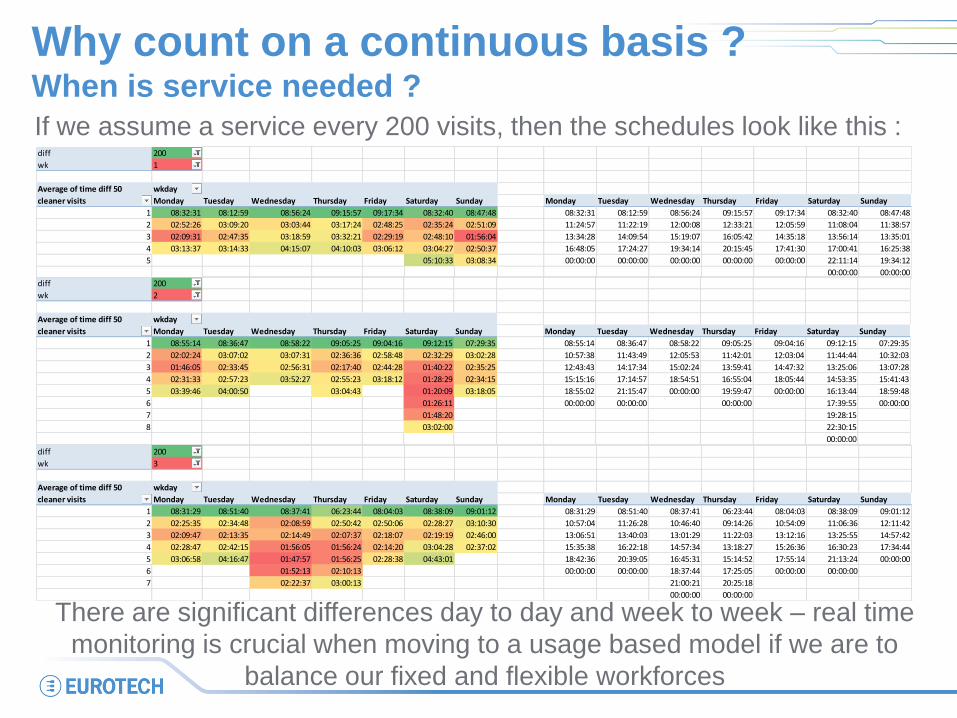
If we assume a service every 200 visits, then the schedules look like this : diff 200
wk 1
Average of time diff 50 wkday
cleaner visits Monday Tuesday Wednesday Thursday Friday Saturday Sunday Monday Tuesday Wednesday Thursday Friday Saturday Sunday
1 08:32:31 08:12:59 08:56:24 09:15:57 09:17:34 08:32:40 08:47:48 08:32:31 08:12:59 08:56:24 09:15:57 09:17:34 08:32:40 08:47:48
2 02:52:26 03:09:20 03:03:44 03:17:24 02:48:25 02:35:24 02:51:09 11:24:57 11:22:19 12:00:08 12:33:21 12:05:59 11:08:04 11:38:57
3 02:09:31 02:47:35 03:18:59 03:32:21 02:29:19 02:48:10 01:56:04 13:34:28 14:09:54 15:19:07 16:05:42 14:35:18 13:56:14 13:35:01
4 03:13:37 03:14:33 04:15:07 04:10:03 03:06:12 03:04:27 02:50:37 16:48:05 17:24:27 19:34:14 20:15:45 17:41:30 17:00:41 16:25:38
5 05:10:33 03:08:34 00:00:00 00:00:00 00:00:00 00:00:00 00:00:00 22:11:14 19:34:12
00:00:00 00:00:00
diff 200
wk 3
Average of time diff 50 wkday
cleaner visits Monday Tuesday Wednesday Thursday Friday Saturday Sunday Monday Tuesday Wednesday Thursday Friday Saturday Sunday
1 08:31:29 08:51:40 08:37:41 06:23:44 08:04:03 08:38:09 09:01:12 08:31:29 08:51:40 08:37:41 06:23:44 08:04:03 08:38:09 09:01:12
2 02:25:35 02:34:48 02:08:59 02:50:42 02:50:06 02:28:27 03:10:30 10:57:04 11:26:28 10:46:40 09:14:26 10:54:09 11:06:36 12:11:42
3 02:09:47 02:13:35 02:14:49 02:07:37 02:18:07 02:19:19 02:46:00 13:06:51 13:40:03 13:01:29 11:22:03 13:12:16 13:25:55 14:57:42
4 02:28:47 02:42:15 01:56:05 01:56:24 02:14:20 03:04:28 02:37:02 15:35:38 16:22:18 14:57:34 13:18:27 15:26:36 16:30:23 17:34:44
5 03:06:58 04:16:47 01:47:57 01:56:25 02:28:38 04:43:01 18:42:36 20:39:05 16:45:31 15:14:52 17:55:14 21:13:24 00:00:00
6 01:52:13 02:10:13 00:00:00 00:00:00 18:37:44 17:25:05 00:00:00 00:00:00
7 02:22:37 03:00:13 21:00:21 20:25:18
00:00:00 00:00:00
There are significant differences day to day and week to week – real time
monitoring is crucial when moving to a usage based model if we are to
balance our fixed and flexible workforces
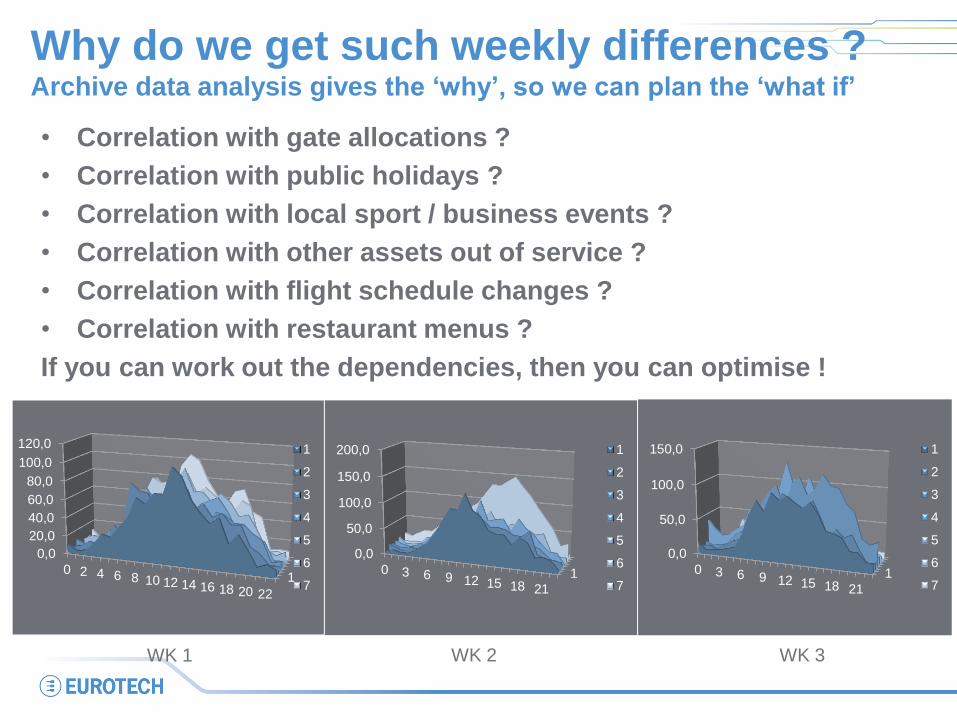
Why do we get such weekly differences ? Archive data analysis gives the ‘why’, so we can plan the ‘what if’
• Correlation with gate allocations ?
• Correlation with public holidays ?
• Correlation with local sport / business events ?
• Correlation with other assets out of service ?
• Correlation with flight schedule changes ?
• Correlation with restaurant menus ?
If you can work out the dependencies, then you can optimise !
1
0,0
20,0
40,0
60,0
80,0
100,0
120,0
0 2 4 6 8 10 12 14 16 18 20 22
1
2
3
4
5
6
71
0,0
50,0
100,0
150,0
200,0
0 3 6 9 12 15 18 21
1
2
3
4
5
6
71
0,0
50,0
100,0
150,0
0 3 6 9 12 15 18 21
1
2
3
4
5
6
7
WK 1 WK 2 WK 3
Smart City
Smart Building Public
Safety
Traffic
Management
Energy
Management
Bus
Water
Manageme
nt
Public Health
Tram
Train
Metro
Subway
Remote
Monitoring
Fitness
Machines
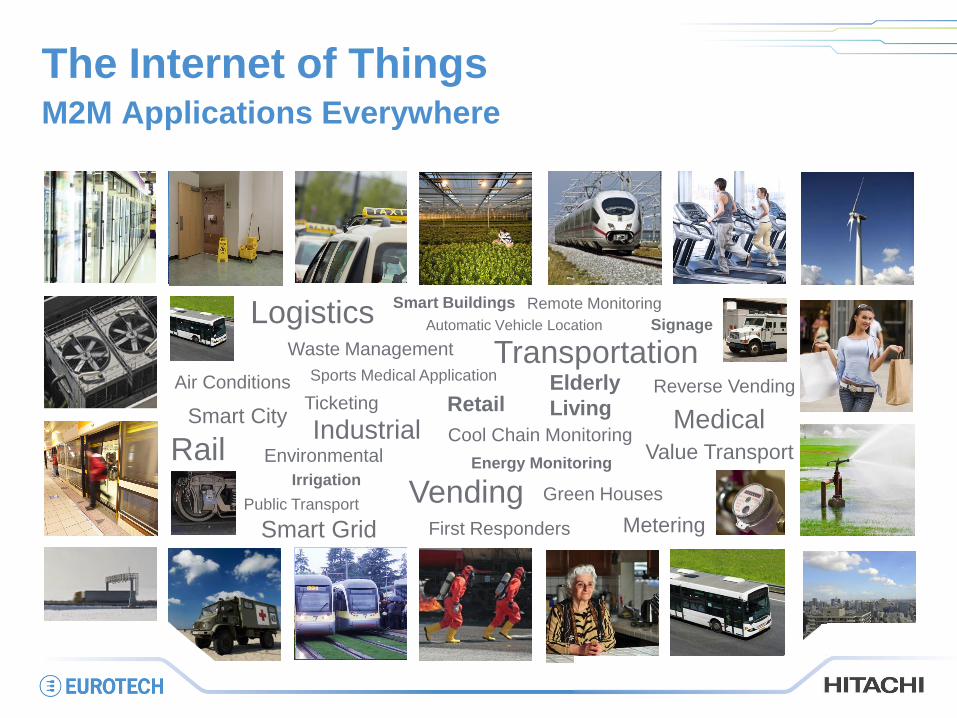
The Internet of Things M2M Applications Everywhere
Logistics
Medical
Transportation
Public Transport
Rail
Metering
Air Conditions Elderly
Living
Waste Management
Value Transport
Smart City
Environmental
Smart Grid First Responders
Green Houses
Sports Medical Application
Cool Chain Monitoring
Vending
Reverse Vending
Industrial Ticketing
Smart Buildings
Irrigation
Signage Automatic Vehicle Location
Remote Monitoring
Retail
Energy Monitoring
Medical
Elderly Living
Green Houses
Cool Chain
Monitoring
Agriculture
Retail
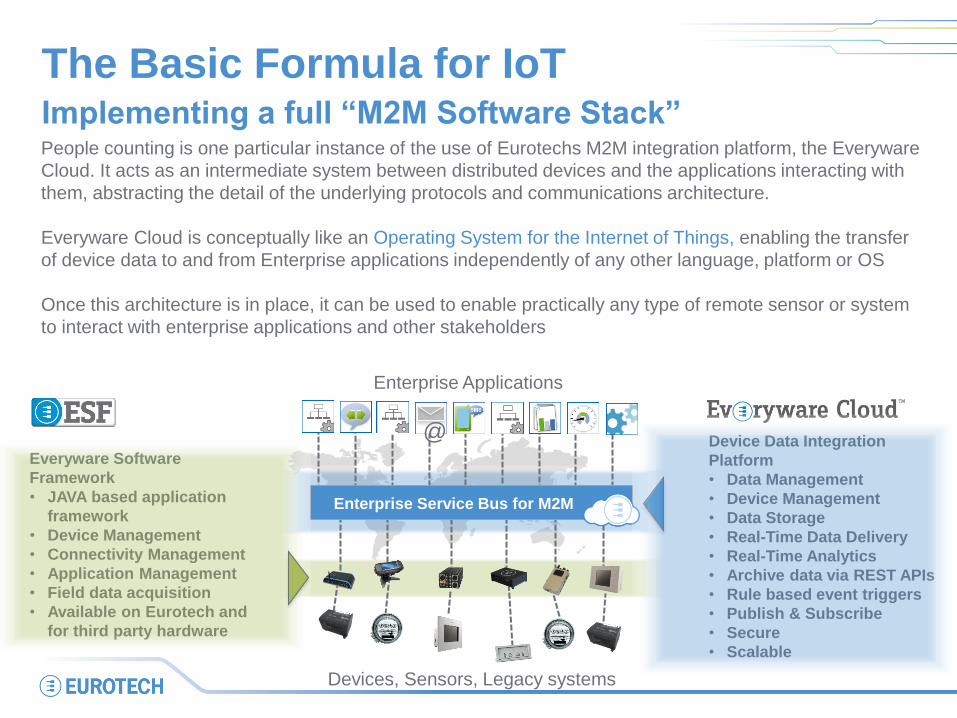
The Basic Formula for IoT Implementing a full “M2M Software Stack” People counting is one particular instance of the use of Eurotechs M2M integration platform, the Everyware
Cloud. It acts as an intermediate system between distributed devices and the applications interacting with
them, abstracting the detail of the underlying protocols and communications architecture.
Everyware Cloud is conceptually like an Operating System for the Internet of Things, enabling the transfer
of device data to and from Enterprise applications independently of any other language, platform or OS
Once this architecture is in place, it can be used to enable practically any type of remote sensor or system
to interact with enterprise applications and other stakeholders
@
Enterprise Service Bus for M2M
Device Data Integration
Platform
• Data Management
• Device Management
• Data Storage
• Real-Time Data Delivery
• Real-Time Analytics
• Archive data via REST APIs
• Rule based event triggers
• Publish & Subscribe
• Secure
• Scalable
Everyware Software
Framework
• JAVA based application
framework
• Device Management
• Connectivity Management
• Application Management
• Field data acquisition
• Available on Eurotech and
for third party hardware
Devices, Sensors, Legacy systems
Enterprise Applications
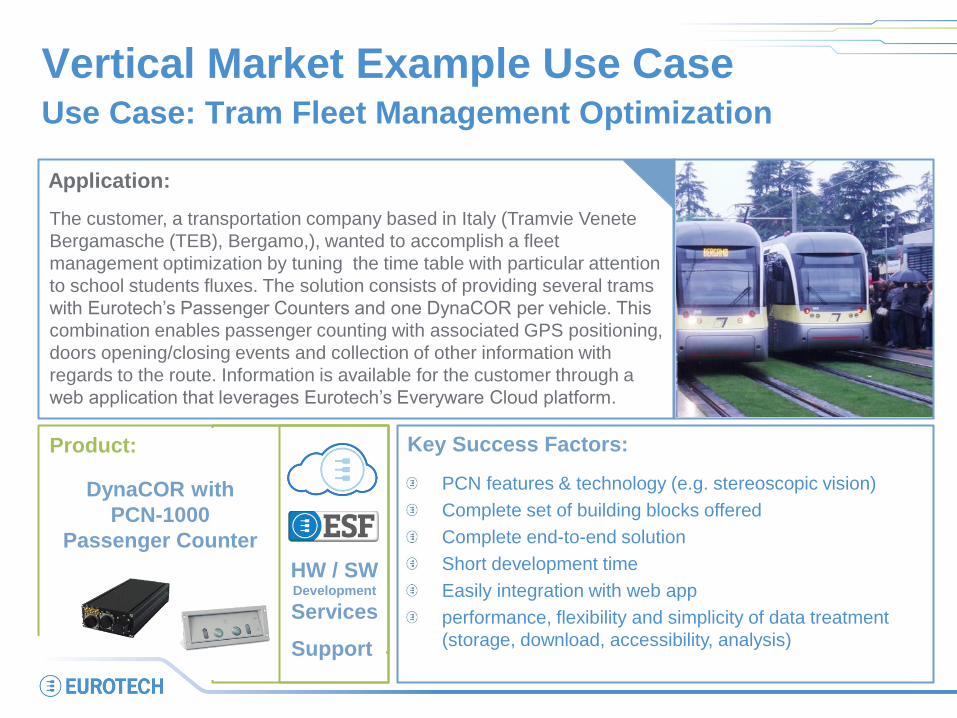
Vertical Market Example Use Case Use Case: Tram Fleet Management Optimization
Application:
The customer, a transportation company based in Italy (Tramvie Venete
Bergamasche (TEB), Bergamo,), wanted to accomplish a fleet
management optimization by tuning the time table with particular attention
to school students fluxes. The solution consists of providing several trams
with Eurotech’s Passenger Counters and one DynaCOR per vehicle. This
combination enables passenger counting with associated GPS positioning,
doors opening/closing events and collection of other information with
regards to the route. Information is available for the customer through a
web application that leverages Eurotech’s Everyware Cloud platform.
Key Success Factors:
PCN features & technology (e.g. stereoscopic vision)
Complete set of building blocks offered
Complete end-to-end solution
Short development time
Easily integration with web app
performance, flexibility and simplicity of data treatment
(storage, download, accessibility, analysis)
Product:
DynaCOR with
PCN-1000
Passenger Counter
HW / SW Development
Services
Support
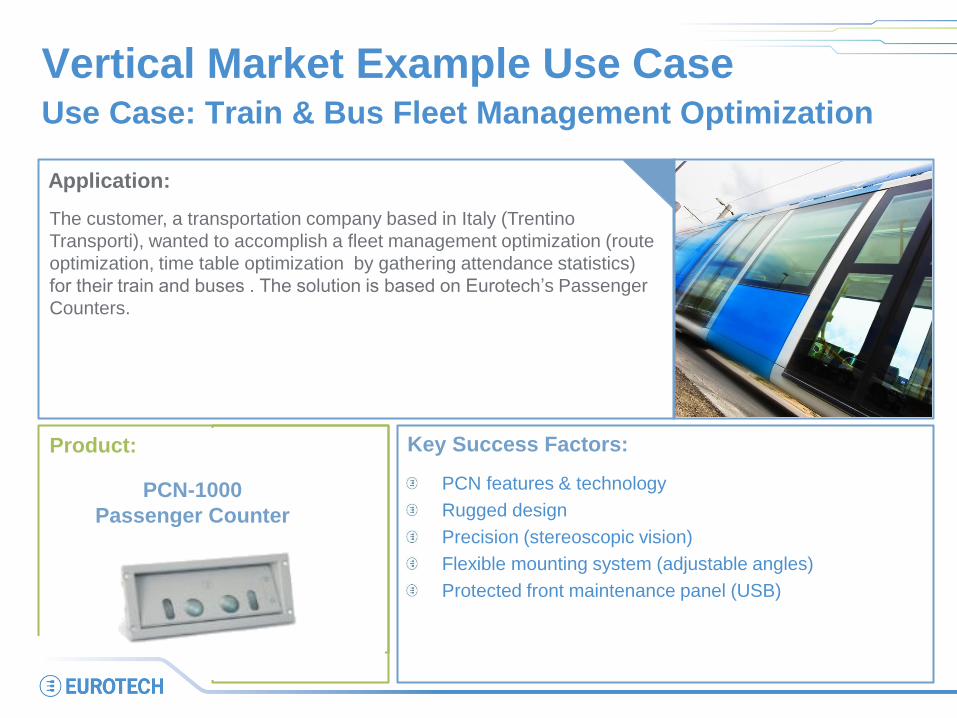
Vertical Market Example Use Case Use Case: Train & Bus Fleet Management Optimization
Application:
The customer, a transportation company based in Italy (Trentino
Transporti), wanted to accomplish a fleet management optimization (route
optimization, time table optimization by gathering attendance statistics)
for their train and buses . The solution is based on Eurotech’s Passenger
Counters.
Key Success Factors:
PCN features & technology
Rugged design
Precision (stereoscopic vision)
Flexible mounting system (adjustable angles)
Protected front maintenance panel (USB)
Product:
PCN-1000
Passenger Counter
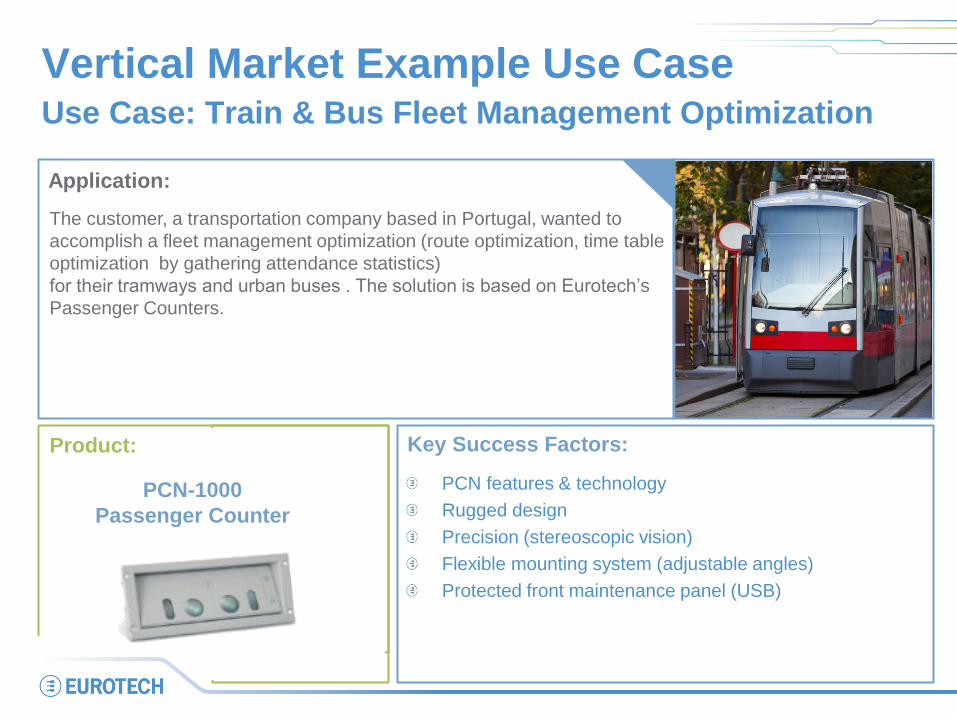
Vertical Market Example Use Case Use Case: Train & Bus Fleet Management Optimization
Application:
The customer, a transportation company based in Portugal, wanted to
accomplish a fleet management optimization (route optimization, time table
optimization by gathering attendance statistics)
for their tramways and urban buses . The solution is based on Eurotech’s
Passenger Counters.
Key Success Factors:
PCN features & technology
Rugged design
Precision (stereoscopic vision)
Flexible mounting system (adjustable angles)
Protected front maintenance panel (USB)
Product:
PCN-1000
Passenger Counter
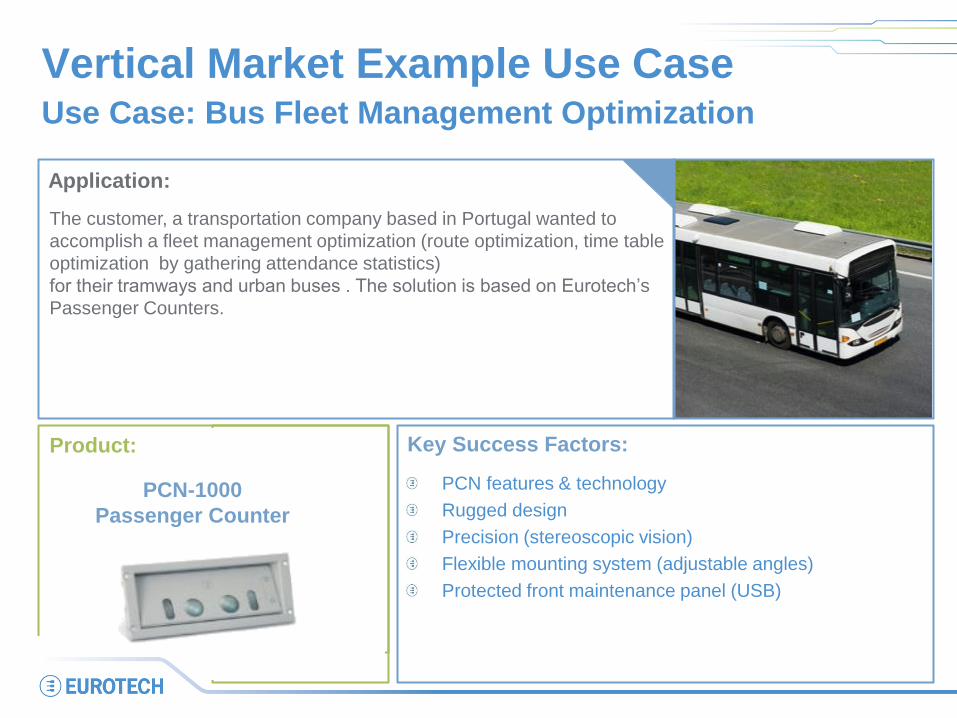
Vertical Market Example Use Case Use Case: Bus Fleet Management Optimization
Application:
The customer, a transportation company based in Portugal wanted to
accomplish a fleet management optimization (route optimization, time table
optimization by gathering attendance statistics)
for their tramways and urban buses . The solution is based on Eurotech’s
Passenger Counters.
Key Success Factors:
PCN features & technology
Rugged design
Precision (stereoscopic vision)
Flexible mounting system (adjustable angles)
Protected front maintenance panel (USB)
Product:
PCN-1000
Passenger Counter
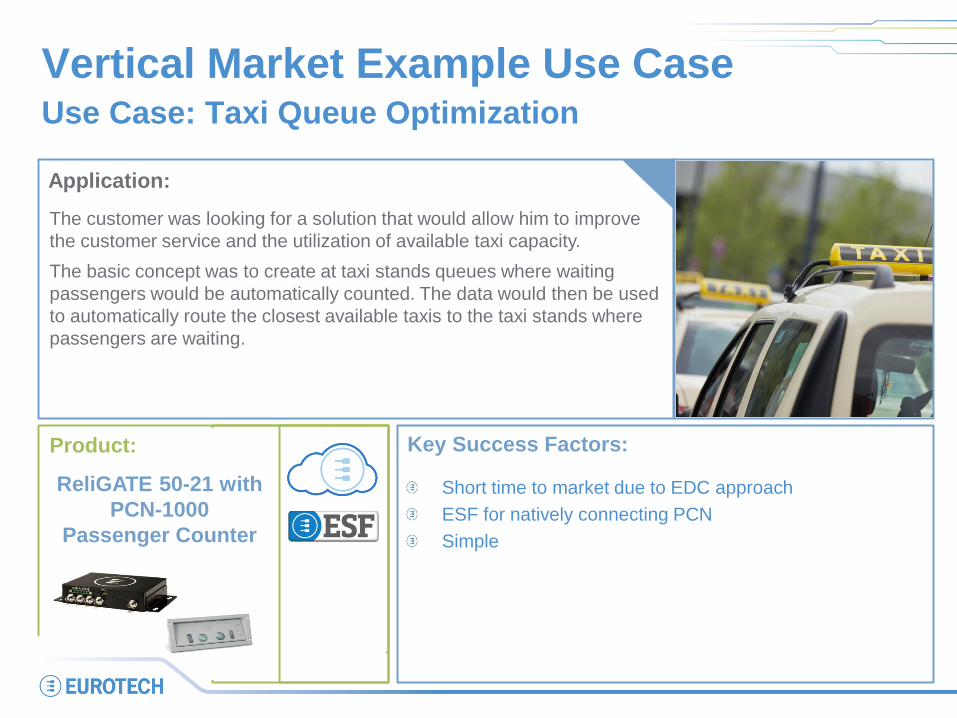
Vertical Market Example Use Case Use Case: Taxi Queue Optimization
Application:
The customer was looking for a solution that would allow him to improve
the customer service and the utilization of available taxi capacity.
The basic concept was to create at taxi stands queues where waiting
passengers would be automatically counted. The data would then be used
to automatically route the closest available taxis to the taxi stands where
passengers are waiting.
Key Success Factors:
Short time to market due to EDC approach
ESF for natively connecting PCN
Simple
Product:
ReliGATE 50-21 with
PCN-1000
Passenger Counter
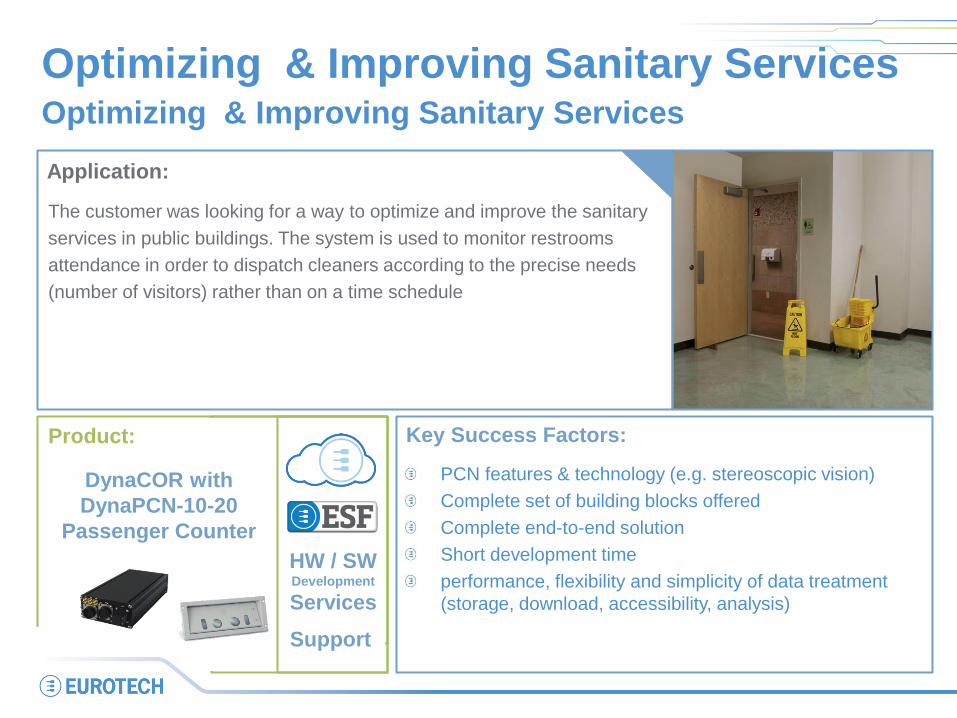
Optimizing & Improving Sanitary Services Optimizing & Improving Sanitary Services
Application:
The customer was looking for a way to optimize and improve the sanitary
services in public buildings. The system is used to monitor restrooms
attendance in order to dispatch cleaners according to the precise needs
(number of visitors) rather than on a time schedule
Key Success Factors:
PCN features & technology (e.g. stereoscopic vision)
Complete set of building blocks offered
Complete end-to-end solution
Short development time
performance, flexibility and simplicity of data treatment
(storage, download, accessibility, analysis)
Product:
DynaCOR with
DynaPCN-10-20
Passenger Counter
HW / SW Development
Services
Support
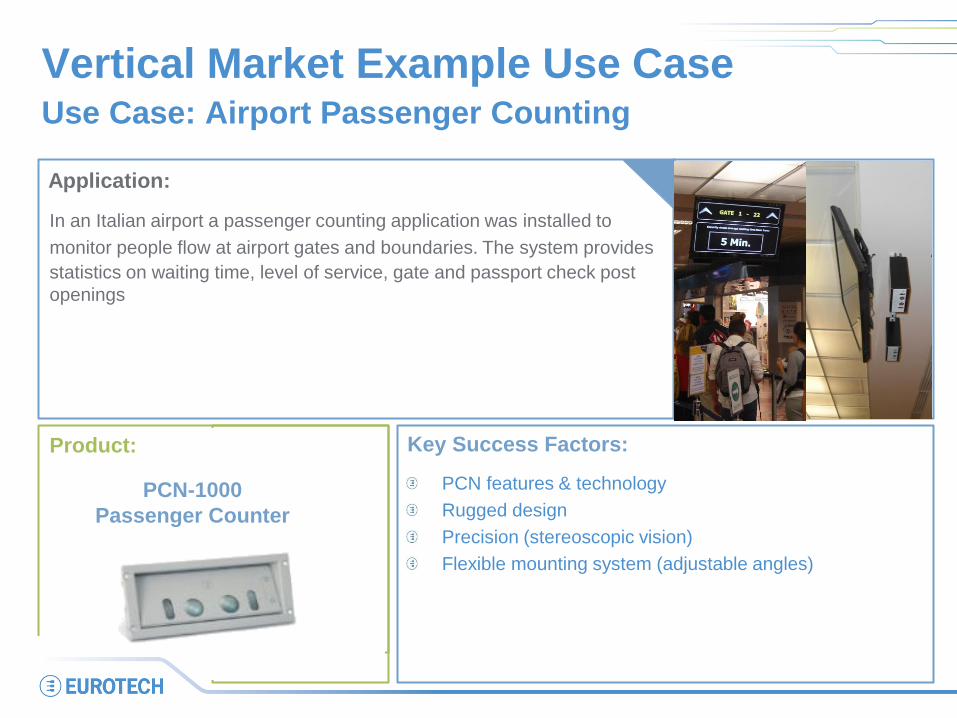
Vertical Market Example Use Case Use Case: Airport Passenger Counting
Application:
In an Italian airport a passenger counting application was installed to
monitor people flow at airport gates and boundaries. The system provides
statistics on waiting time, level of service, gate and passport check post
openings
Key Success Factors:
PCN features & technology
Rugged design
Precision (stereoscopic vision)
Flexible mounting system (adjustable angles)
Product:
PCN-1000
Passenger Counter
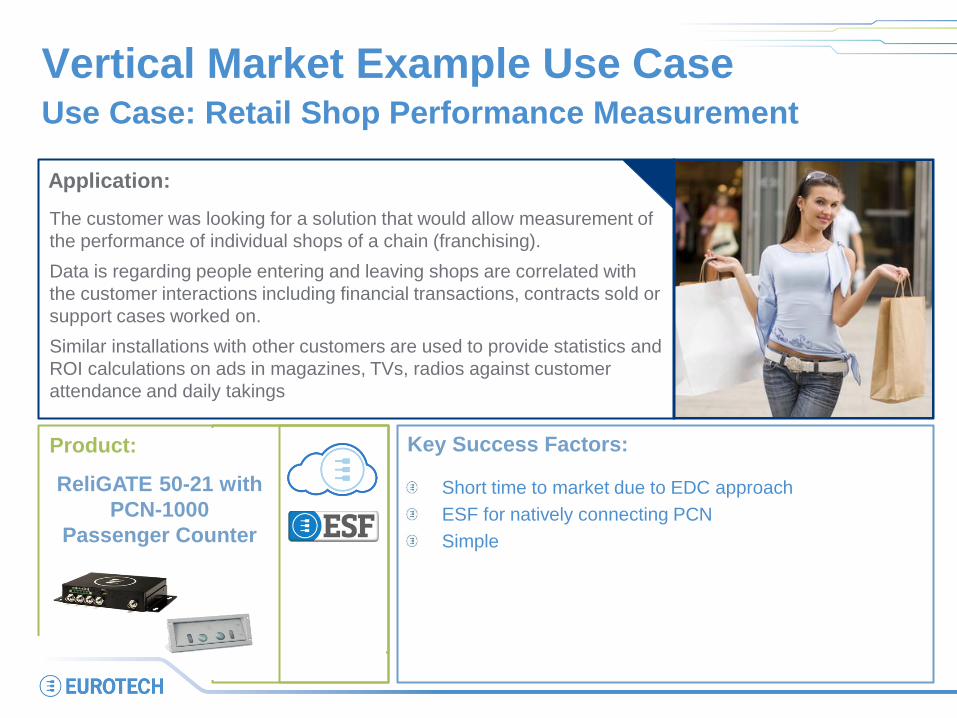
Vertical Market Example Use Case Use Case: Retail Shop Performance Measurement
Application:
The customer was looking for a solution that would allow measurement of
the performance of individual shops of a chain (franchising).
Data is regarding people entering and leaving shops are correlated with
the customer interactions including financial transactions, contracts sold or
support cases worked on.
Similar installations with other customers are used to provide statistics and
ROI calculations on ads in magazines, TVs, radios against customer
attendance and daily takings
Key Success Factors:
Short time to market due to EDC approach
ESF for natively connecting PCN
Simple
Product:
ReliGATE 50-21 with
PCN-1000
Passenger Counter
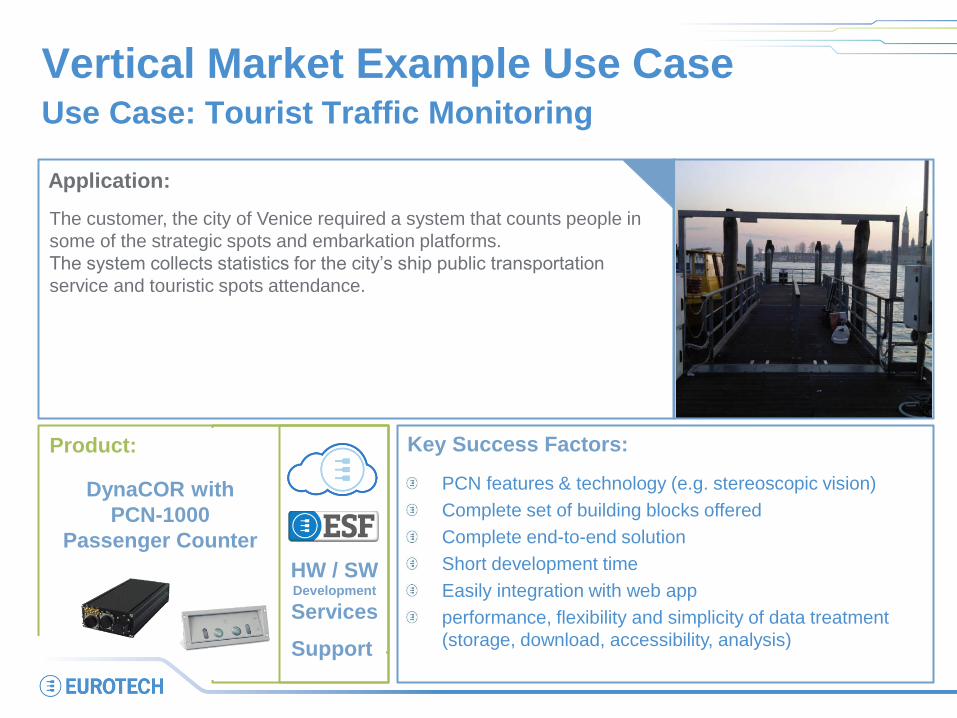
Vertical Market Example Use Case Use Case: Tourist Traffic Monitoring
Application:
The customer, the city of Venice required a system that counts people in
some of the strategic spots and embarkation platforms.
The system collects statistics for the city’s ship public transportation
service and touristic spots attendance.
Key Success Factors:
PCN features & technology (e.g. stereoscopic vision)
Complete set of building blocks offered
Complete end-to-end solution
Short development time
Easily integration with web app
performance, flexibility and simplicity of data treatment
(storage, download, accessibility, analysis)
Product:
DynaCOR with
PCN-1000
Passenger Counter
HW / SW Development
Services
Support
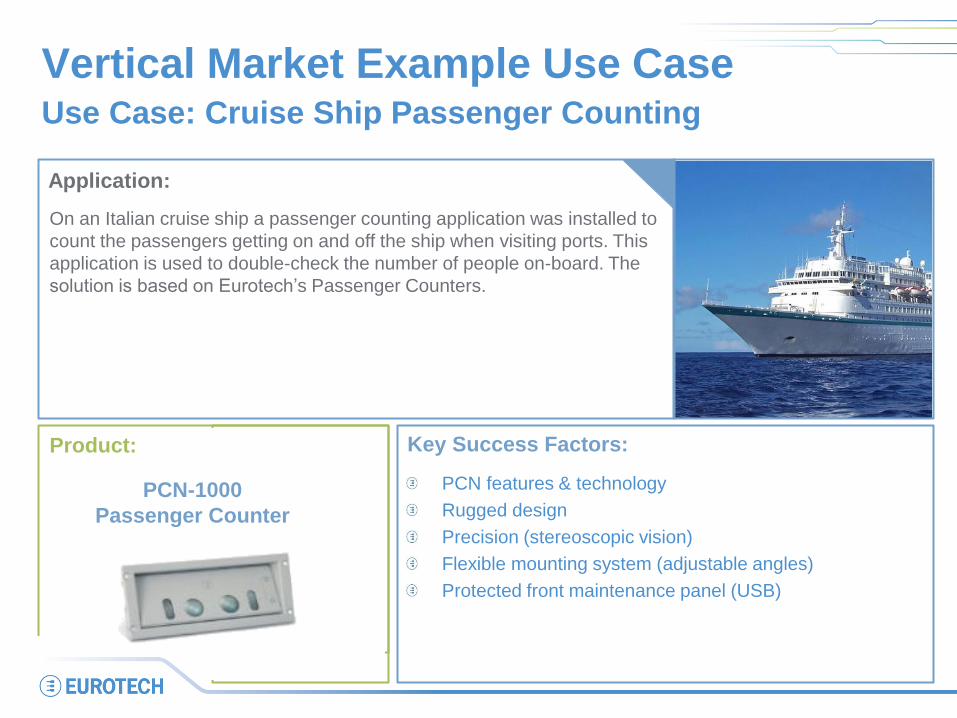
Vertical Market Example Use Case Use Case: Cruise Ship Passenger Counting
Application:
On an Italian cruise ship a passenger counting application was installed to
count the passengers getting on and off the ship when visiting ports. This
application is used to double-check the number of people on-board. The
solution is based on Eurotech’s Passenger Counters.
Key Success Factors:
PCN features & technology
Rugged design
Precision (stereoscopic vision)
Flexible mounting system (adjustable angles)
Protected front maintenance panel (USB)
Product:
PCN-1000
Passenger Counter