Embed Size (px)
Citation preview
HADOOPFull-stack real-time monitoring framework for eBay Hadoop
Hao Chen | 陈浩eBay Cloud Service
$ whoami
Hao Chen | 陈浩
Software Engineer
Analytics Data Infrastructure, Cloud Services
eBay Inc.
linkedin.com/in/haozch
twitter.com/haozch
weibo.com/haochencn
2
3
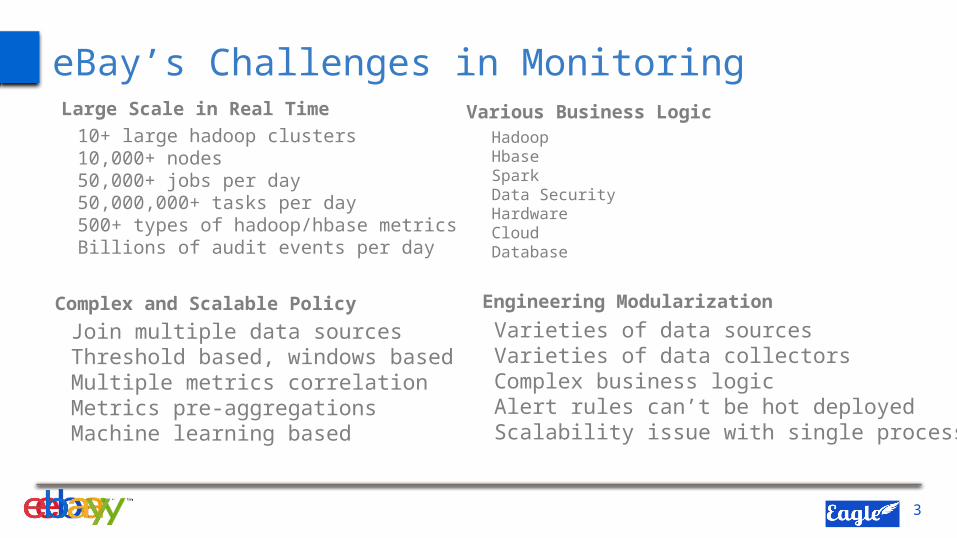
eBay’s Challenges in Monitoring
10+ large hadoop clusters10,000+ nodes50,000+ jobs per day50,000,000+ tasks per day500+ types of hadoop/hbase metricsBillions of audit events per day
Large Scale in Real Time Various Business LogicHadoopHbaseSparkData SecurityHardwareCloudDatabase
Complex and Scalable Policy
Join multiple data sourcesThreshold based, windows basedMultiple metrics correlationMetrics pre-aggregationsMachine learning based
Engineering Modularization
Varieties of data sourcesVarieties of data collectorsComplex business logicAlert rules can’t be hot deployedScalability issue with single process
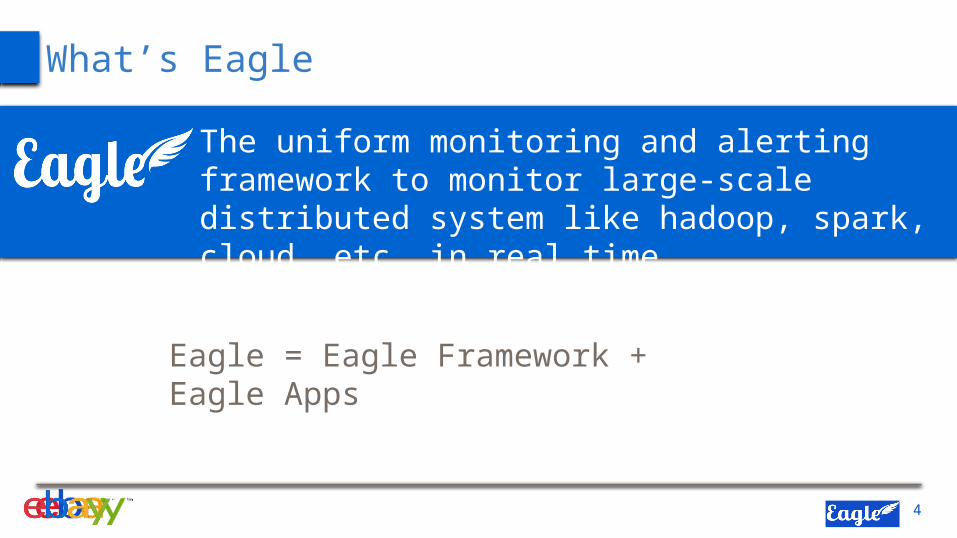
What’s Eagle
4
The uniform monitoring and alerting framework to monitor large-scale distributed system like hadoop, spark, cloud, etc. in real time.
Eagle = Eagle Framework + Eagle Apps

Eagle Ecosystem
5
Apps DAM JPA HBase Spark
Interface Web Portal REST Services Ambari Plugin
Integration Kafka Storm HBase Druid Elastic Search
Eagle FrameworkProvide full-stack monitoring framework for efficiently developing highly scalable real-time monitoring applications.
Eagle AppsProvide built-in monitoring applications for domains like hadoop, spark, hbase, storm and cloud.
Eagle IntegrationIntegrate with distributed real-time execution environment like storm, message bus like kafka and storage layer like hbase, and also support extensions.
Eagle InterfaceAllow to access or manage eagle through REST service, web UI or Ambari plugin.
Eagle Framework
6
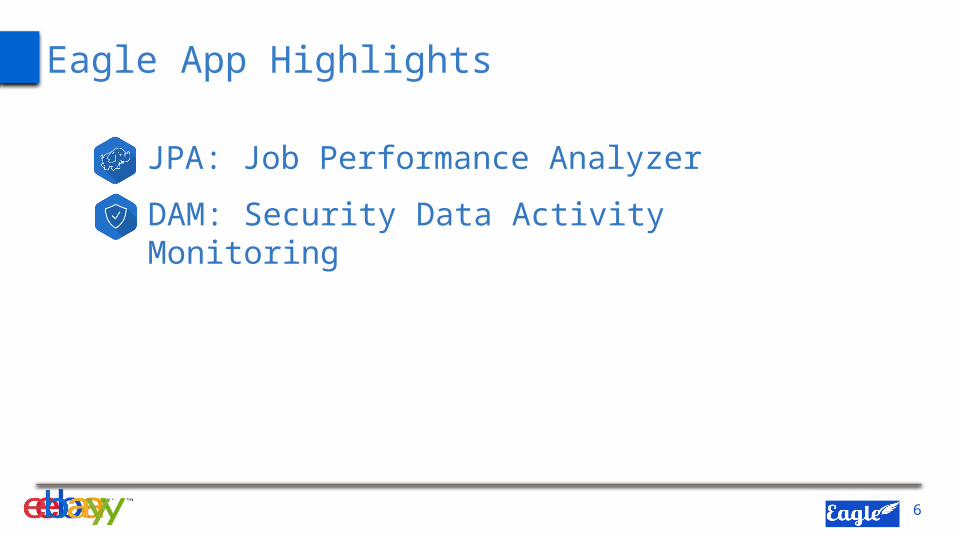
Eagle App Highlights
JPA: Job Performance Analyzer
DAM: Security Data Activity Monitoring
7
JPA: Job Performance Analyzer
Historical job analysisRunning job analysisAnomaly host detectionJob data skew detectionJob performance suggestionAnomaly Prediction based on machine learning
Monitor and analyze job performance in real-time
8
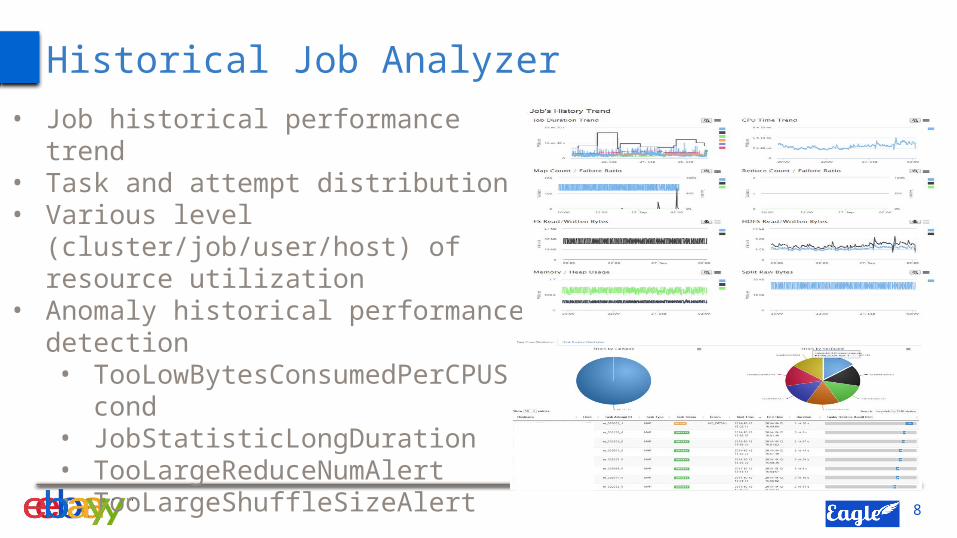
Historical Job Analyzer• Job historical performance trend• Task and attempt distribution• Various level (cluster/job/user/host) of
resource utilization• Anomaly historical performance detection
• TooLowBytesConsumedPerCPUSecond• JobStatisticLongDuration• TooLargeReduceNumAlert• TooLargeShuffleSizeAlert
9
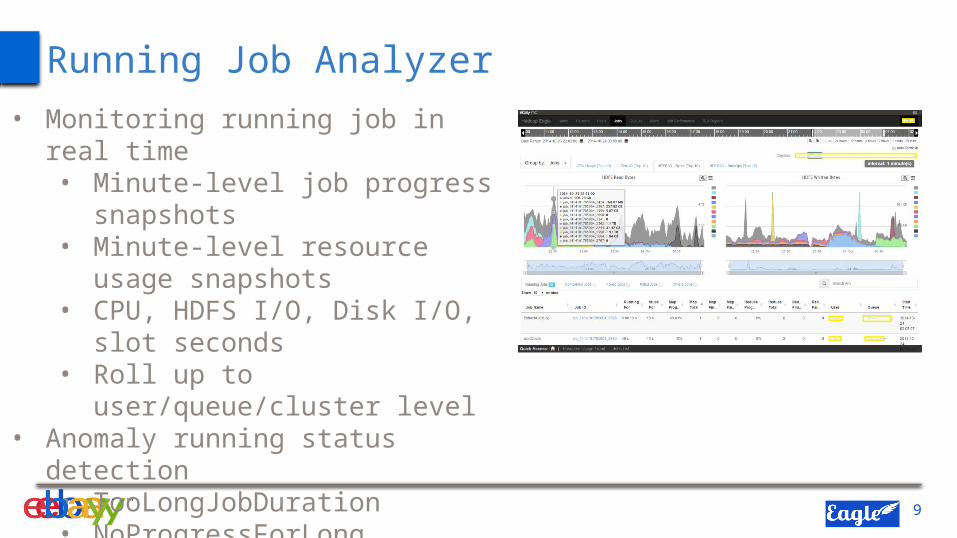
Running Job Analyzer• Monitoring running job in real time
• Minute-level job progress snapshots• Minute-level resource usage
snapshots• CPU, HDFS I/O, Disk I/O, slot seconds• Roll up to user/queue/cluster level
• Anomaly running status detection• TooLongJobDuration• NoProgressForLong• TooManyTaskFailure
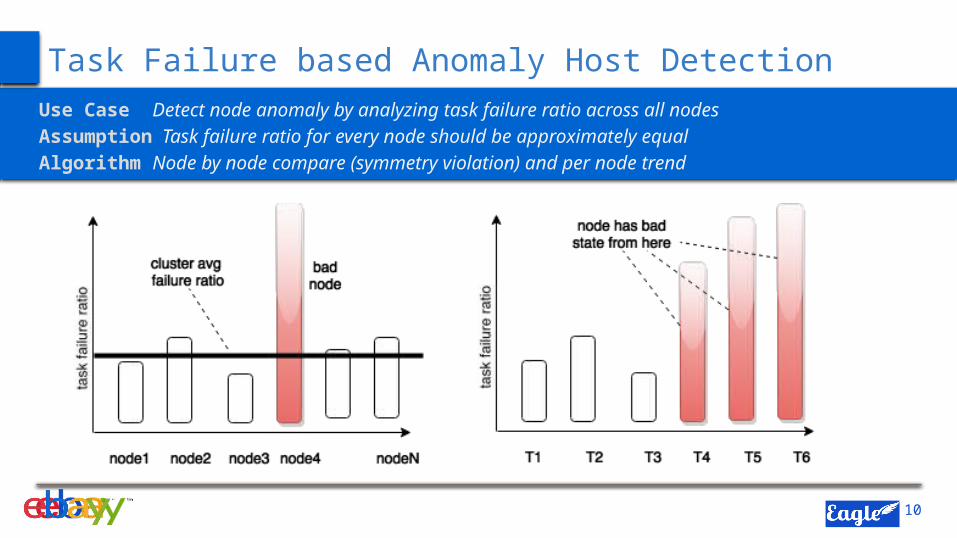
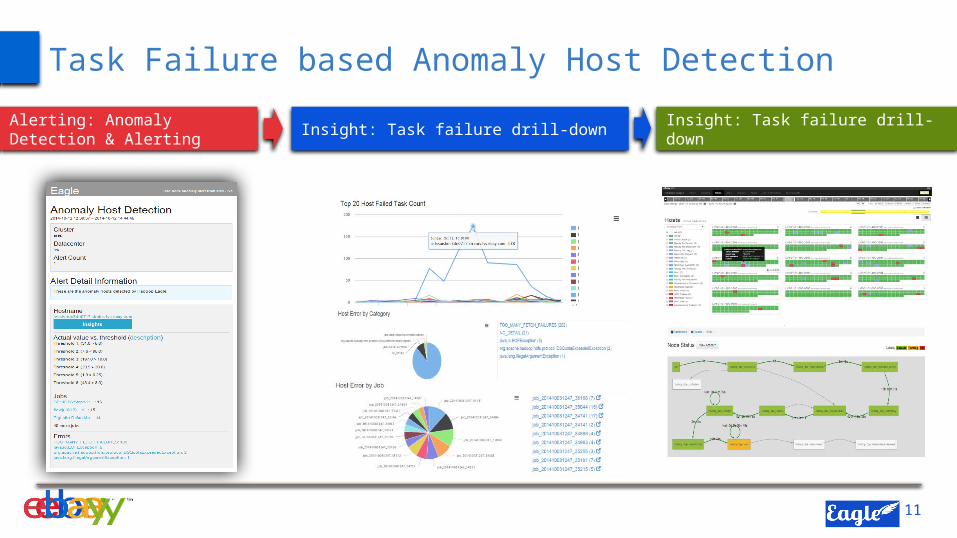
Use Case Detect node anomaly by analyzing task failure ratio across all nodesAssumption Task failure ratio for every node should be approximately equalAlgorithm Node by node compare (symmetry violation) and per node trend
10
Task Failure based Anomaly Host Detection
11
Task Failure based Anomaly Host Detection
Alerting: Anomaly Detection & Alerting
Insight: Task failure drill-down Insight: Task failure drill-down
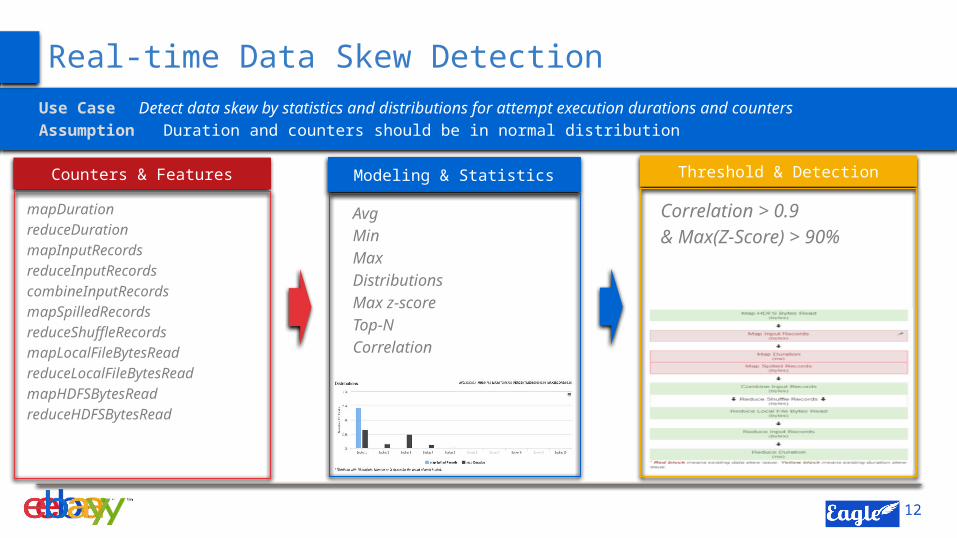
Counters & Features
Use Case Detect data skew by statistics and distributions for attempt execution durations and counters
Assumption Duration and counters should be in normal distribution
12
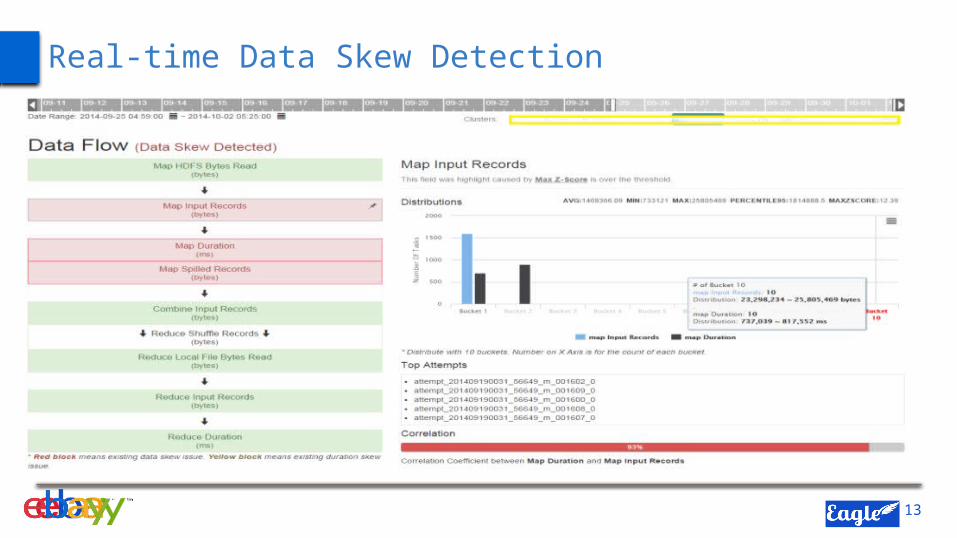
Real-time Data Skew Detection
mapDuration
reduceDuration
mapInputRecords
reduceInputRecords
combineInputRecords
mapSpilledRecords
reduceShuffleRecords
mapLocalFileBytesRead
reduceLocalFileBytesRead
mapHDFSBytesRead
reduceHDFSBytesRead
Modeling & Statistics
Avg
Min
Max
Distributions
Max z-score
Top-N
Correlation
Threshold & Detection
Counters
Correlation > 0.9
& Max(Z-Score) > 90%
13
Real-time Data Skew Detection
14
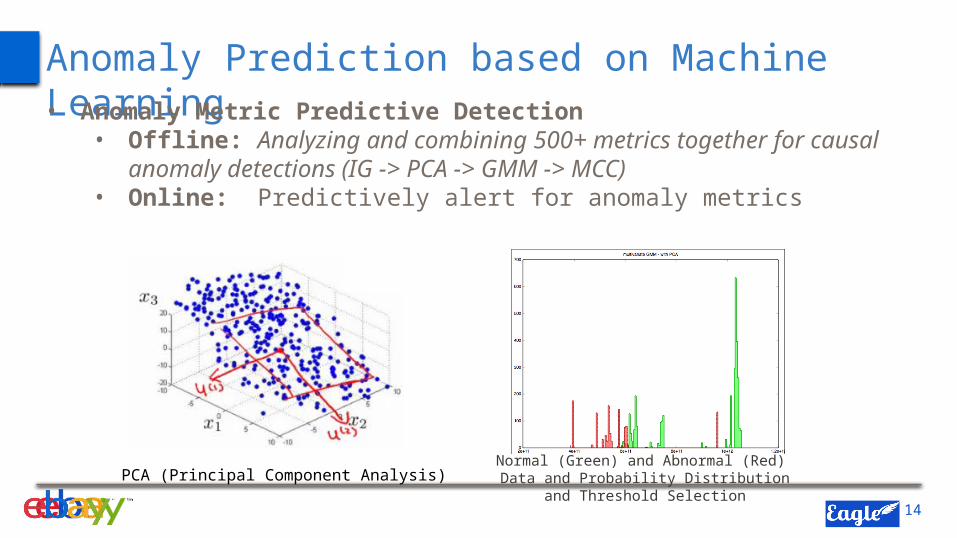
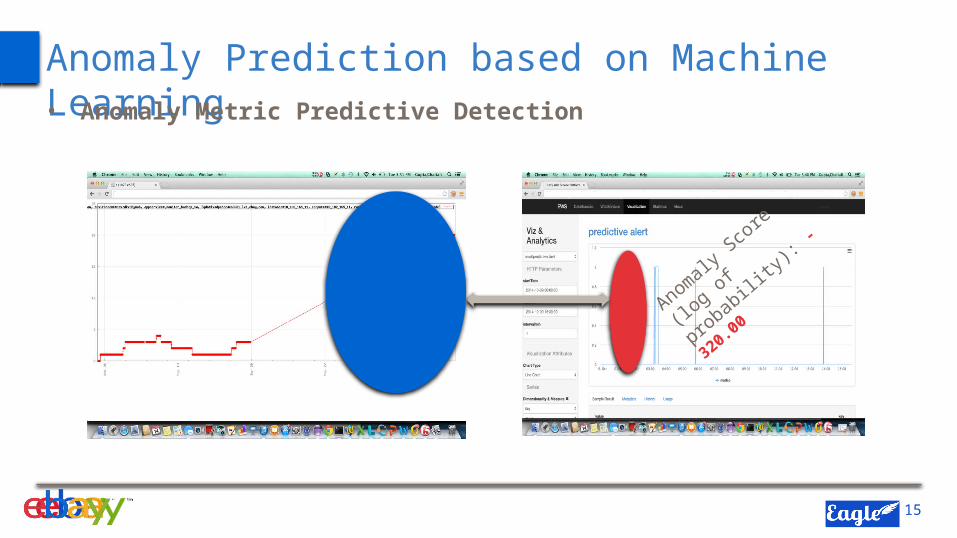
Anomaly Prediction based on Machine Learning• Anomaly Metric Predictive Detection
• Offline: Analyzing and combining 500+ metrics together for causal anomaly detections (IG -> PCA -> GMM -> MCC)
• Online: Predictively alert for anomaly metrics
Normal (Green) and Abnormal (Red) Data and Probability Distribution and Threshold
SelectionPCA (Principal Component Analysis)
15
Anomaly Prediction based on Machine Learning• Anomaly Metric Predictive Detection
Influencer:
hadoop.namenode.Miss
ingBlocks
Anomaly Score (lo
g of
probability): -
320.00
16
DAM: Data Activity Monitoring
Secure hadoop in real-time
Security Use CasesSecurity Architecture OverviewSecurity Components HighlightsSecurity Machine Learning Integration
17
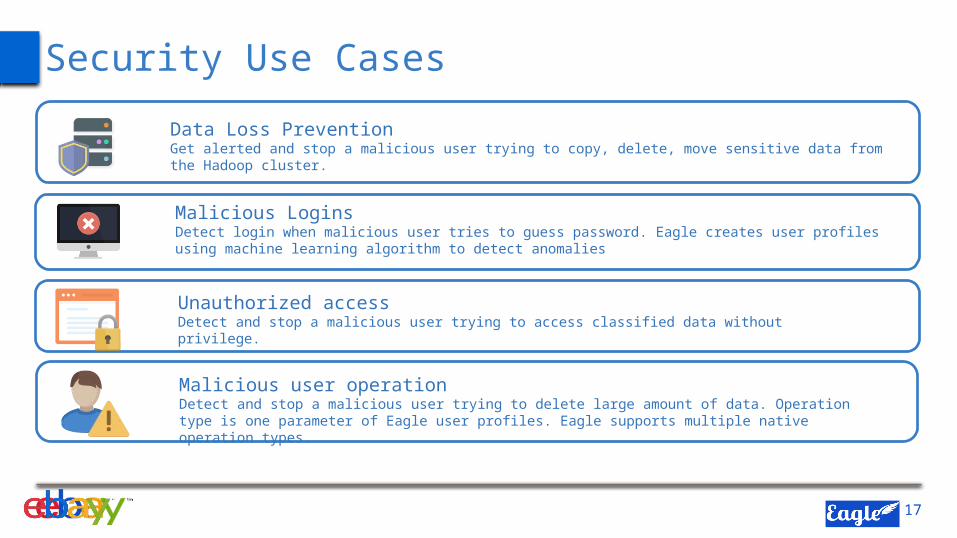
Security Use Cases
Data Loss PreventionGet alerted and stop a malicious user trying to copy, delete, move sensitive data from the Hadoop cluster.
Malicious LoginsDetect login when malicious user tries to guess password. Eagle creates user profiles using machine learning algorithm to detect anomalies
Unauthorized accessDetect and stop a malicious user trying to access classified data without privilege.
Malicious user operationDetect and stop a malicious user trying to delete large amount of data. Operation type is one parameter of Eagle user profiles. Eagle supports multiple native operation types.
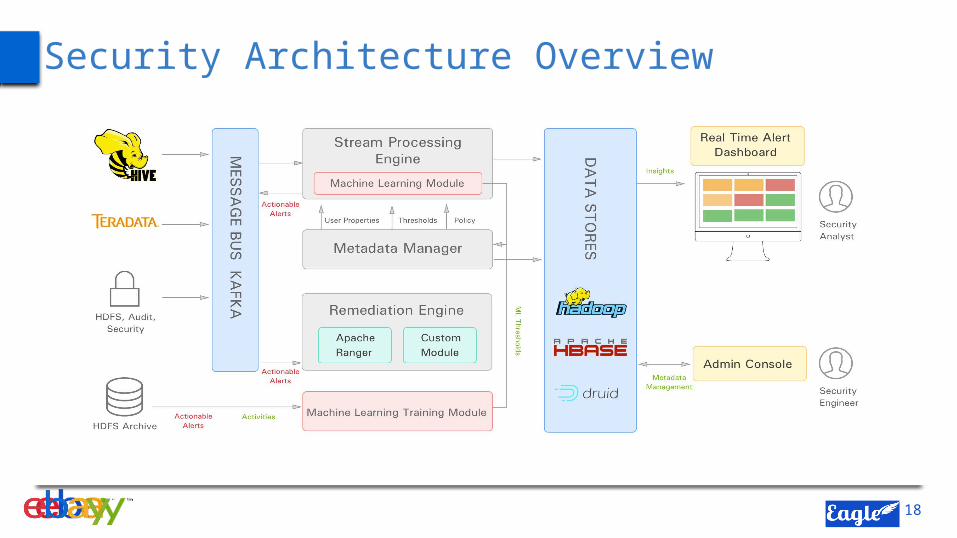
Security Architecture Overview
18
19
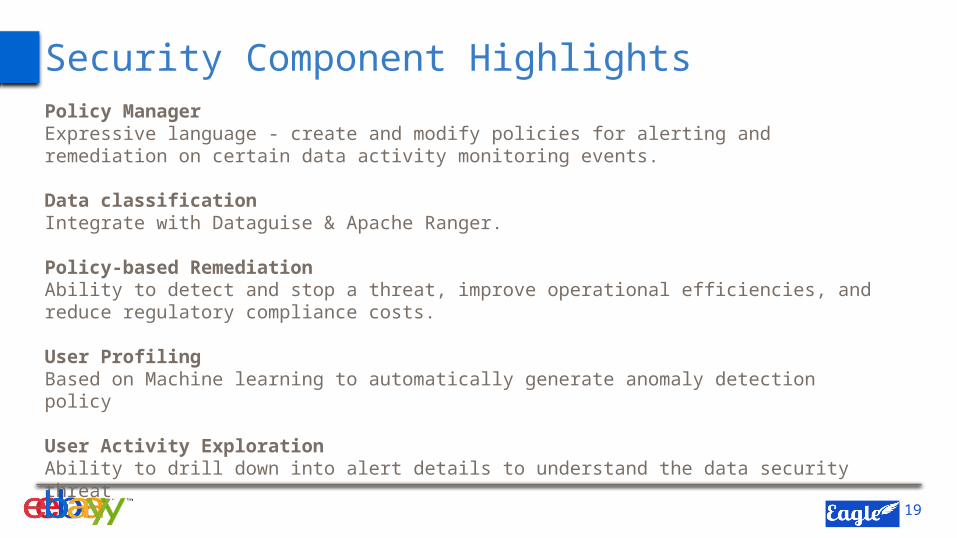
Security Component HighlightsPolicy ManagerExpressive language - create and modify policies for alerting and remediation on certain data activity monitoring events.
Data classificationIntegrate with Dataguise & Apache Ranger.
Policy-based RemediationAbility to detect and stop a threat, improve operational efficiencies, and reduce regulatory compliance costs.
User ProfilingBased on Machine learning to automatically generate anomaly detection policy
User Activity ExplorationAbility to drill down into alert details to understand the data security threat
20
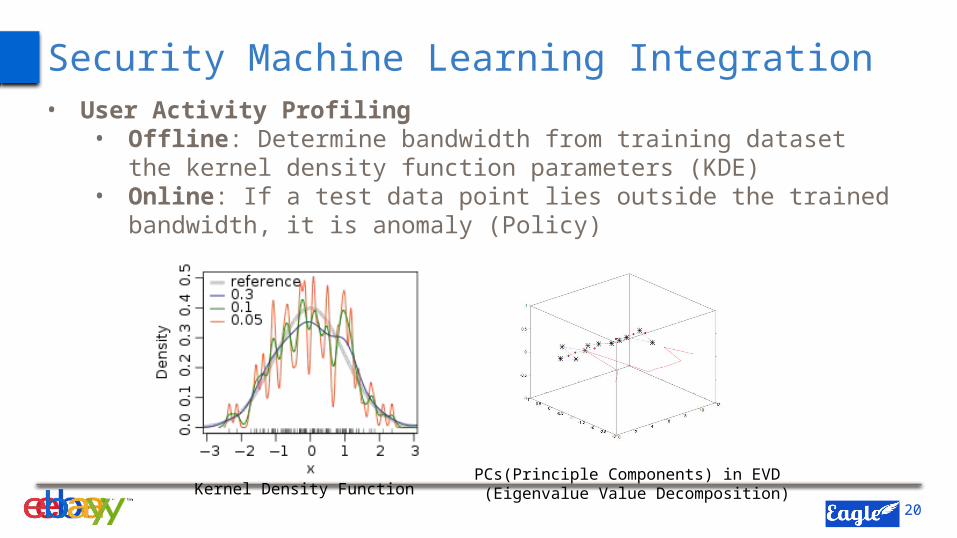
Security Machine Learning Integration• User Activity Profiling
• Offline: Determine bandwidth from training dataset the kernel density function parameters (KDE)
• Online: If a test data point lies outside the trained bandwidth, it is anomaly (Policy)
PCs(Principle Components) in EVD (Eigenvalue Value Decomposition)Kernel Density Function
21
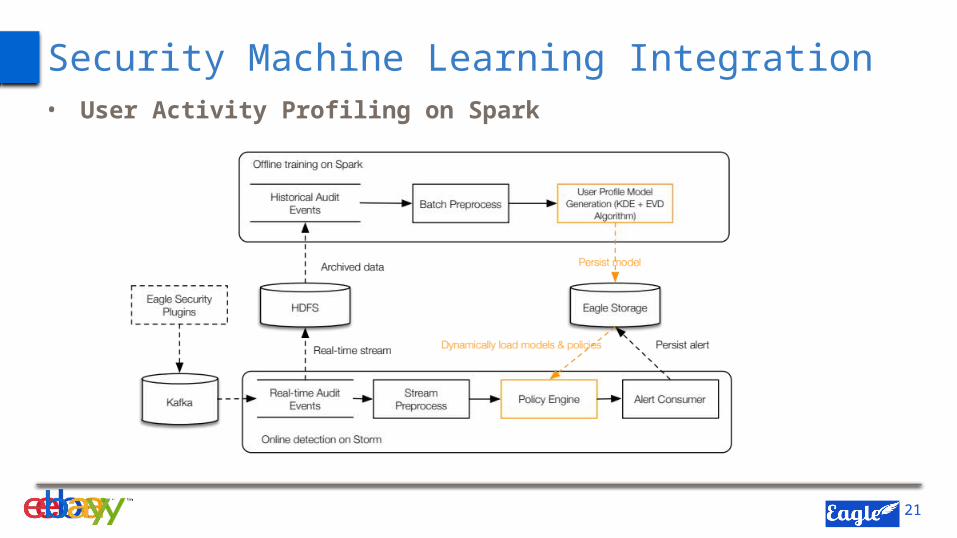
Security Machine Learning Integration• User Activity Profiling on Spark
Eagle Monitoring Framework
22
Eagle = Eagle Framework + Eagle Apps
Full-stack real time monitoring framework
23
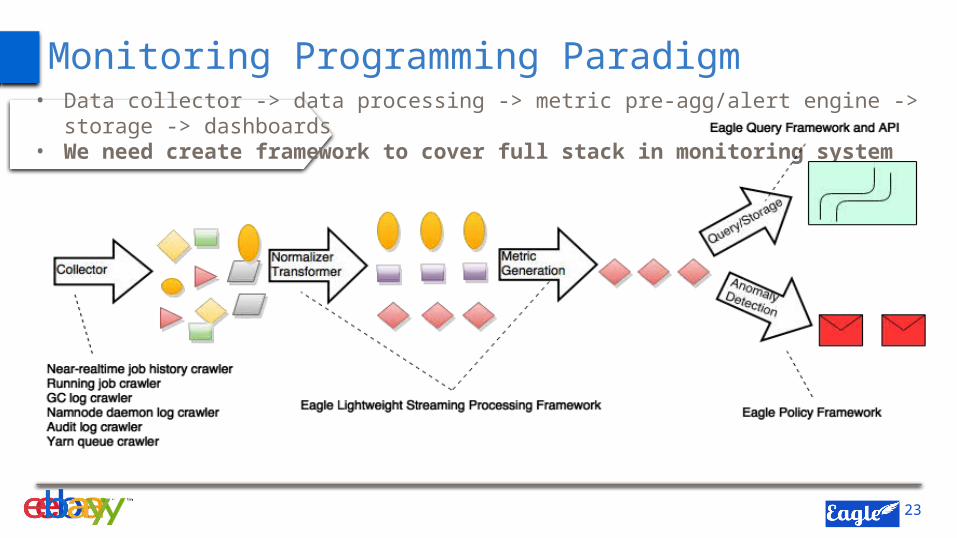
• Data collector -> data processing -> metric pre-agg/alert engine -> storage -> dashboards• We need create framework to cover full stack in monitoring system
Monitoring Programming Paradigm
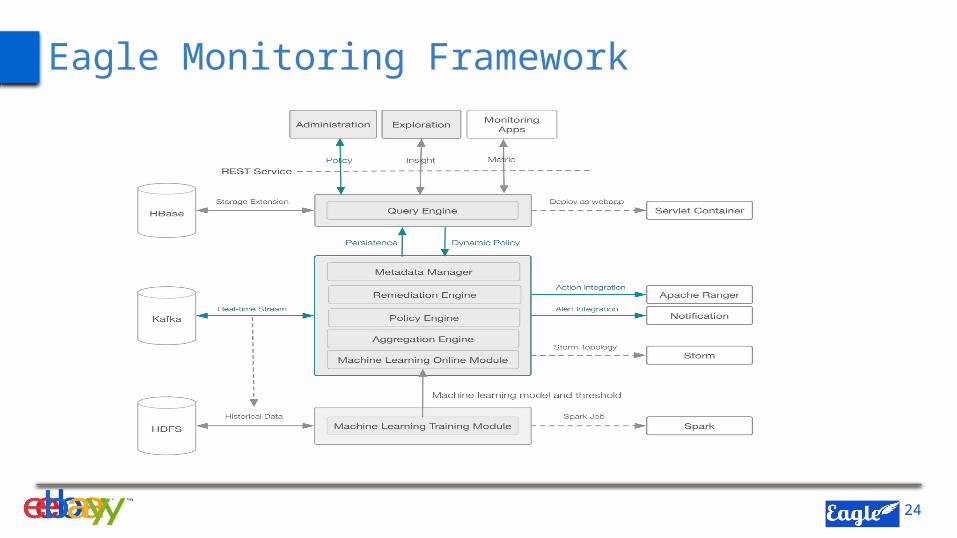
Eagle Monitoring Framework
24
Eagle Monitoring Framework Highlights
25
Eagle = Eagle Framework + Eagle AppsLightweight Streaming Process FrameworkExtensible & Scalable Policy FrameworkEagle Query FrameworkCustomizable Dashboards
26
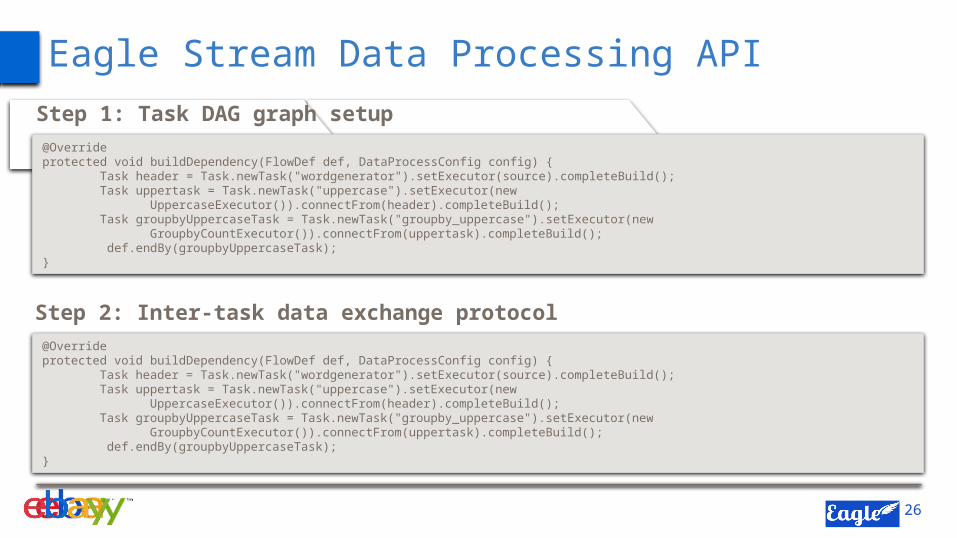
Step 1: Task DAG graph setup
Eagle Stream Data Processing API
@Overrideprotected void buildDependency(FlowDef def, DataProcessConfig config) { Task header = Task.newTask("wordgenerator").setExecutor(source).completeBuild(); Task uppertask = Task.newTask("uppercase").setExecutor(new UppercaseExecutor()).connectFrom(header).completeBuild(); Task groupbyUppercaseTask = Task.newTask("groupby_uppercase").setExecutor(new GroupbyCountExecutor()).connectFrom(uppertask).completeBuild(); def.endBy(groupbyUppercaseTask); }
Step 2: Inter-task data exchange protocol@Overrideprotected void buildDependency(FlowDef def, DataProcessConfig config) { Task header = Task.newTask("wordgenerator").setExecutor(source).completeBuild(); Task uppertask = Task.newTask("uppercase").setExecutor(new UppercaseExecutor()).connectFrom(header).completeBuild(); Task groupbyUppercaseTask = Task.newTask("groupby_uppercase").setExecutor(new GroupbyCountExecutor()).connectFrom(uppertask).completeBuild(); def.endBy(groupbyUppercaseTask); }
27
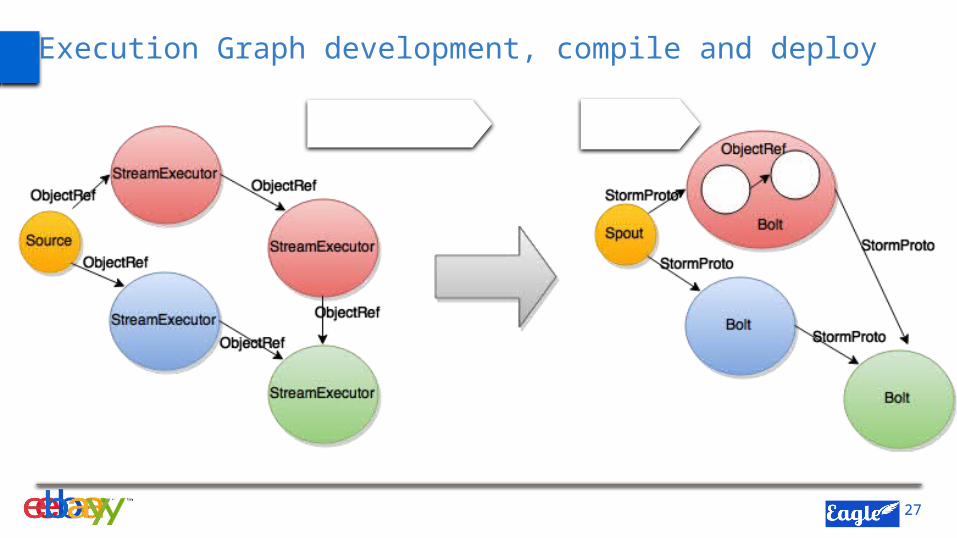
Execution Graph development, compile and deploy
Development / Compile Phase
Deployment / Runtime Phase
28
Extensible & Scalable Policy Framework
Usability• Declarative Policy Definition Syntax• Stream Metadata (event attribute name, attribute type, attribute value resolver, …)
Scalability• Dynamic policy partitioning across compute nodes based on configurable partition class• Dynamic policy deployment• Event partitioning by storm and policy partitioning by Eagle (N events * M policies)
Extensibility• Support new policy evaluation engine, for example Siddhi, Esper, Machine learning etc.
29
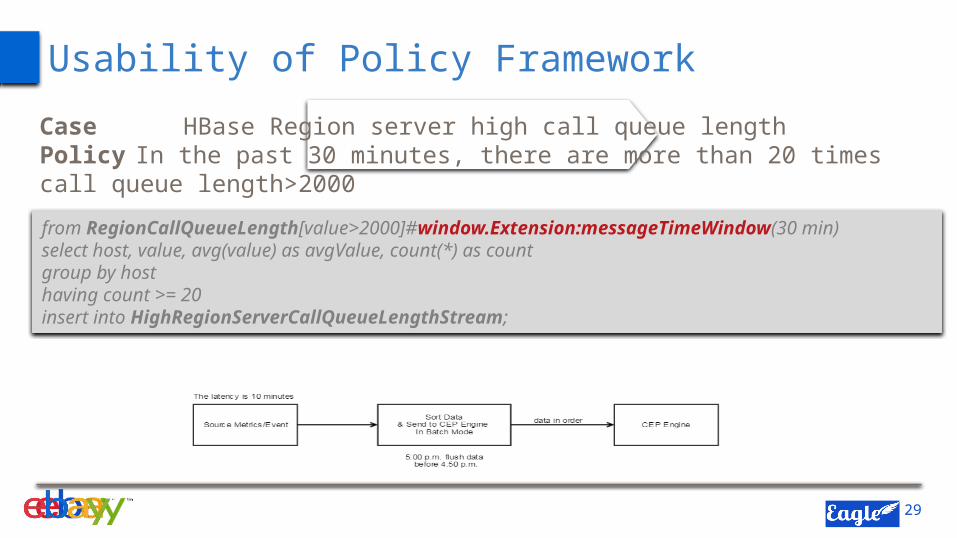
Usability of Policy Framework
Case HBase Region server high call queue length Policy In the past 30 minutes, there are more than 20 times call queue length>2000
from RegionCallQueueLength[value>2000]#window.Extension:messageTimeWindow(30 min) select host, value, avg(value) as avgValue, count(*) as count group by host having count >= 20 insert into HighRegionServerCallQueueLengthStream;
30
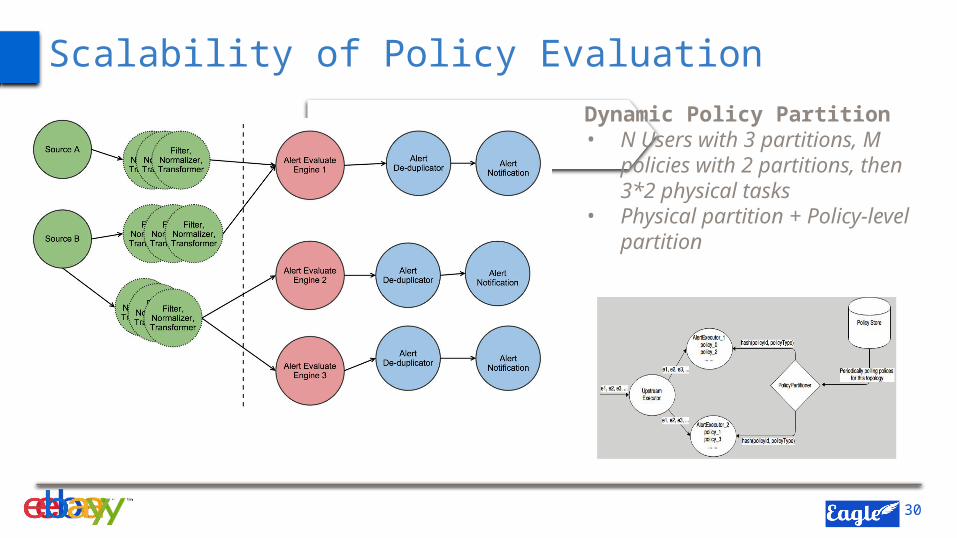
Scalability of Policy EvaluationDynamic Policy Partition• N Users with 3 partitions, M
policies with 2 partitions, then 3*2 physical tasks
• Physical partition + Policy-level partition
31
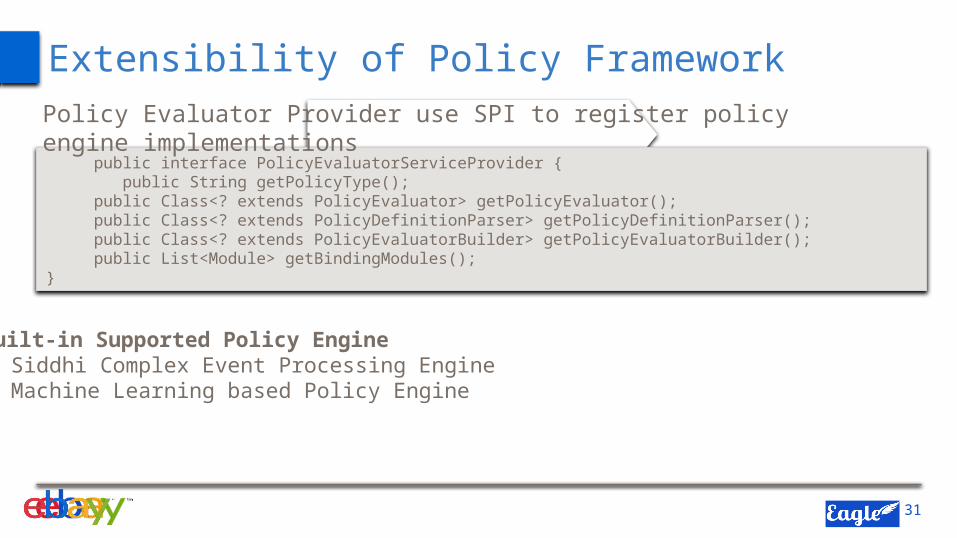
Extensibility of Policy Framework
public interface PolicyEvaluatorServiceProvider { public String getPolicyType();
public Class<? extends PolicyEvaluator> getPolicyEvaluator();public Class<? extends PolicyDefinitionParser> getPolicyDefinitionParser();public Class<? extends PolicyEvaluatorBuilder> getPolicyEvaluatorBuilder();public List<Module> getBindingModules();
}
Policy Evaluator Provider use SPI to register policy engine implementations
Built-in Supported Policy Engine• Siddhi Complex Event Processing Engine• Machine Learning based Policy Engine
Eagle Query Framework
32
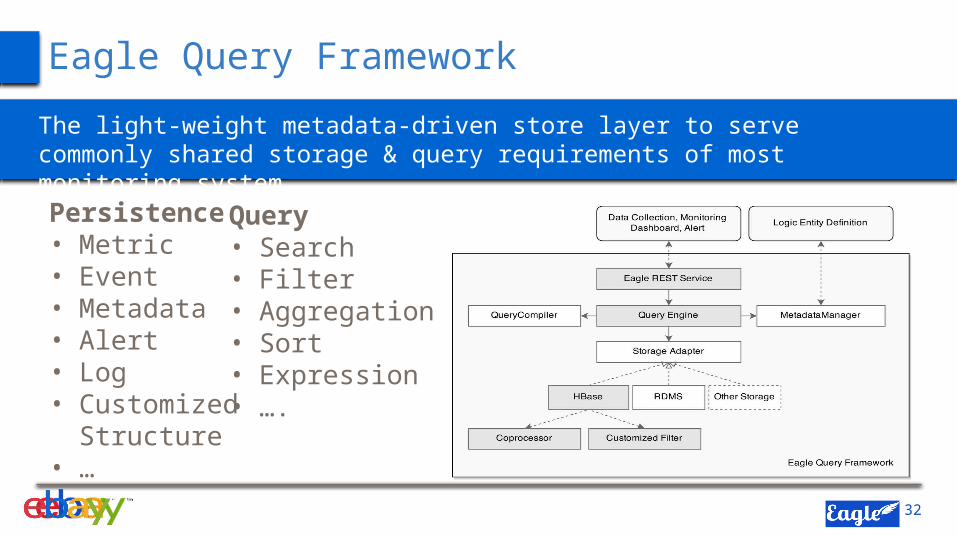
Persistence• Metric• Event• Metadata• Alert• Log• Customized
Structure• …
Query• Search• Filter• Aggregation• Sort• Expression • ….
The light-weight metadata-driven store layer to servecommonly shared storage & query requirements of most monitoring system
33
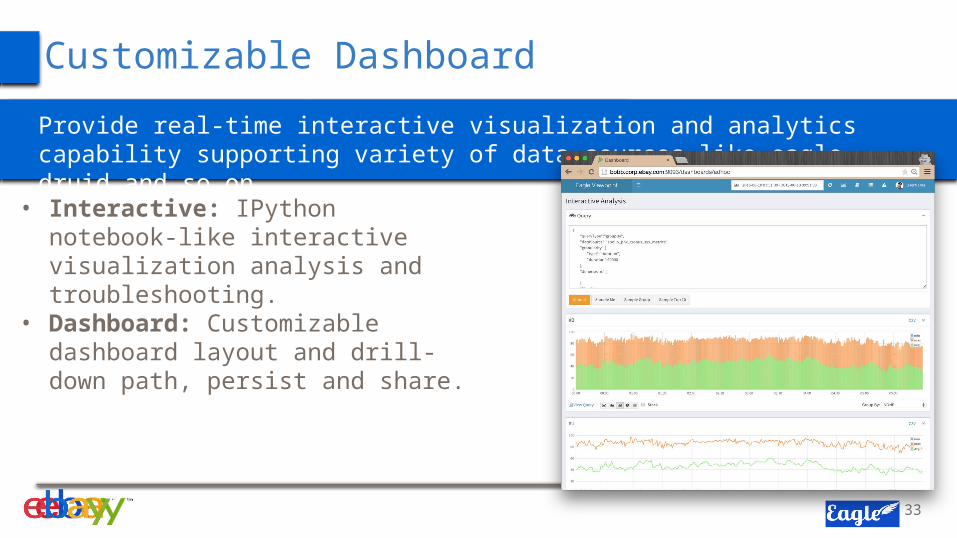
• Interactive: IPython notebook-like interactive visualization analysis and troubleshooting.
• Dashboard: Customizable dashboard layout and drill-down path, persist and share.
Customizable Dashboard
Provide real-time interactive visualization and analytics capability supporting variety of data sources like eagle, druid and so on.
34
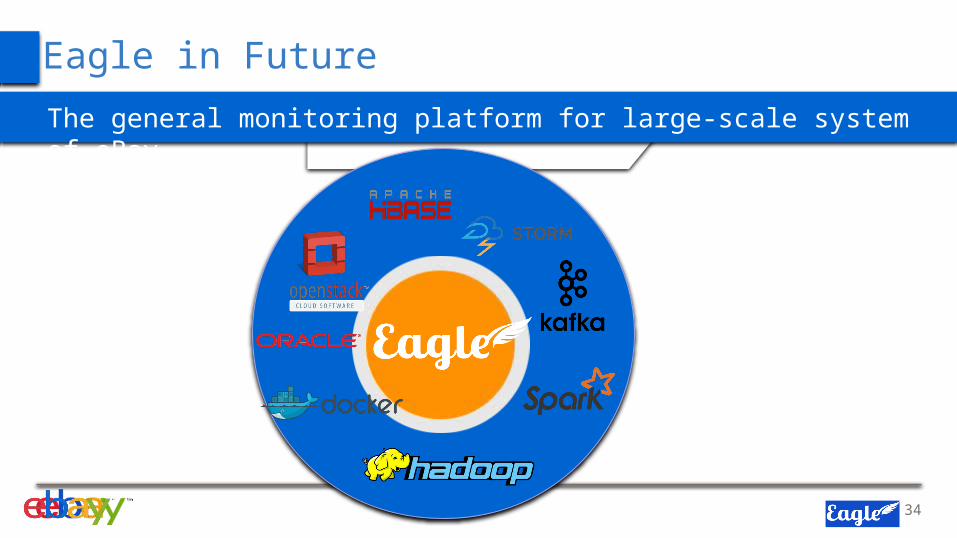
Eagle in Future
The general monitoring platform for large-scale system of eBay
35
Open Source
First Use CaseEagle to secure Hadoop in real time based on Eagle framework
External PartnersHortonworks, Dataguise, Paypal and Apache Ranger
Following Components to Open SourceJPA (“Job Performance Analyzer”), HBase and GC Monitoring and so on
is opening source soon
36
Reference
Eagle at Hadoop Summit 2015, San Josehttp://2015.hadoopsummit.orgSlides | Video
Eagle at Big Data Summit 2014, Shanghaihttp://2014ebay.csdn.net/m/zone/ebay_enSlides | Video

37
The End & Thanks
If you want to go fast, go alone.If you want to go far, go together.
-- African Proverb
Hao Chen
[email protected] | @haozch