Embed Size (px)
Citation preview
Conclusions
Abstract
Materials and MethodsIPA 7.5 software platform was used to perform all data uploads and in silico analyses.
Where applicable, publicly available data sets from the referenced articles were
uploaded into IPA, and analyzed. Fold change of 1.5 of treated-to-control experiments
and p<0.05 cutoffs were used where applicable to analyze the data. Ingenuity
Knowledge base was used as a reference set. Only direct interactions were included
where downstream molecules were analyzed.
References and Acknowledgements1. “Potential Ebola Therapies from Phenotypic screening,”
,
Feb 2008, ASM poster
2. “Genome-wide identification of estrogen receptor alpha-binding sites in mouse
liver,” Gao H, Falt S, Sandelin A, Gustafsson JA, Fahlman-Wright K, Mol
Endocrinol. 2008 Jan;22(1):10-22
3. “
”
4. “
,”
The authors would like to thank Dr. Chan Whiting, Dr. Dan Richards and Dr. Megan
Laurance for their valuable contributions, and to acknowledge that the datasets used in
this poster are publically available and are obtainable from the reference cited here in
this poster.
Results
Antoaneta Vladimirova1, Gene Olinger2
1Ingenuity Systems, Redwood City, CA and 2USAMRIID, Ft. Detrick, MD
Figure 2. Top Impacted Pathways and Functions by Genes with ER-alpha binding Sites in
Mouse Liver. A.) Top Clomiphene-impacted pathways in Pathogen-influenced signaling, Humoral
and Cellular Immune Response and Cytokine Signaling categories B.) Top significantly impacted
functions and genes involved. C.) Detailed view of specific functions, genes and the corresponding
p-values involved in impacted T lymphocyte response. Blue bars indicate significance. Orange line
indicates ratio.
In Silico
Figure 3. Clomiphene Gene Expression Data in Rat Liver Reveals Key Modes of Drug-induced
Protective Immune Responses. A) Top Impacted Signaling Pathways in Pathogen-influenced
signaling, Humoral and Cellular Immune Response and Cytokine Signaling categories B.) The
expression levels of the genes that were measured in this dataset are indicated near their respective
nodes. B) Il-10 Signaling pathway with Clomiphene 5 day expression data overlay. The expression
bar charts next to each gene show expression in 1d and 3d experiments as well. Up-regulated genes
are depicted in red and down-regulated – in green color. C) Selected significantly impacted functional
categories, functional annotations, p-values and respective genes that are impacted by Clomiphene
5d. D.) Processes consistently increased by gene expression by Clomiphene 5d and their
corresponding p-values and genes. E.) Top Induced molecules by Clomiphene along with bar chart
showing expression for all three doses. F.) Key impacted pathways by top induced molecules by
Clomiphene 5d and the directly-interacting molecules downstream of them.
A.
Figure 4. Gene expression data from Ebola-infected non-human primate PBMCs were
compared to Clomiphene-expressed genes in rat liver to identify key impacted pathways
significantly modulated by both treatments. A.) Top impacted pathways by both Ebola and
Clomiphene. Blue bars indicate significance. Orange line indicates ratio. B.) IL-10 Signaling with
expression data overlaid from Ebola-infected NHP PBMCs. Up-regulated genes are depicted in red
and down-regulated – in green color.
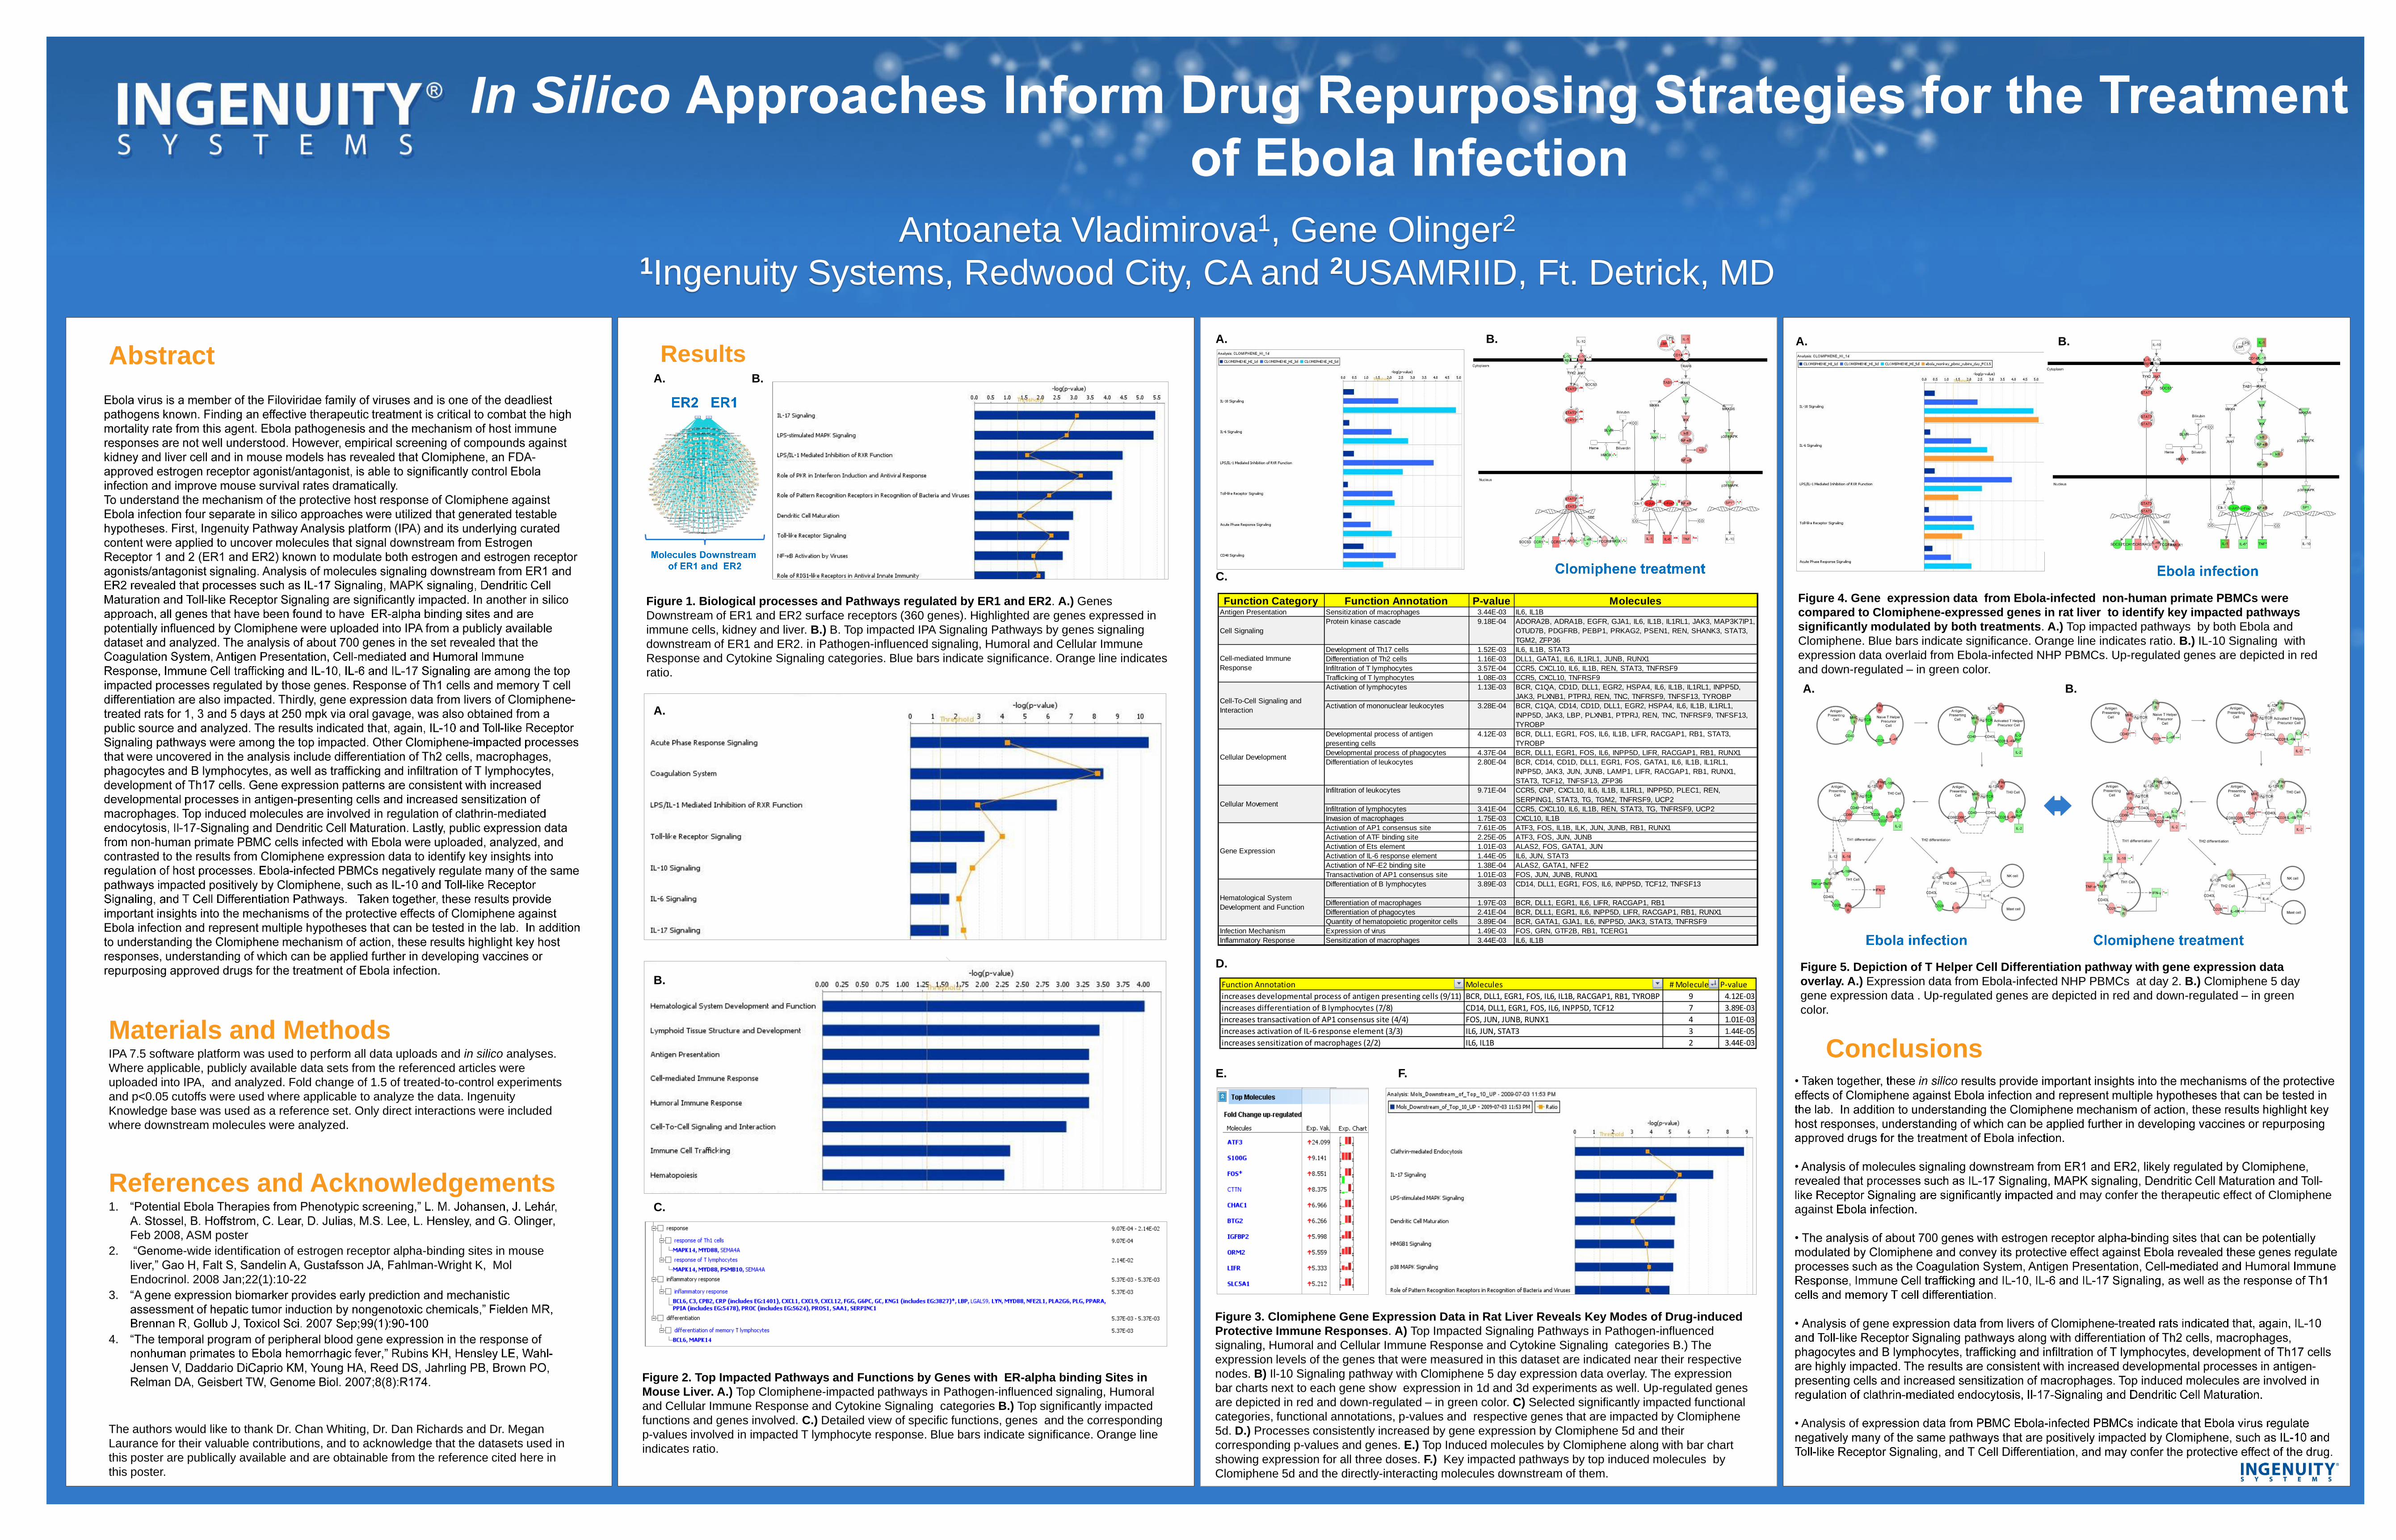
Figure 1. Biological processes and Pathways regulated by ER1 and ER2. A.) Genes
Downstream of ER1 and ER2 surface receptors (360 genes). Highlighted are genes expressed in
immune cells, kidney and liver. B.) B. Top impacted IPA Signaling Pathways by genes signaling
downstream of ER1 and ER2. in Pathogen-influenced signaling, Humoral and Cellular Immune
Response and Cytokine Signaling categories. Blue bars indicate significance. Orange line indicates
ratio.
A. B.
B.
B.
A.
C.
Function Annotation Molecules # Molecules P-value
increases developmental process of antigen presenting cells (9/11) BCR, DLL1, EGR1, FOS, IL6, IL1B, RACGAP1, RB1, TYROBP 9 4.12E-03
increases differentiation of B lymphocytes (7/8) CD14, DLL1, EGR1, FOS, IL6, INPP5D, TCF12 7 3.89E-03
increases transactivation of AP1 consensus site (4/4) FOS, JUN, JUNB, RUNX1 4 1.01E-03
increases activation of IL-6 response element (3/3) IL6, JUN, STAT3 3 1.44E-05
increases sensitization of macrophages (2/2) IL6, IL1B 2 3.44E-03
Figure 5. Depiction of T Helper Cell Differentiation pathway with gene expression data
overlay. A.) Expression data from Ebola-infected NHP PBMCs at day 2. B.) Clomiphene 5 day
gene expression data . Up-regulated genes are depicted in red and down-regulated – in green
color.
C.
D.
E. F.
A. B.
A. B.
B.
•
•
and may confer the therapeutic effect of Clomiphene
against
•
•
• Analysis of
Function Category Function Annotation P-value MoleculesAntigen Presentation Sensitization of macrophages 3.44E-03 IL6, IL1B
Cell Signaling
Protein kinase cascade 9.18E-04 ADORA2B, ADRA1B, EGFR, GJA1, IL6, IL1B, IL1RL1, JAK3, MAP3K7IP1,
OTUD7B, PDGFRB, PEBP1, PRKAG2, PSEN1, REN, SHANK3, STAT3,
TGM2, ZFP36
Development of Th17 cells 1.52E-03 IL6, IL1B, STAT3
Differentiation of Th2 cells 1.16E-03 DLL1, GATA1, IL6, IL1RL1, JUNB, RUNX1
Infiltration of T lymphocytes 3.57E-04 CCR5, CXCL10, IL6, IL1B, REN, STAT3, TNFRSF9
Trafficking of T lymphocytes 1.08E-03 CCR5, CXCL10, TNFRSF9
Activation of lymphocytes 1.13E-03 BCR, C1QA, CD1D, DLL1, EGR2, HSPA4, IL6, IL1B, IL1RL1, INPP5D,
JAK3, PLXNB1, PTPRJ, REN, TNC, TNFRSF9, TNFSF13, TYROBP
Activation of mononuclear leukocytes 3.28E-04 BCR, C1QA, CD14, CD1D, DLL1, EGR2, HSPA4, IL6, IL1B, IL1RL1,
INPP5D, JAK3, LBP, PLXNB1, PTPRJ, REN, TNC, TNFRSF9, TNFSF13,
TYROBP
Developmental process of antigen
presenting cells
4.12E-03 BCR, DLL1, EGR1, FOS, IL6, IL1B, LIFR, RACGAP1, RB1, STAT3,
TYROBP
Developmental process of phagocytes 4.37E-04 BCR, DLL1, EGR1, FOS, IL6, INPP5D, LIFR, RACGAP1, RB1, RUNX1
Differentiation of leukocytes 2.80E-04 BCR, CD14, CD1D, DLL1, EGR1, FOS, GATA1, IL6, IL1B, IL1RL1,
INPP5D, JAK3, JUN, JUNB, LAMP1, LIFR, RACGAP1, RB1, RUNX1,
STAT3, TCF12, TNFSF13, ZFP36
Infiltration of leukocytes 9.71E-04 CCR5, CNP, CXCL10, IL6, IL1B, IL1RL1, INPP5D, PLEC1, REN,
SERPING1, STAT3, TG, TGM2, TNFRSF9, UCP2
Infiltration of lymphocytes 3.41E-04 CCR5, CXCL10, IL6, IL1B, REN, STAT3, TG, TNFRSF9, UCP2
Invasion of macrophages 1.75E-03 CXCL10, IL1B
Activation of AP1 consensus site 7.61E-05 ATF3, FOS, IL1B, ILK, JUN, JUNB, RB1, RUNX1
Activation of ATF binding site 2.25E-05 ATF3, FOS, JUN, JUNB
Activation of Ets element 1.01E-03 ALAS2, FOS, GATA1, JUN
Activation of IL-6 response element 1.44E-05 IL6, JUN, STAT3
Activation of NF-E2 binding site 1.38E-04 ALAS2, GATA1, NFE2
Transactivation of AP1 consensus site 1.01E-03 FOS, JUN, JUNB, RUNX1
Differentiation of B lymphocytes 3.89E-03 CD14, DLL1, EGR1, FOS, IL6, INPP5D, TCF12, TNFSF13
Differentiation of macrophages 1.97E-03 BCR, DLL1, EGR1, IL6, LIFR, RACGAP1, RB1
Differentiation of phagocytes 2.41E-04 BCR, DLL1, EGR1, IL6, INPP5D, LIFR, RACGAP1, RB1, RUNX1
Quantity of hematopoietic progenitor cells 3.89E-04 BCR, GATA1, GJA1, IL6, INPP5D, JAK3, STAT3, TNFRSF9
Infection Mechanism Expression of virus 1.49E-03 FOS, GRN, GTF2B, RB1, TCERG1
Inflammatory Response Sensitization of macrophages 3.44E-03 IL6, IL1B
Cellular Movement
Cellular Development
Gene Expression
Hematological System
Development and Function
Cell-mediated Immune
Response
Cell-To-Cell Signaling and
Interaction


![Biocomputing drug repurposing toward targeted therapies€¦ · integrating drug repositioning. Our recent paper [4] demonstrated that a specific bio-computational approach [5] could](https://img.pdfslide.us/doc/110x75/5f05185d7e708231d4113d14/biocomputing-drug-repurposing-toward-targeted-therapies-integrating-drug-repositioning.jpg)