Embed Size (px)
Citation preview
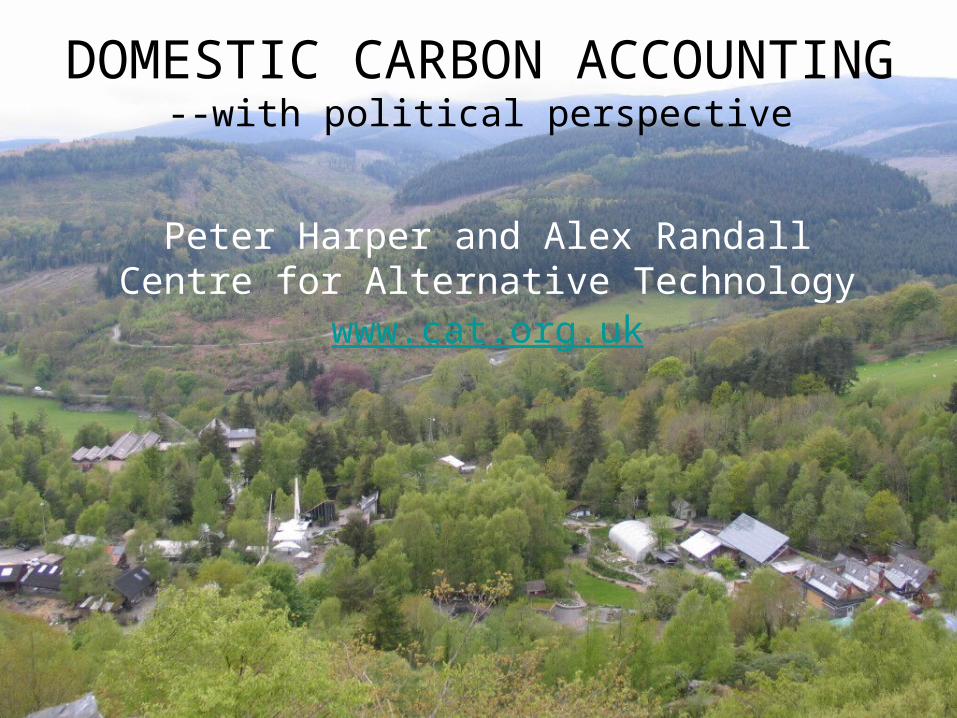
DOMESTIC CARBON ACCOUNTING
--with political perspective
Peter Harper and Alex RandallCentre for Alternative Technology
www.cat.org.uk

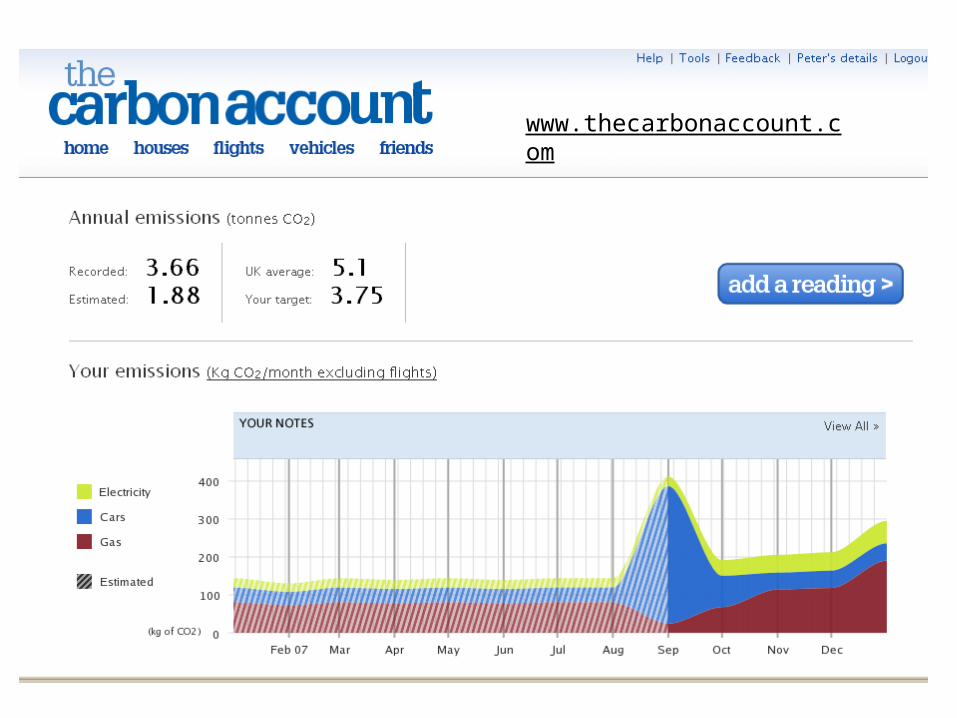
www.thecarbonaccount.com
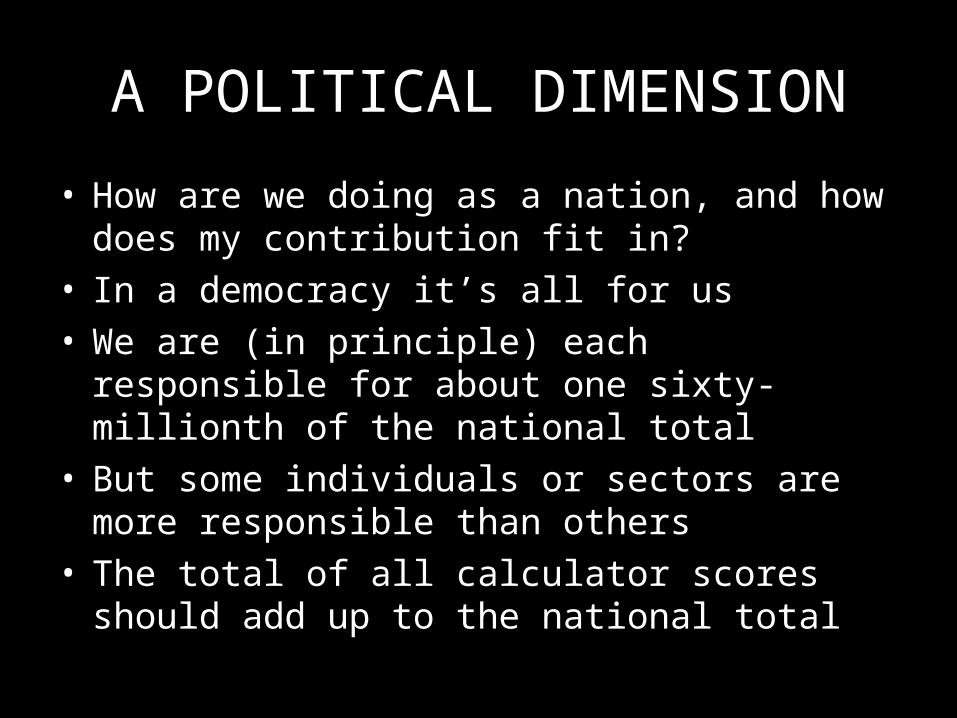
A POLITICAL DIMENSION
• How are we doing as a nation, and how does my contribution fit in?
• In a democracy it’s all for us• We are (in principle) each responsible for
about one sixty-millionth of the national total
• But some individuals or sectors are more responsible than others
• The total of all calculator scores should add up to the national total
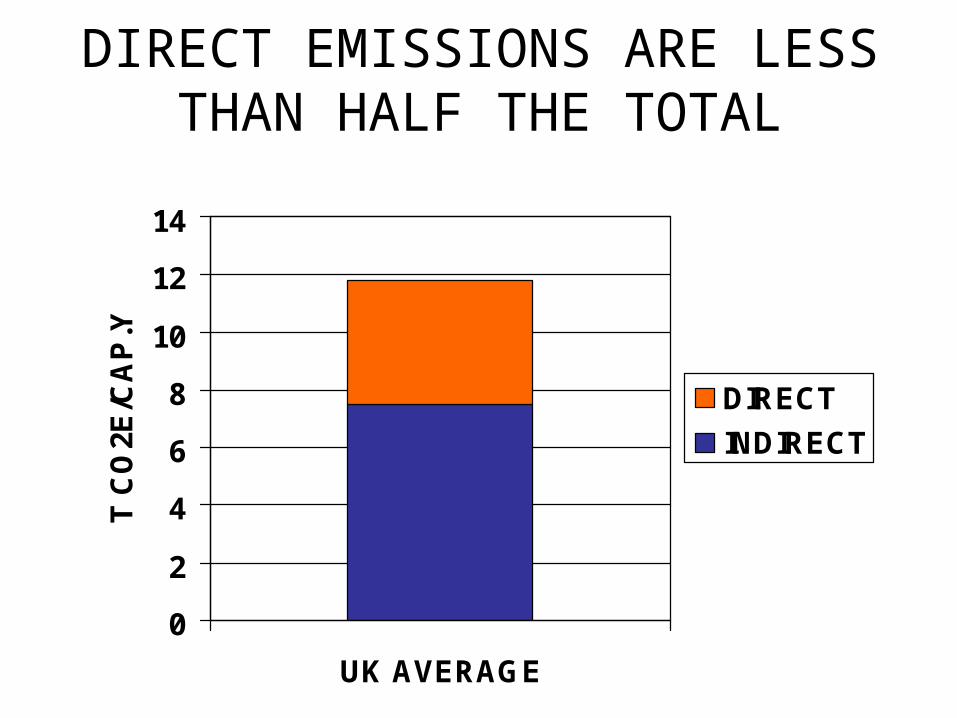
DIRECT EMISSIONS ARE LESS THAN HALF THE TOTAL
0
2
4
6
8
10
12
14
UK AVERAGE
T C
O2E
/CA
P.Y
DIRECT
INDIRECT
02468
101214
UKCCBG
CZCB
UK AVERAG
E
T C
O2E
/CA
P.Y
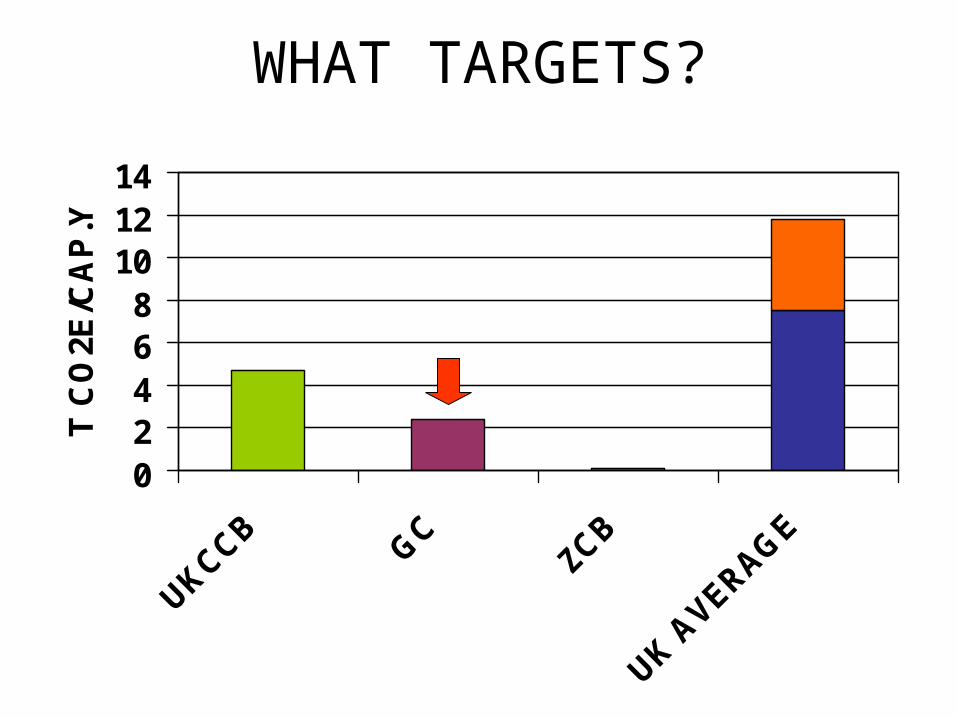
WHAT TARGETS?
0
2
4
6
8
10
12
14
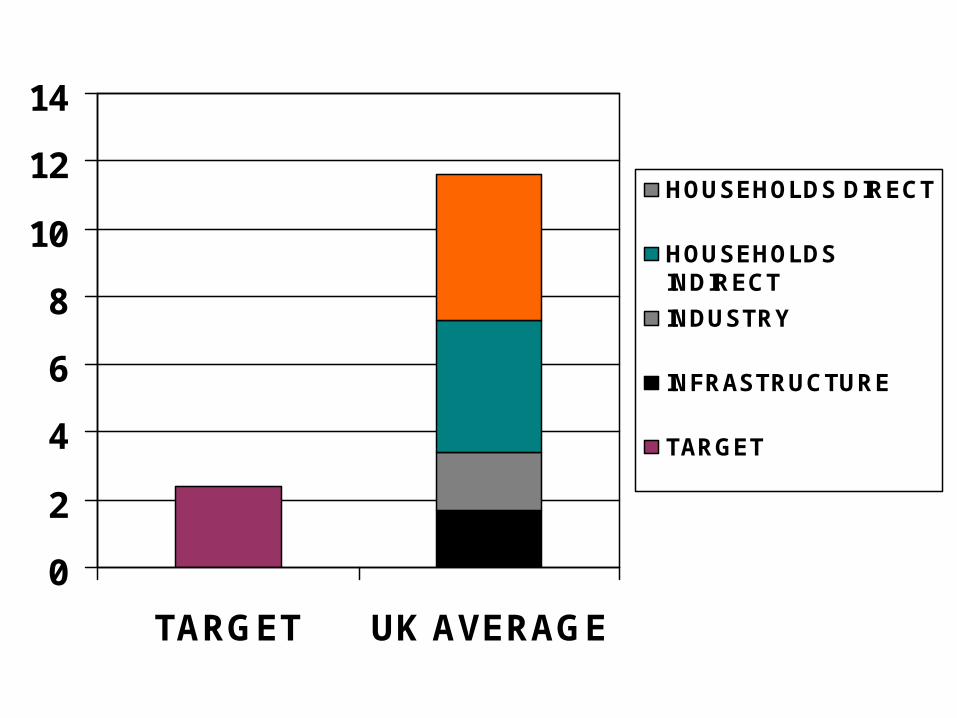
TARGET UK AVERAGE
HOUSEHOLDS DIRECT
HOUSEHOLDSINDIRECT
INDUSTRY
INFRASTRUCTURE
TARGET
Suggests a new, robust, and ‘politically connected’ methodology for personal carbon accounting
• Use national data for emissions under various categories
• Make the default assumption that each individual has an average pro rata share
• Most cases will cluster round the average
• Adjust these default values by coefficients according to personal data
• But use ‘real data’ wherever possible
INDIRECT EMISSIONS
• Are very tricky• The most plausible default assumption is
not equal per capita shares, but emissions ≈ expenditure ≈ income
• This is a highly ‘political’ premise• …that exposes important personal and
policy issues.• But a proportion of responsibility for
indirect emissions can be awarded to :– The government (for infrastructure, fixed per
capita)– The business sector (pro rata, at 30%...or?)
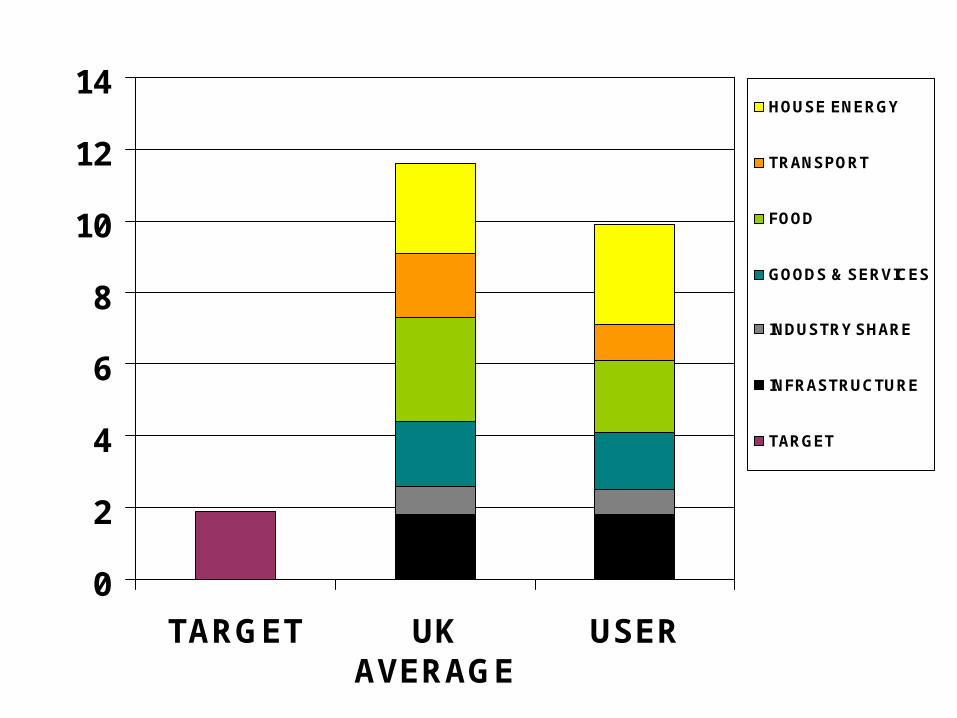
0
2
4
6
8
10
12
14
TARGET UKAVERAGE
USER
HOUSE ENERGY
TRANSPORT
FOOD
GOODS & SERVICES
INDUSTRY SHARE
INFRASTRUCTURE
TARGET
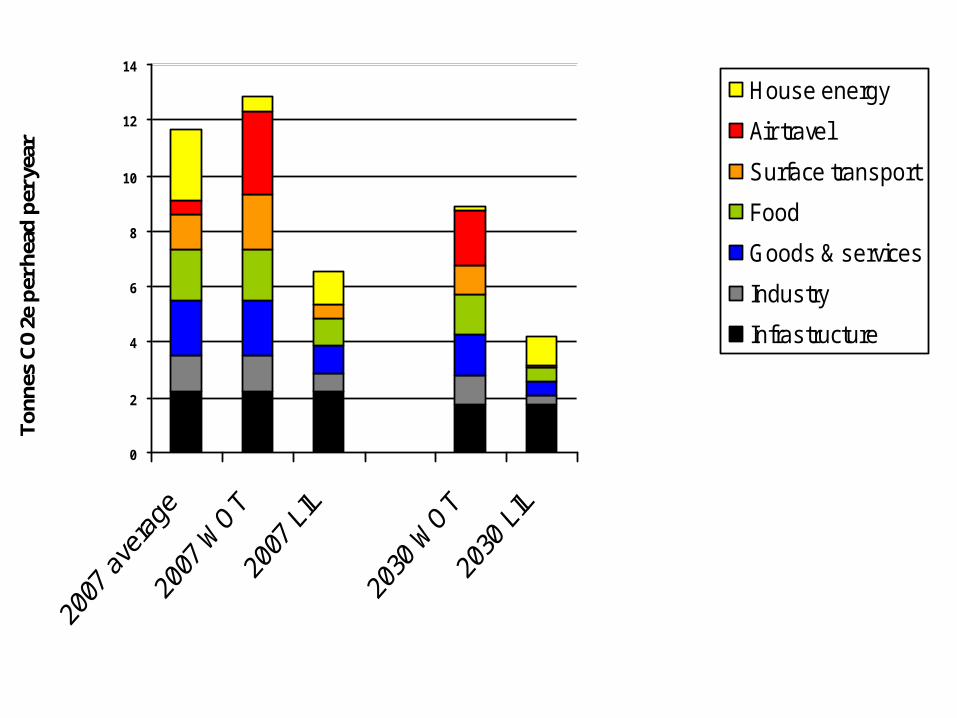
0
2
4
6
8
10
12
14
To
nnes
CO
2e p
er h
ead
per
yea
r
House energy
Air travel
Surface transport
Food
Goods & services
Industry
Infrastructure
INTERPRETATION AND RESPONSES
• Personal behaviour and ‘background decarbonisation’ are seen to be complementary
• You have to choose one or the other, or some combination
• There are plenty of choices, but no escape• Reduce personal
• Greater efficiency• Lower consumption of C-intensive services• Invest in low-C technologies and processes
• Accept implications of top-down measures• High C-prices• Low-C energy systems and infrastructure• Political activity if you want to exert influence
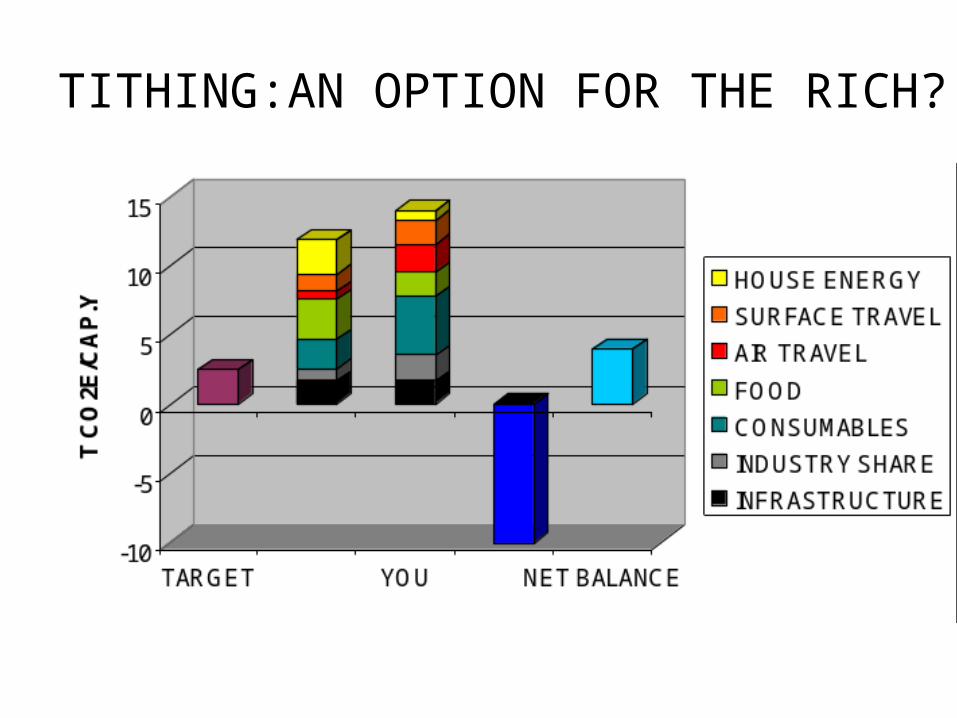
TITHING:AN OPTION FOR THE RICH?
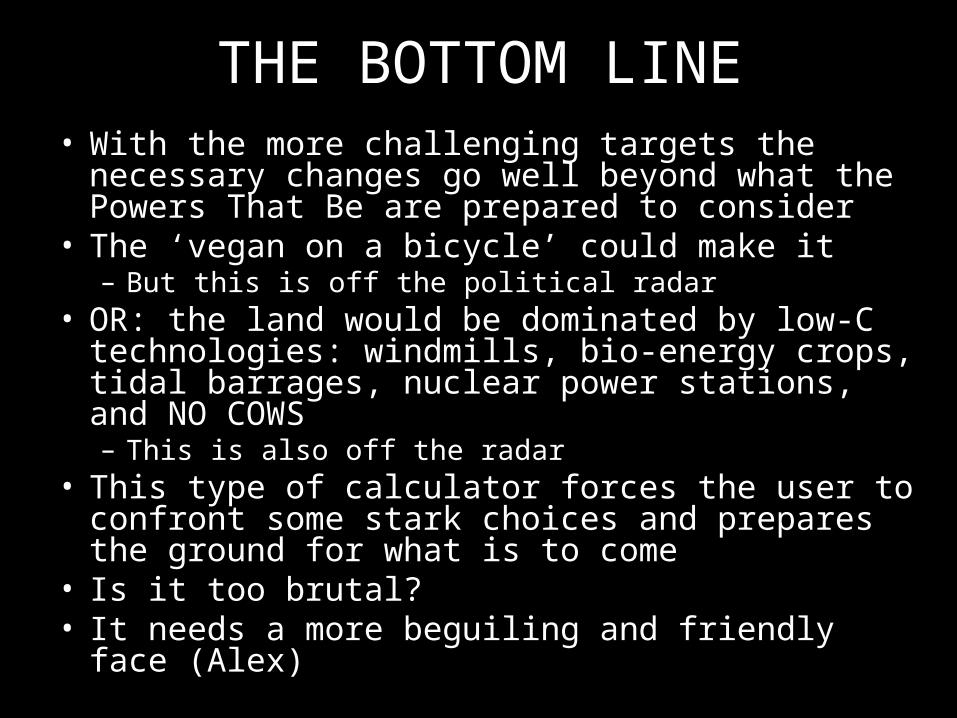
THE BOTTOM LINE• With the more challenging targets the
necessary changes go well beyond what the Powers That Be are prepared to consider
• The ‘vegan on a bicycle’ could make it– But this is off the political radar
• OR: the land would be dominated by low-C technologies: windmills, bio-energy crops, tidal barrages, nuclear power stations, and NO COWS– This is also off the radar
• This type of calculator forces the user to confront some stark choices and prepares the ground for what is to come
• Is it too brutal?• It needs a more beguiling and friendly face
(Alex)


THE END
0
2
4
6
8
10
12
T C
O2/
CA
P/Y
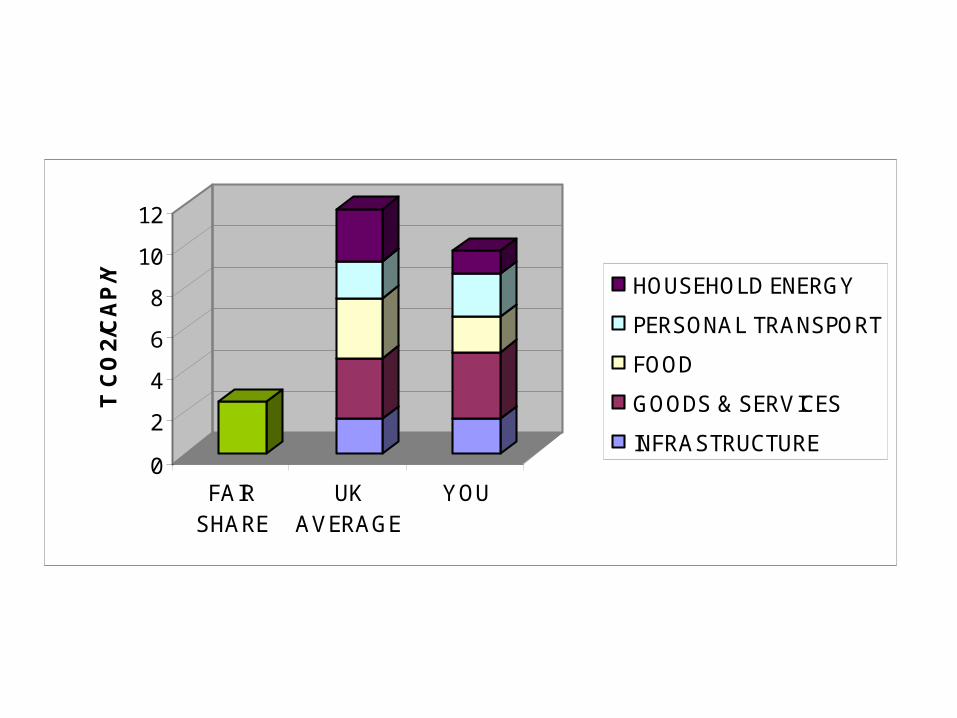
FAIRSHARE
UKAVERAGE
YOU
HOUSEHOLD ENERGY
PERSONAL TRANSPORT
FOOD
GOODS & SERVICES
INFRASTRUCTURE
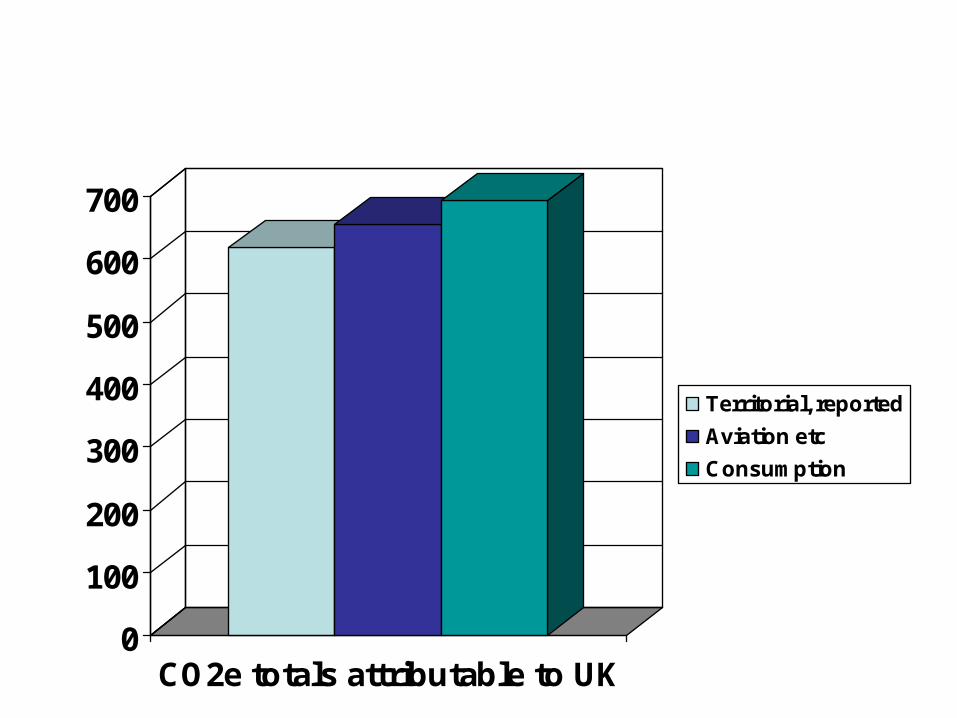
0
100
200
300
400
500
600
700
CO2e totals attributable to UK
Territorial, reported
Aviation etc
Consumption
BEFORE WE BEGIN
• Emissions• Less, not fewer• Or try ‘lower’

0
2
4
6
8
10
12
14
FAIR SHARE UK AVERAGE YOU
T C
O2E
/CA
P.Y DIRECT
INDIRECT
INDUSTRY
GOVERNMENT
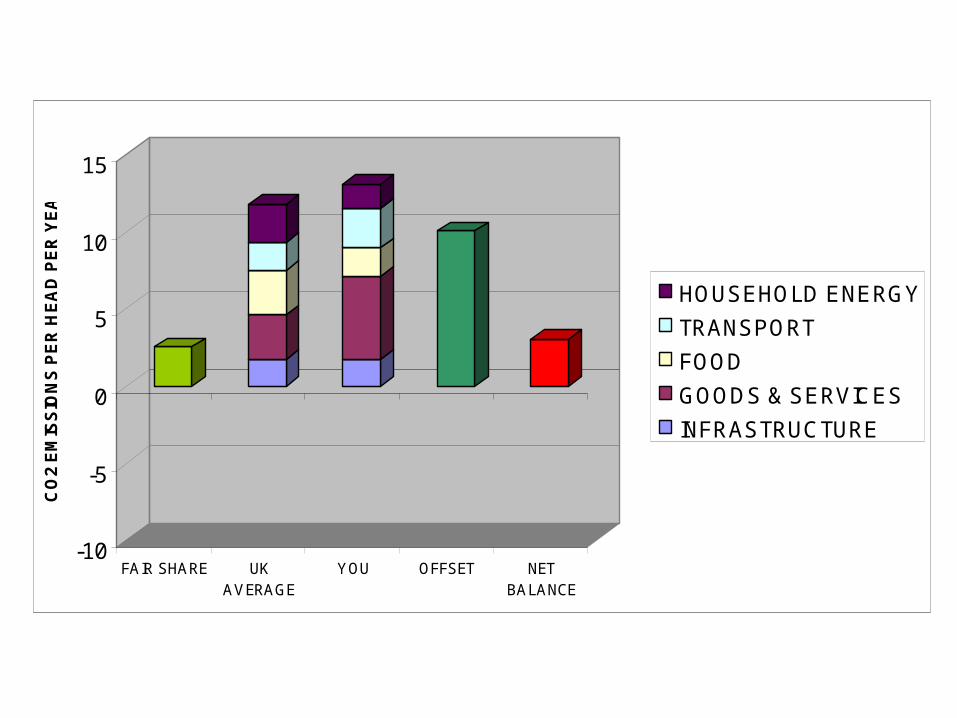
-10
-5
0
5
10
15
CO
2 E
MIS
SIO
NS
PE
R H
EA
D P
ER
YE
AR
FAIR SHARE UKAVERAGE
YOU OFFSET NETBALANCE
HOUSEHOLD ENERGY
TRANSPORT
FOOD
GOODS & SERVICES
INFRASTRUCTURE
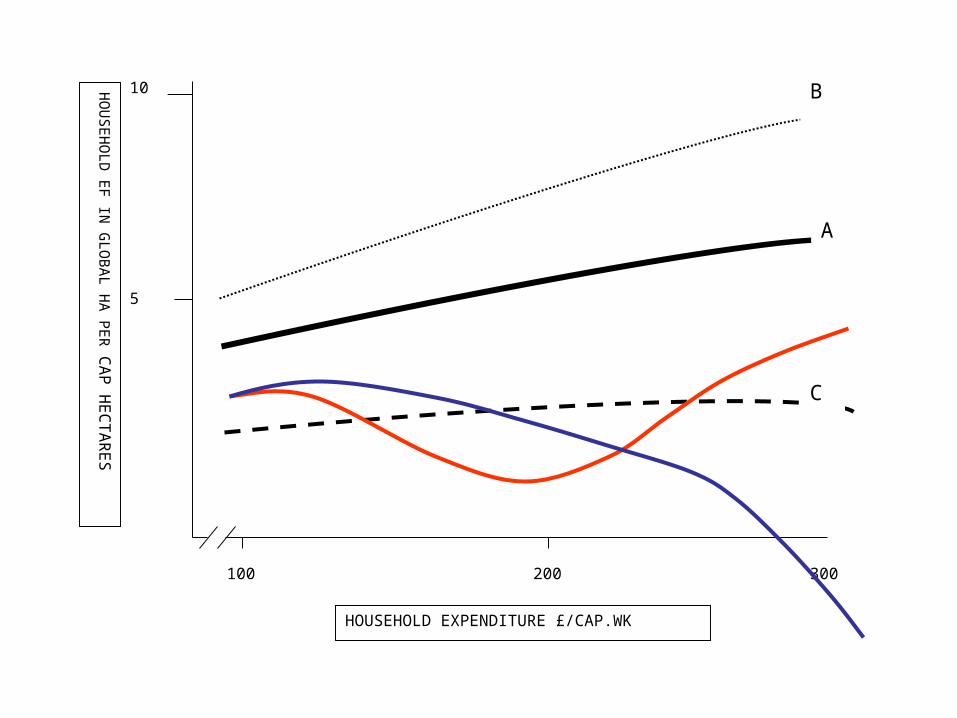
10
5
A
C
BHO
US
EH
OL
D E
F IN
GL
OB
AL
HA
PE
R C
AP
HE
CT
AR
ES
HOUSEHOLD EXPENDITURE £/CAP.WK
200100 300
SOME PARADOXES
• Have lots of kids and your score goes down
• Very hard for the wealthy to achieve low personal scores
• But direct investment in offsets can bring net-negative scores
• Spending large sums on art, high fashion and jewelry should be good– But the calculator does not pick this up
• Most calculators only cover direct emissions– This is useful but misleading
• We wanted to make an individual or household reflect the entire UK emissions
• There are three broad categories– Direct– Indirect via consumer choices– Infrastructure and capital investment
• The mathematics are brutally simple– Need more sophistication
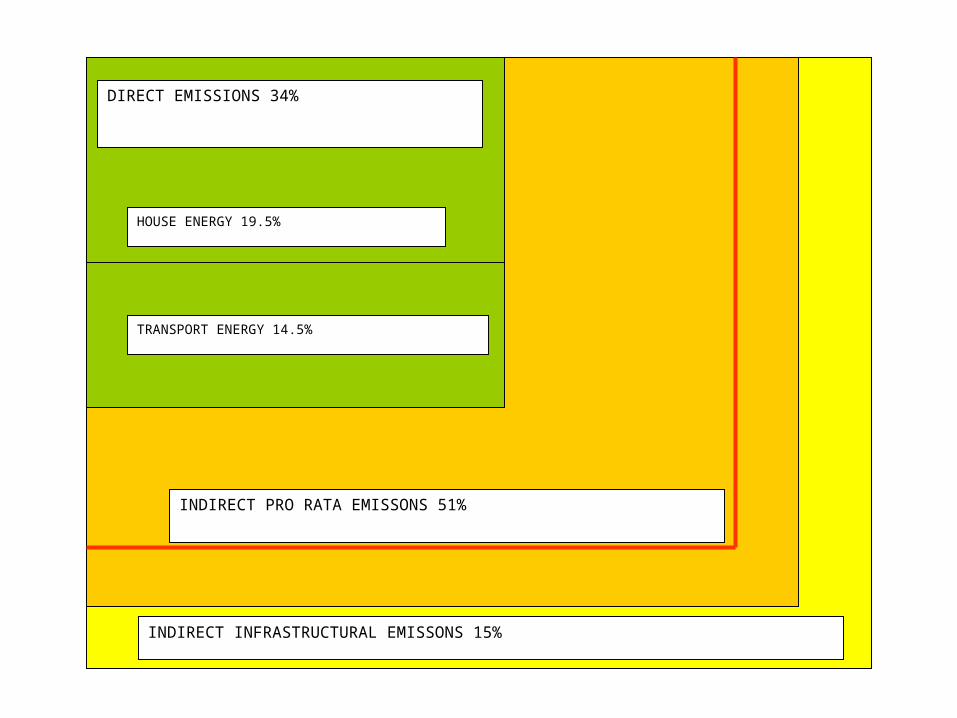
DIRECT EMISSIONS 34%
HOUSE ENERGY 19.5%
TRANSPORT ENERGY 14.5%
INDIRECT PRO RATA EMISSONS 51%
INDIRECT INFRASTRUCTURAL EMISSONS 15%
• Lots of calculators leave out ‘obvious’ things, often for political reasons– Extra radiative forcing– Non-CO2 GHGs
• Some calculators stick extra things in– High scores for nuclear energy, domestic waste
• We tried to use official data sources + corrections according to our political nous– Better to allow for known biases than take things as face value– Unlike most academics, we can change our minds at the drop of
a hat– The ‘consumption perspective’ is obviously superior and ‘correct’
• Adjusted for imports, aviation and extra forcing.• As a result, our ‘shrewd guesses’ are very close to
recent academic re-analyses• But we constantly check the latest data and re-evaluate
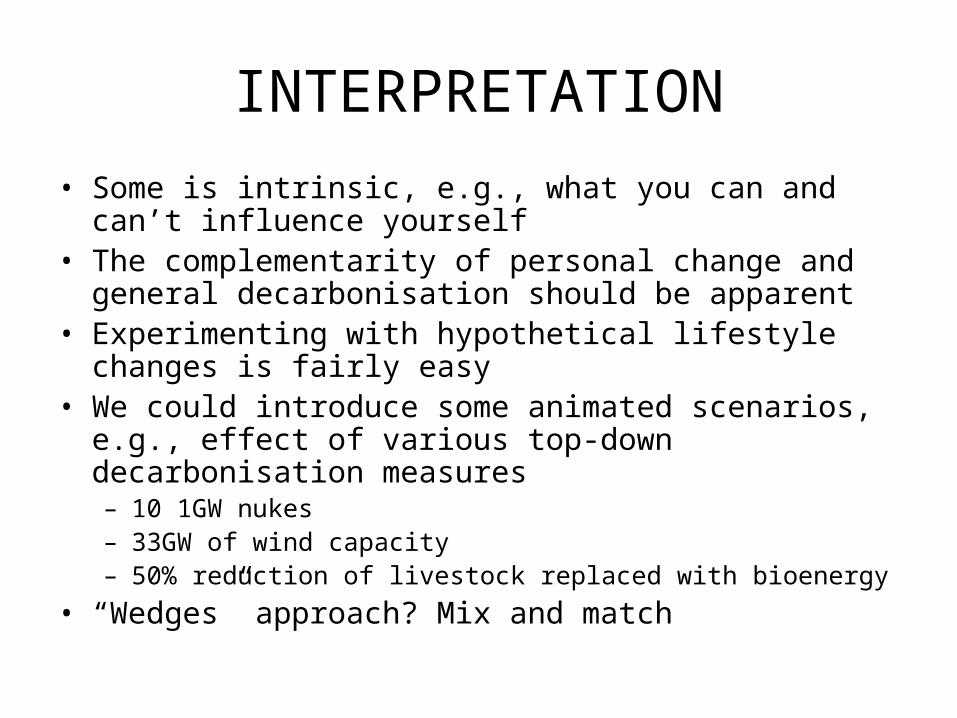
INTERPRETATION
• Some is intrinsic, e.g., what you can and can’t influence yourself
• The complementarity of personal change and general decarbonisation should be apparent
• Experimenting with hypothetical lifestyle changes is fairly easy
• We could introduce some animated scenarios, e.g., effect of various top-down decarbonisation measures– 10 1GW nukes– 33GW of wind capacity– 50% reduction of livestock replaced with bioenergy
• “Wedges” approach? Mix and match

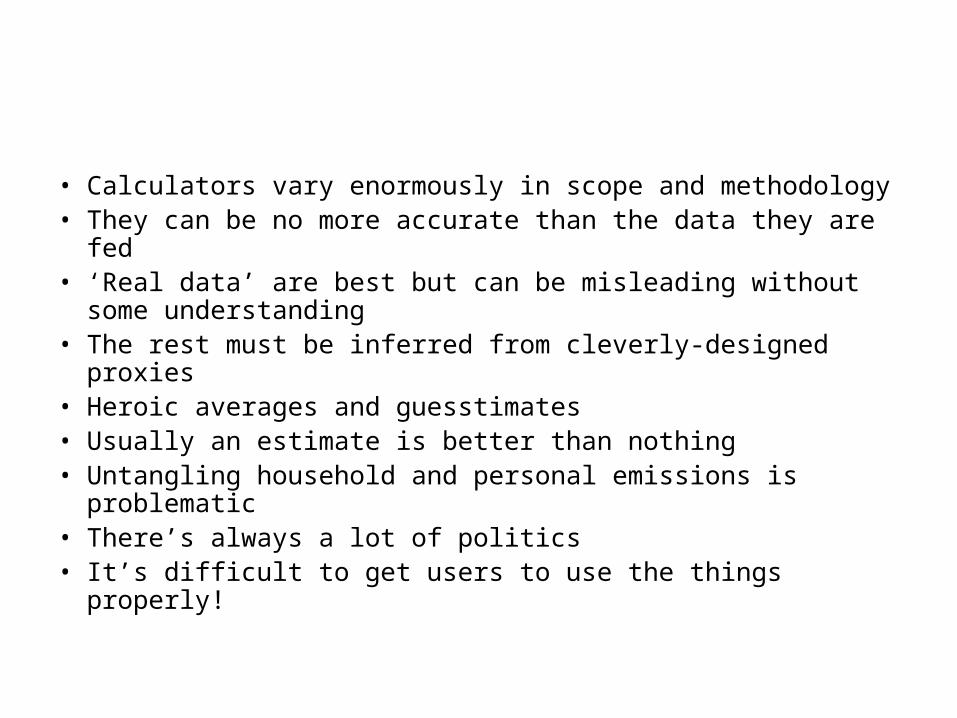
• Calculators vary enormously in scope and methodology• They can be no more accurate than the data they are fed• ‘Real data’ are best but can be misleading without some
understanding• The rest must be inferred from cleverly-designed proxies• Heroic averages and guesstimates• Usually an estimate is better than nothing• Untangling household and personal emissions is
problematic• There’s always a lot of politics• It’s difficult to get users to use the things properly!
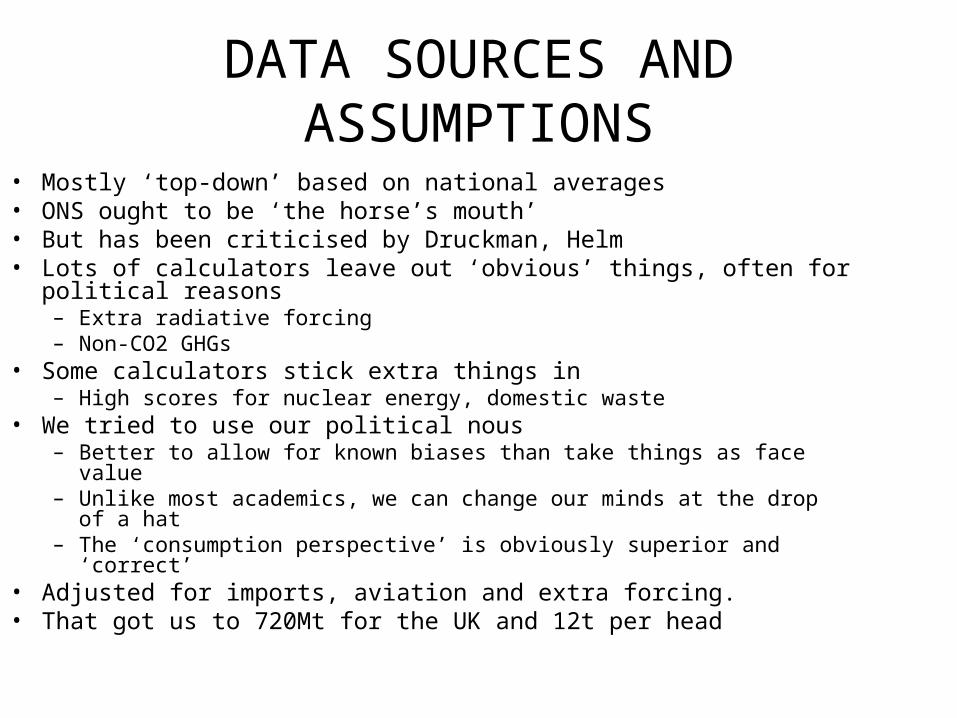
DATA SOURCES AND ASSUMPTIONS
• Mostly ‘top-down’ based on national averages• ONS ought to be ‘the horse’s mouth’• But has been criticised by Druckman, Helm• Lots of calculators leave out ‘obvious’ things, often for political
reasons– Extra radiative forcing– Non-CO2 GHGs
• Some calculators stick extra things in– High scores for nuclear energy, domestic waste
• We tried to use our political nous– Better to allow for known biases than take things as face value– Unlike most academics, we can change our minds at the drop of a hat– The ‘consumption perspective’ is obviously superior and ‘correct’
• Adjusted for imports, aviation and extra forcing.• That got us to 720Mt for the UK and 12t per head
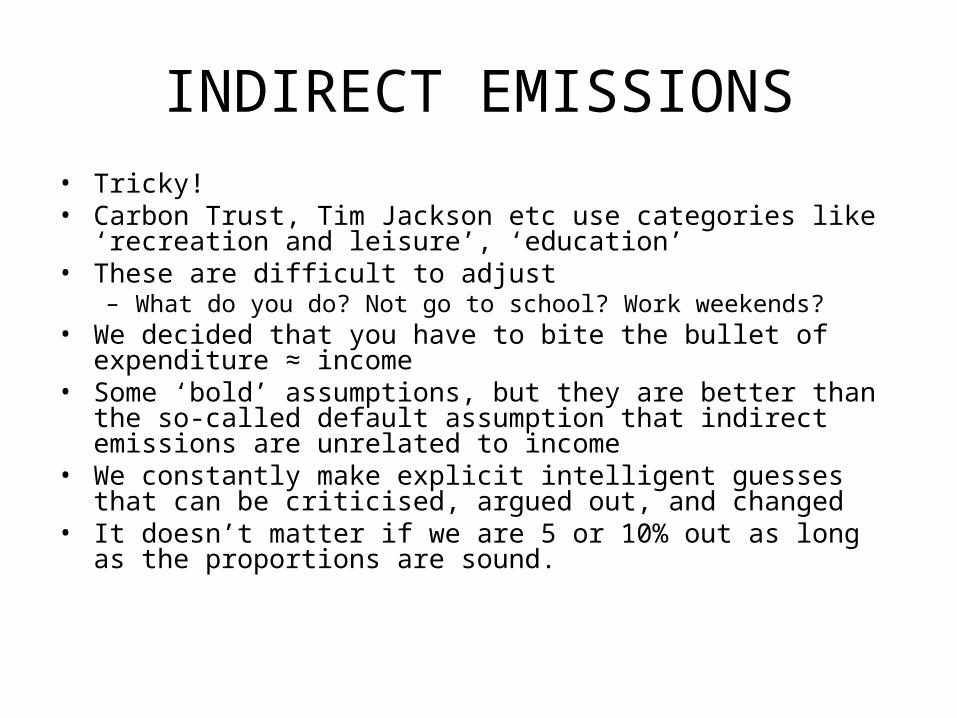
INDIRECT EMISSIONS• Tricky!• Carbon Trust, Tim Jackson etc use categories like ‘recreation and
leisure’, ‘education’• These are difficult to adjust
– What do you do? Not go to school? Work weekends?• We decided that you have to bite the bullet of expenditure ≈ income• Some ‘bold’ assumptions, but they are better than the so-called
default assumption that indirect emissions are unrelated to income• We constantly make explicit intelligent guesses that can be
criticised, argued out, and changed• It doesn’t matter if we are 5 or 10% out as long as the proportions
are sound.
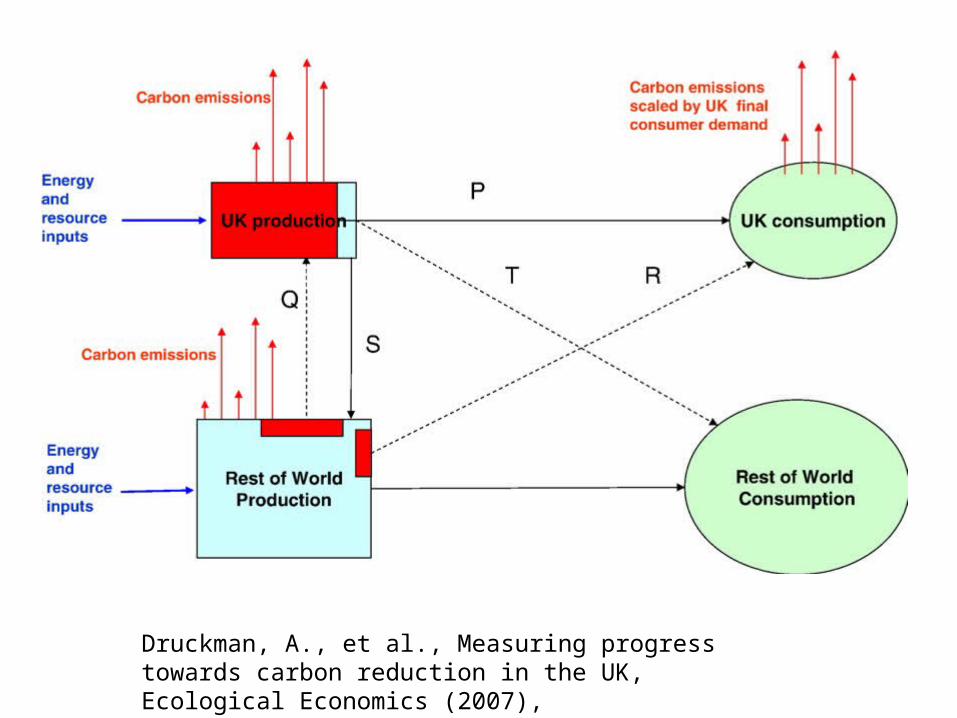
Druckman, A., et al., Measuring progress towards carbon reduction in the UK, Ecological Economics (2007),


![Ernestina Coast [LSE] Sara Randall [UCL] Alex Fanghanel [UCL] Eva Lelièvre [INED]](https://img.pdfslide.us/doc/110x75/56816642550346895dd9b53e/ernestina-coast-lse-sara-randall-ucl-alex-fanghanel-ucl-eva-lelievre.jpg)