Embed Size (px)
Citation preview

IT & DATA MANAGEMENT RESEARCH,
INDUSTRY ANALYSIS & CONSULTING
DevOps/Continuous Delivery
Tooling: Launchpad for the
Digital Enterprise
Julie Craig
Research Director, Application Management
Enterprise Management Associates, Inc.
IT & DATA MANAGEMENT RESEARCH,
INDUSTRY ANALYSIS & CONSULTING© 2017 Enterprise Management Associates, Inc.
Watch the On Demand Webinar
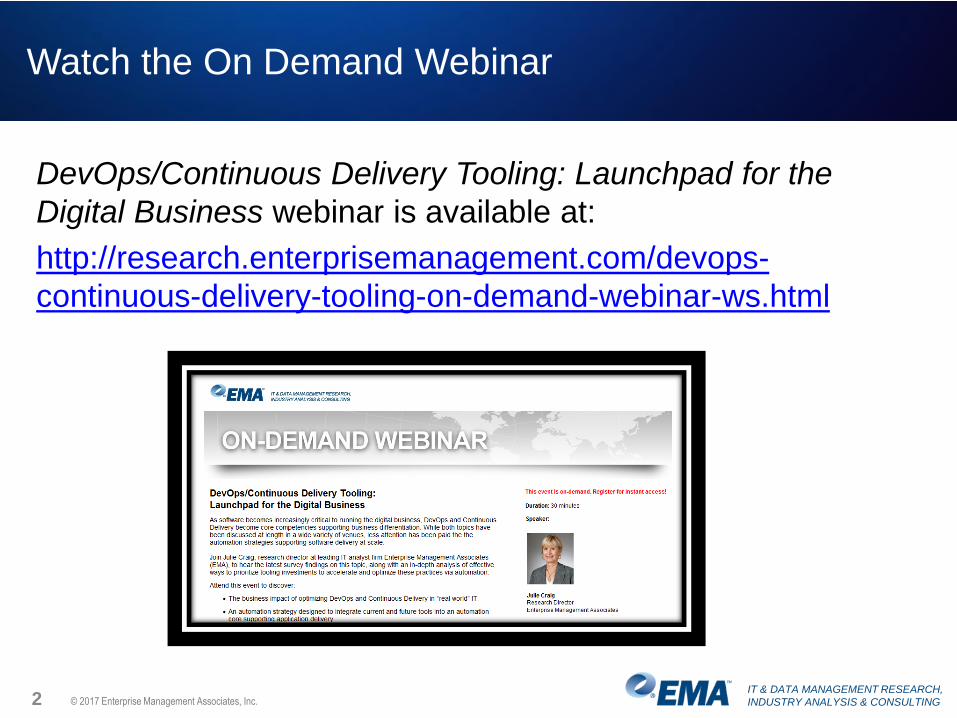
DevOps/Continuous Delivery Tooling: Launchpad for the
Digital Business webinar is available at:
http://research.enterprisemanagement.com/devops-
continuous-delivery-tooling-on-demand-webinar-ws.html
2
IT & DATA MANAGEMENT RESEARCH,
INDUSTRY ANALYSIS & CONSULTING
Today’s Speaker
3 © 2017 Enterprise Management Associates, Inc.
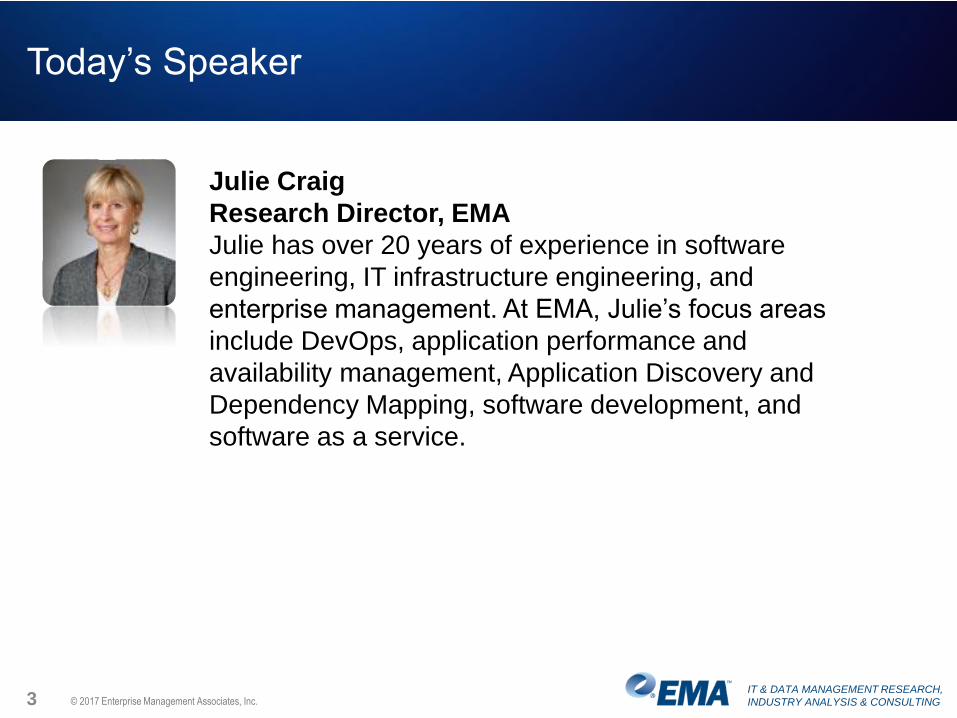
Julie Craig
Research Director, EMA
Julie has over 20 years of experience in software
engineering, IT infrastructure engineering, and
enterprise management. At EMA, Julie’s focus areas
include DevOps, application performance and
availability management, Application Discovery and
Dependency Mapping, software development, and
software as a service.
IT & DATA MANAGEMENT RESEARCH,
INDUSTRY ANALYSIS & CONSULTING
Logistics for Today’s Webinar
4 © 2017 Enterprise Management Associates, Inc.
An archived version of the event recording
will be available at
www.enterprisemanagement.com
• Log questions in the chat panel located on
the lower left-hand corner of your screen
• Questions will be addressed during the
Q&A session of the event
QUESTIONS
EVENT RECORDING
A PDF of the speaker slides will be
distributed to all attendees
PDF SLIDES
IT & DATA MANAGEMENT RESEARCH,
INDUSTRY ANALYSIS & CONSULTING
Research Sponsors
5 © 2017 Enterprise Management Associates, Inc.
IT & DATA MANAGEMENT RESEARCH,
INDUSTRY ANALYSIS & CONSULTING
DevOps/Continuous Delivery
Tooling: Launchpad for the
Digital Enterprise
Julie Craig
Research Director, Application Management
Enterprise Management Associates, Inc.
IT & DATA MANAGEMENT RESEARCH,
INDUSTRY ANALYSIS & CONSULTING
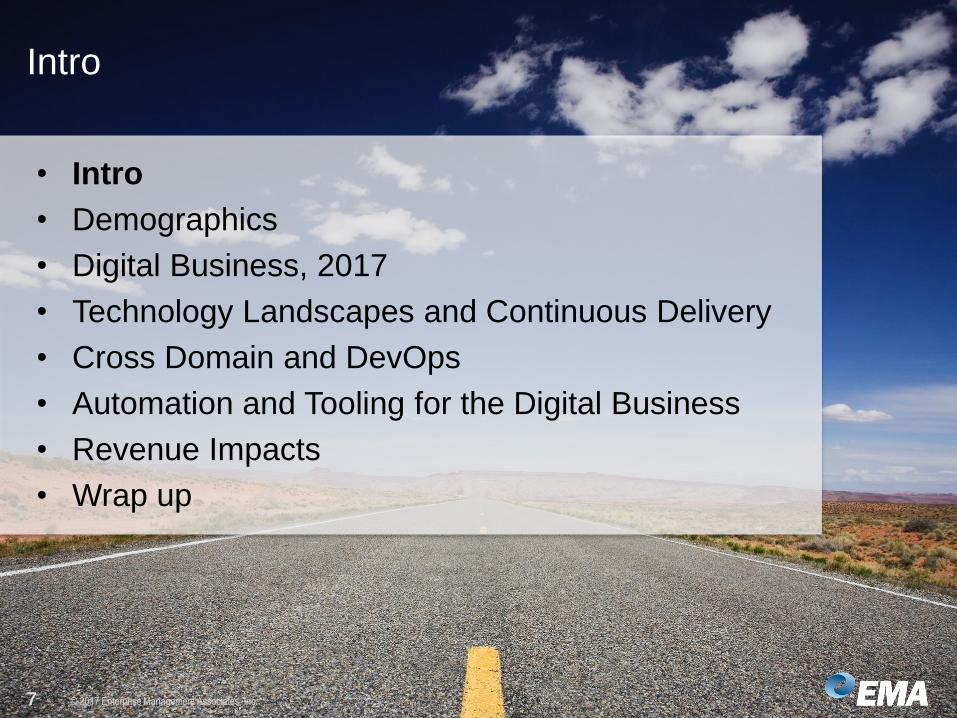
Intro
• Intro
• Demographics
• Digital Business, 2017
• Technology Landscapes and Continuous Delivery
• Cross Domain and DevOps
• Automation and Tooling for the Digital Business
• Revenue Impacts
• Wrap up
7 © 2017 Enterprise Management Associates, Inc.
IT & DATA MANAGEMENT RESEARCH,
INDUSTRY ANALYSIS & CONSULTING
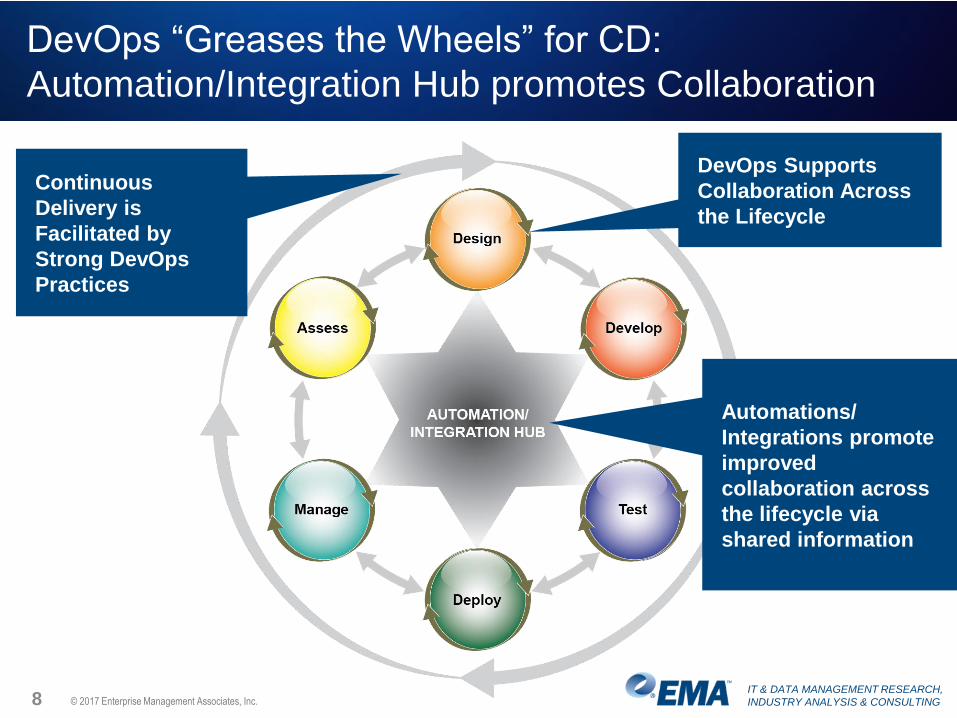
DevOps “Greases the Wheels” for CD:
Automation/Integration Hub promotes Collaboration
8 © 2017 Enterprise Management Associates, Inc.
DevOps Supports
Collaboration Across
the Lifecycle
Continuous
Delivery is
Facilitated by
Strong DevOps
Practices
Automations/
Integrations promote
improved
collaboration across
the lifecycle via
shared information
IT & DATA MANAGEMENT RESEARCH,
INDUSTRY ANALYSIS & CONSULTING
Demographics
• Demographics
• Digital Business, 2017
• Technology Landscapes and Continuous Delivery
• Cross Domain and DevOps
• Automation and Tooling for the Digital Business
• Revenue Impacts
• Wrap up
9 © 2017 Enterprise Management Associates, Inc.
IT & DATA MANAGEMENT RESEARCH,
INDUSTRY ANALYSIS & CONSULTING
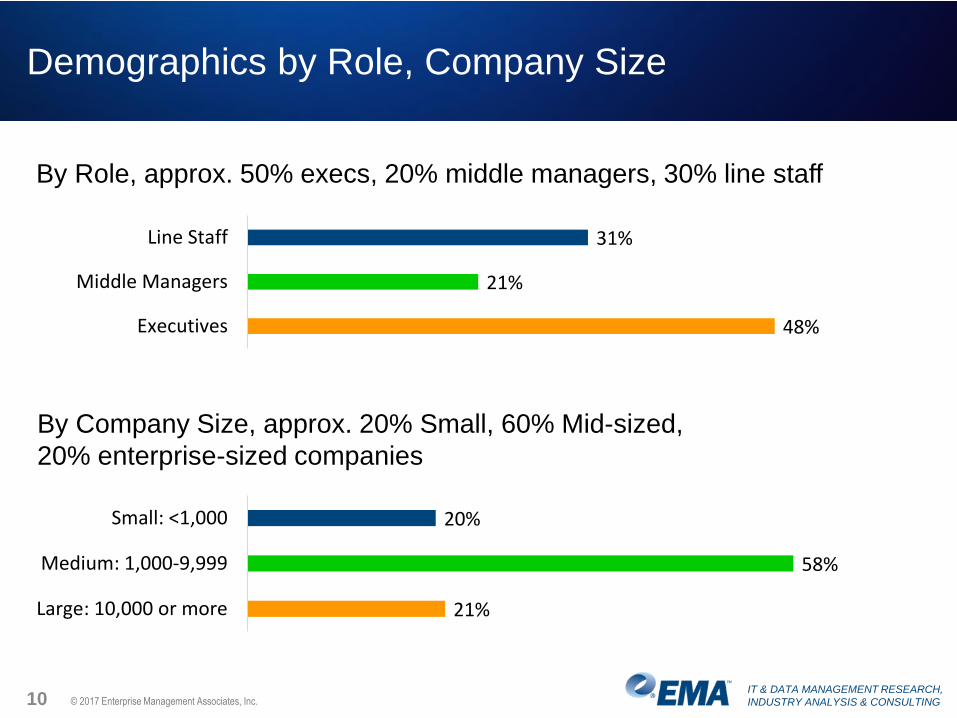
Demographics by Role, Company Size
By Role, approx. 50% execs, 20% middle managers, 30% line staff
10 © 2017 Enterprise Management Associates, Inc.
By Company Size, approx. 20% Small, 60% Mid-sized,
20% enterprise-sized companies
31%
21%
48%
Line Staff
Middle Managers
Executives
20%
58%
21%
Small: <1,000
Medium: 1,000-9,999
Large: 10,000 or more
IT & DATA MANAGEMENT RESEARCH,
INDUSTRY ANALYSIS & CONSULTING
Digital Business, 2017
• Digital Business, 2017
• Technology Landscapes and Continuous Delivery
• Cross Domain and DevOps
• Automation and Tooling for the Digital Business
• Revenue Impacts
• Wrap up
11 © 2017 Enterprise Management Associates, Inc.
IT & DATA MANAGEMENT RESEARCH,
INDUSTRY ANALYSIS & CONSULTING
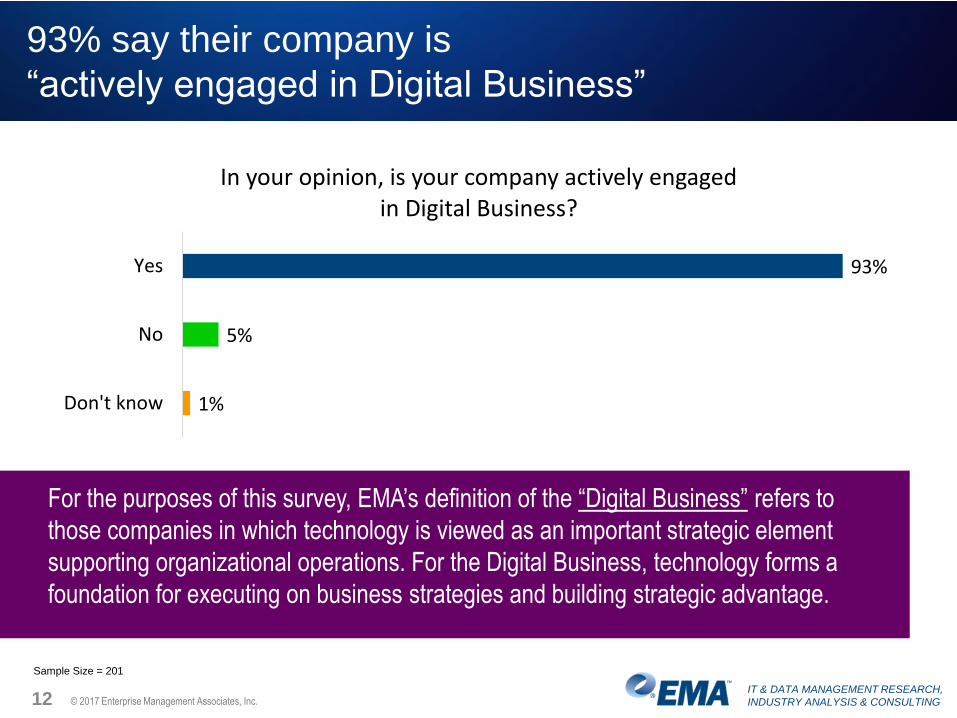
93% say their company is
“actively engaged in Digital Business”
12 © 2017 Enterprise Management Associates, Inc.
93%
5%
1%
Yes
No
Don't know
In your opinion, is your company actively engaged in Digital Business?
Sample Size = 201
For the purposes of this survey, EMA’s definition of the “Digital Business” refers to
those companies in which technology is viewed as an important strategic element
supporting organizational operations. For the Digital Business, technology forms a
foundation for executing on business strategies and building strategic advantage.
IT & DATA MANAGEMENT RESEARCH,
INDUSTRY ANALYSIS & CONSULTING
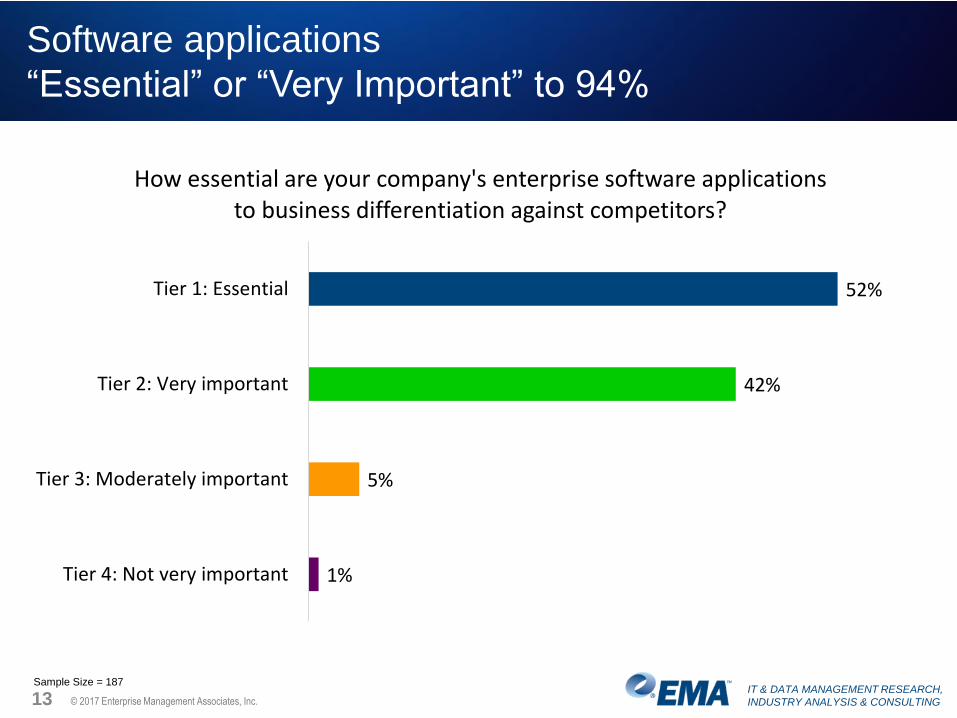
Software applications
“Essential” or “Very Important” to 94%
13 © 2017 Enterprise Management Associates, Inc.
52%
42%
5%
1%
Tier 1: Essential
Tier 2: Very important
Tier 3: Moderately important
Tier 4: Not very important
How essential are your company's enterprise software applications to business differentiation against competitors?
Sample Size = 187
IT & DATA MANAGEMENT RESEARCH,
INDUSTRY ANALYSIS & CONSULTING
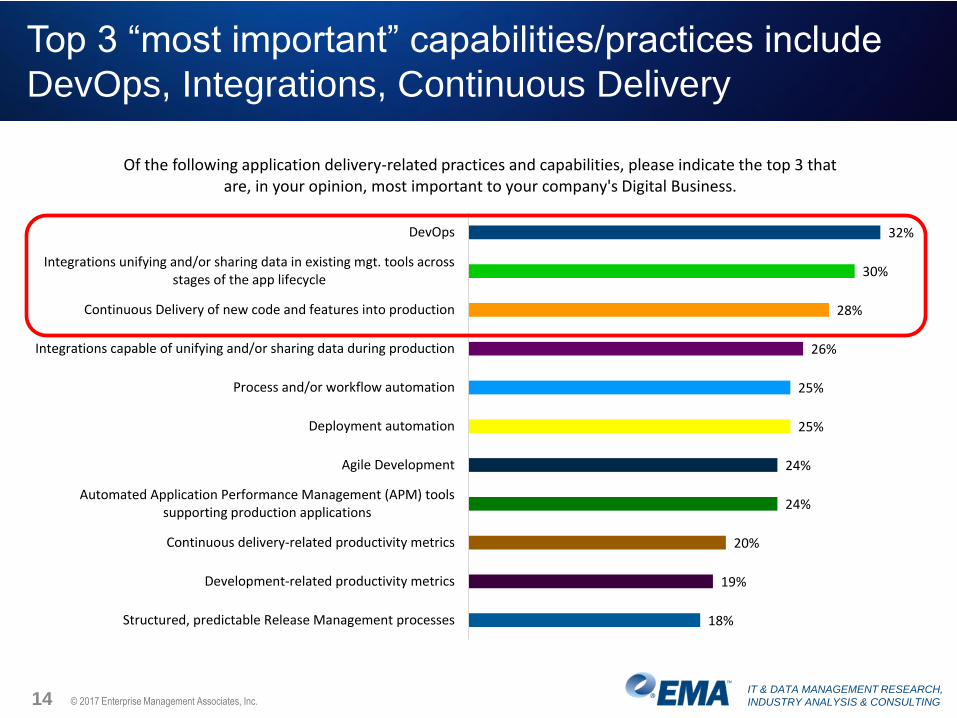
Top 3 “most important” capabilities/practices include
DevOps, Integrations, Continuous Delivery
14 © 2017 Enterprise Management Associates, Inc.
32%
30%
28%
26%
25%
25%
24%
24%
20%
19%
18%
DevOps
Integrations unifying and/or sharing data in existing mgt. tools acrossstages of the app lifecycle
Continuous Delivery of new code and features into production
Integrations capable of unifying and/or sharing data during production
Process and/or workflow automation
Deployment automation
Agile Development
Automated Application Performance Management (APM) toolssupporting production applications
Continuous delivery-related productivity metrics
Development-related productivity metrics
Structured, predictable Release Management processes
Of the following application delivery-related practices and capabilities, please indicate the top 3 that are, in your opinion, most important to your company's Digital Business.
IT & DATA MANAGEMENT RESEARCH,
INDUSTRY ANALYSIS & CONSULTING
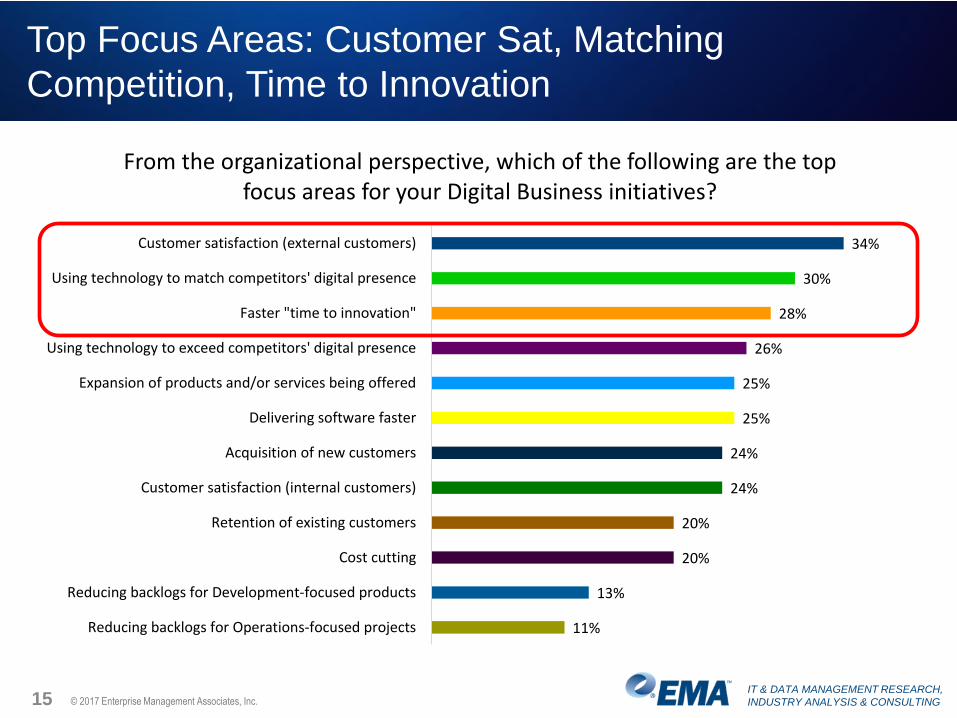
Top Focus Areas: Customer Sat, Matching
Competition, Time to Innovation
15 © 2017 Enterprise Management Associates, Inc.
34%
30%
28%
26%
25%
25%
24%
24%
20%
20%
13%
11%
Customer satisfaction (external customers)
Using technology to match competitors' digital presence
Faster "time to innovation"
Using technology to exceed competitors' digital presence
Expansion of products and/or services being offered
Delivering software faster
Acquisition of new customers
Customer satisfaction (internal customers)
Retention of existing customers
Cost cutting
Reducing backlogs for Development-focused products
Reducing backlogs for Operations-focused projects
From the organizational perspective, which of the following are the top focus areas for your Digital Business initiatives?
IT & DATA MANAGEMENT RESEARCH,
INDUSTRY ANALYSIS & CONSULTING
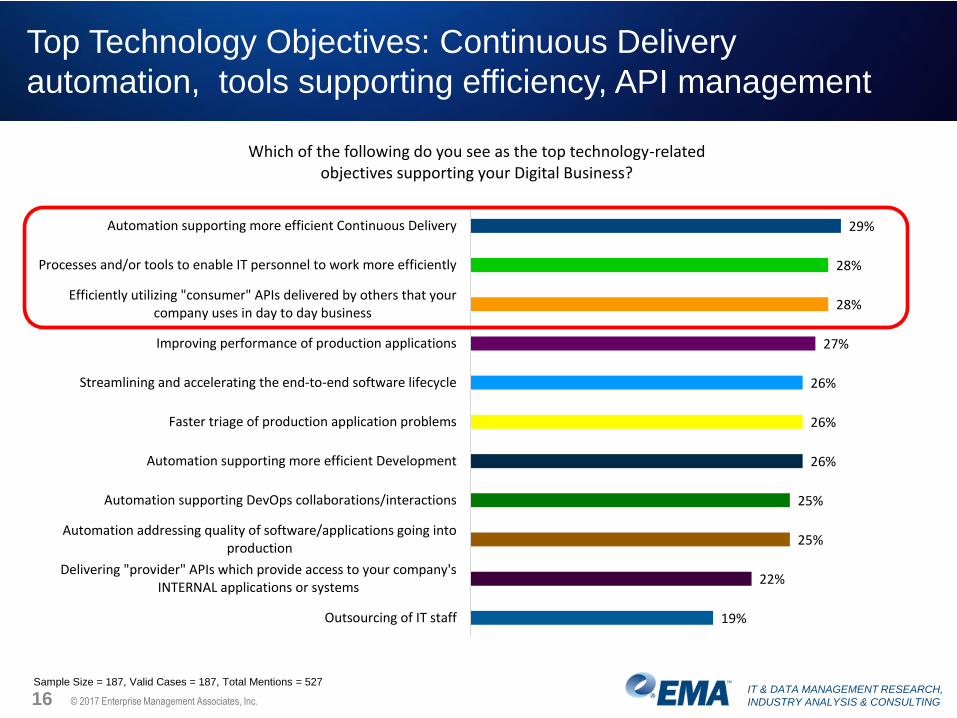
Top Technology Objectives: Continuous Delivery
automation, tools supporting efficiency, API management
16 © 2017 Enterprise Management Associates, Inc.
29%
28%
28%
27%
26%
26%
26%
25%
25%
22%
19%
Automation supporting more efficient Continuous Delivery
Processes and/or tools to enable IT personnel to work more efficiently
Efficiently utilizing "consumer" APIs delivered by others that yourcompany uses in day to day business
Improving performance of production applications
Streamlining and accelerating the end-to-end software lifecycle
Faster triage of production application problems
Automation supporting more efficient Development
Automation supporting DevOps collaborations/interactions
Automation addressing quality of software/applications going intoproduction
Delivering "provider" APIs which provide access to your company'sINTERNAL applications or systems
Outsourcing of IT staff
Which of the following do you see as the top technology-related objectives supporting your Digital Business?
Sample Size = 187, Valid Cases = 187, Total Mentions = 527
IT & DATA MANAGEMENT RESEARCH,
INDUSTRY ANALYSIS & CONSULTING
Technology Landscapes
• Technology Landscapes and Continuous Delivery
• Cross Domain and DevOps
• Automation and Tooling for the Digital Business
• Revenue Impacts
• Wrap up
17 © 2017 Enterprise Management Associates, Inc.
IT & DATA MANAGEMENT RESEARCH,
INDUSTRY ANALYSIS & CONSULTING
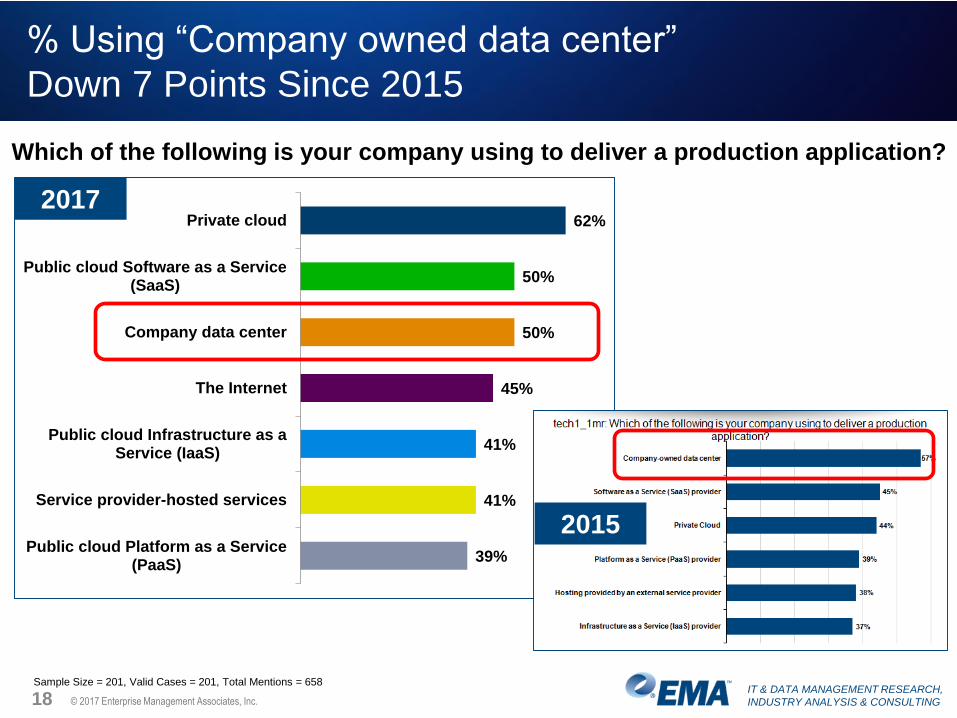
% Using “Company owned data center”
Down 7 Points Since 2015
18 © 2017 Enterprise Management Associates, Inc.
Which of the following is your company using to deliver a production application?
62%
50%
50%
45%
41%
41%
39%
Private cloud
Public cloud Software as a Service(SaaS)
Company data center
The Internet
Public cloud Infrastructure as aService (IaaS)
Service provider-hosted services
Public cloud Platform as a Service(PaaS)
Sample Size = 201, Valid Cases = 201, Total Mentions = 658
2017
2015
IT & DATA MANAGEMENT RESEARCH,
INDUSTRY ANALYSIS & CONSULTING
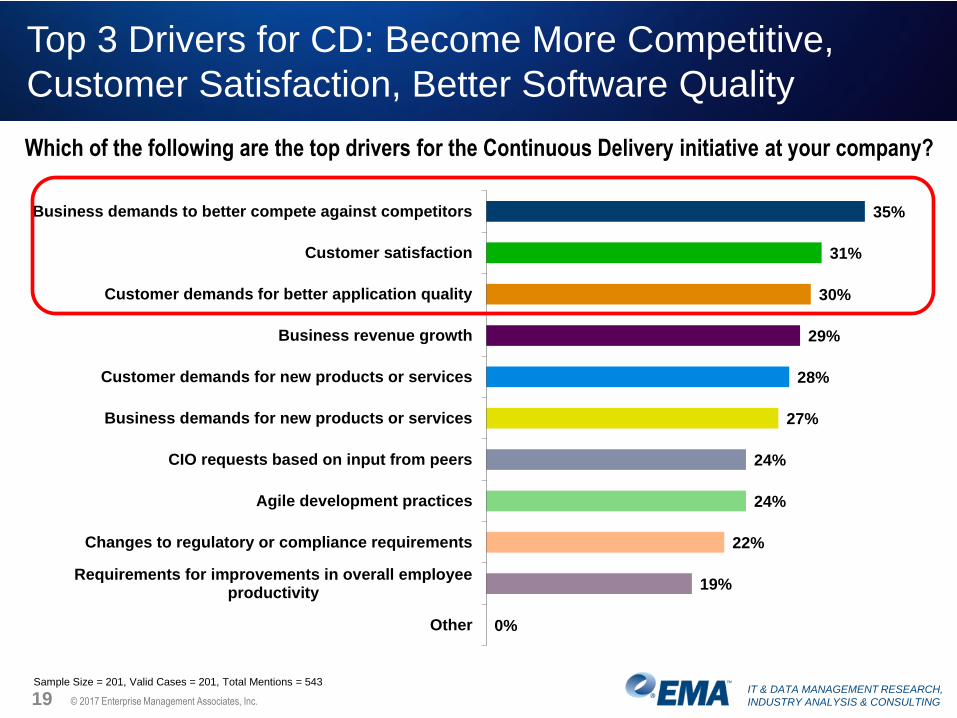
Top 3 Drivers for CD: Become More Competitive,
Customer Satisfaction, Better Software Quality
19 © 2017 Enterprise Management Associates, Inc.
Which of the following are the top drivers for the Continuous Delivery initiative at your company?
35%
31%
30%
29%
28%
27%
24%
24%
22%
19%
0%
Business demands to better compete against competitors
Customer satisfaction
Customer demands for better application quality
Business revenue growth
Customer demands for new products or services
Business demands for new products or services
CIO requests based on input from peers
Agile development practices
Changes to regulatory or compliance requirements
Requirements for improvements in overall employeeproductivity
Other
Sample Size = 201, Valid Cases = 201, Total Mentions = 543
IT & DATA MANAGEMENT RESEARCH,
INDUSTRY ANALYSIS & CONSULTING
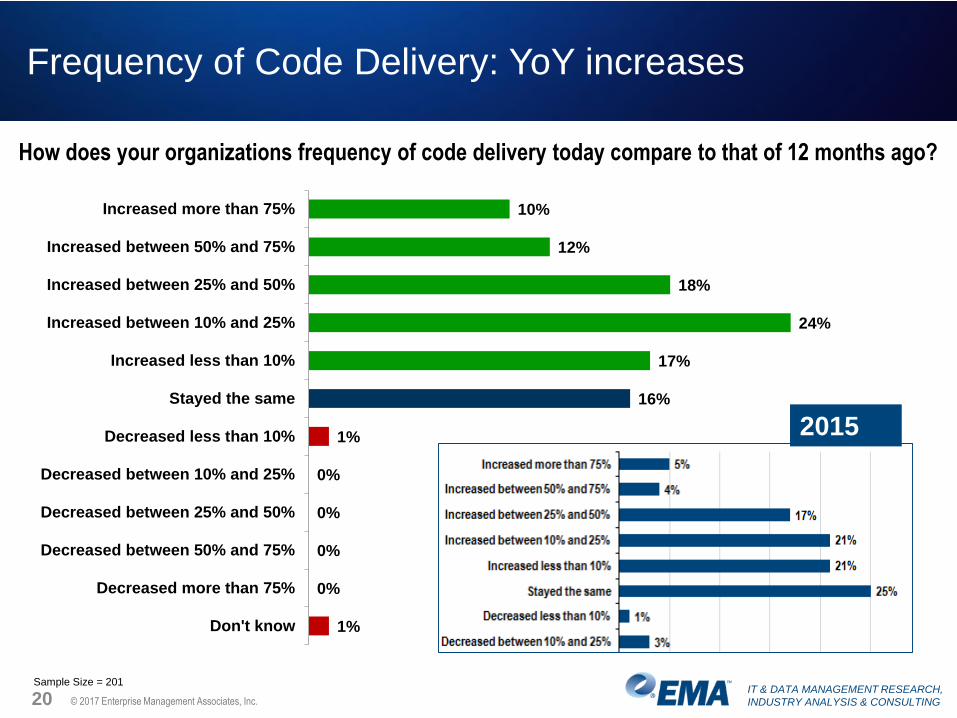
Frequency of Code Delivery: YoY increases
20 © 2017 Enterprise Management Associates, Inc.
How does your organizations frequency of code delivery today compare to that of 12 months ago?
10%
12%
18%
24%
17%
16%
1%
0%
0%
0%
0%
1%
Increased more than 75%
Increased between 50% and 75%
Increased between 25% and 50%
Increased between 10% and 25%
Increased less than 10%
Stayed the same
Decreased less than 10%
Decreased between 10% and 25%
Decreased between 25% and 50%
Decreased between 50% and 75%
Decreased more than 75%
Don't know
Sample Size = 201
2015
IT & DATA MANAGEMENT RESEARCH,
INDUSTRY ANALYSIS & CONSULTING
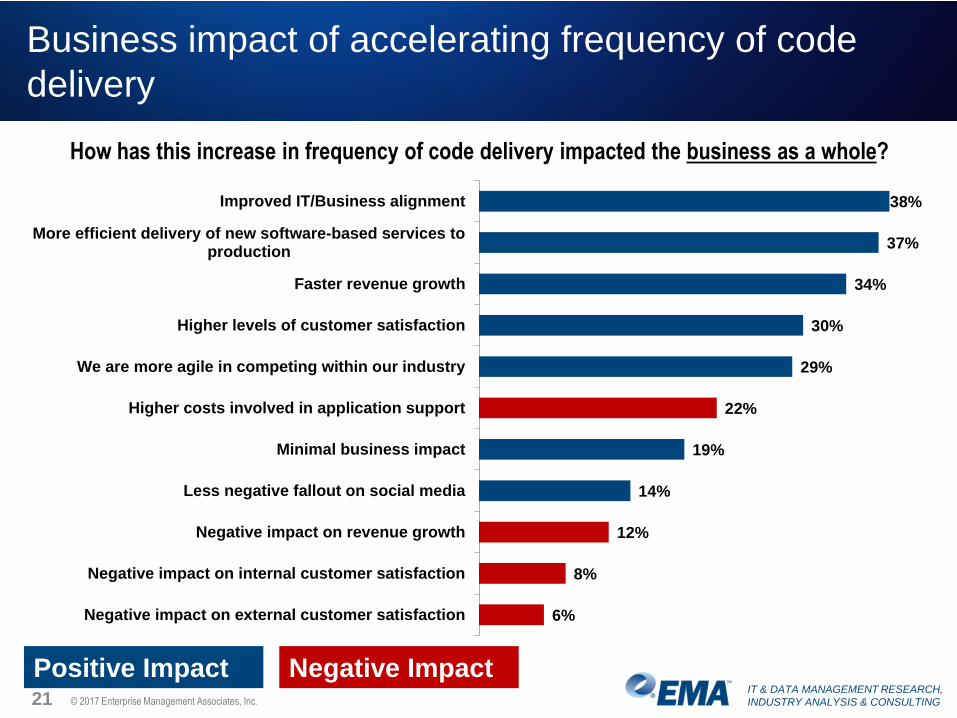
Business impact of accelerating frequency of code
delivery
21 © 2017 Enterprise Management Associates, Inc.
How has this increase in frequency of code delivery impacted the business as a whole?
38%
37%
34%
30%
29%
22%
19%
14%
12%
8%
6%
Improved IT/Business alignment
More efficient delivery of new software-based services toproduction
Faster revenue growth
Higher levels of customer satisfaction
We are more agile in competing within our industry
Higher costs involved in application support
Minimal business impact
Less negative fallout on social media
Negative impact on revenue growth
Negative impact on internal customer satisfaction
Negative impact on external customer satisfaction
Positive Impact Negative Impact
IT & DATA MANAGEMENT RESEARCH,
INDUSTRY ANALYSIS & CONSULTING
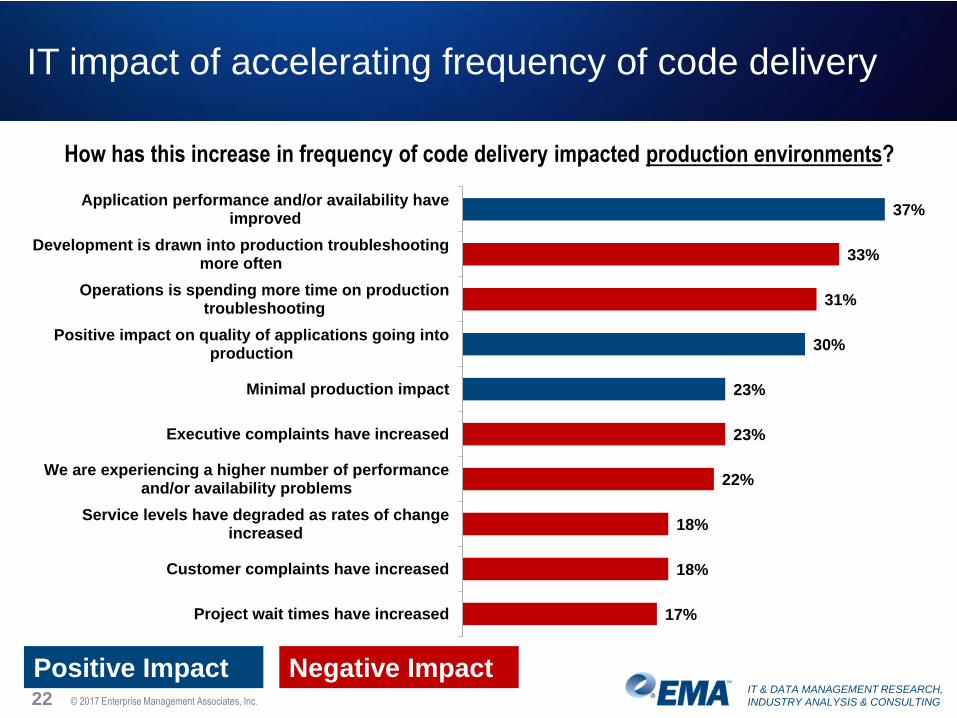
IT impact of accelerating frequency of code delivery
22 © 2017 Enterprise Management Associates, Inc.
How has this increase in frequency of code delivery impacted production environments?
37%
33%
31%
30%
23%
23%
22%
18%
18%
17%
Application performance and/or availability haveimproved
Development is drawn into production troubleshootingmore often
Operations is spending more time on productiontroubleshooting
Positive impact on quality of applications going intoproduction
Minimal production impact
Executive complaints have increased
We are experiencing a higher number of performanceand/or availability problems
Service levels have degraded as rates of changeincreased
Customer complaints have increased
Project wait times have increased
Positive Impact Negative Impact
IT & DATA MANAGEMENT RESEARCH,
INDUSTRY ANALYSIS & CONSULTING
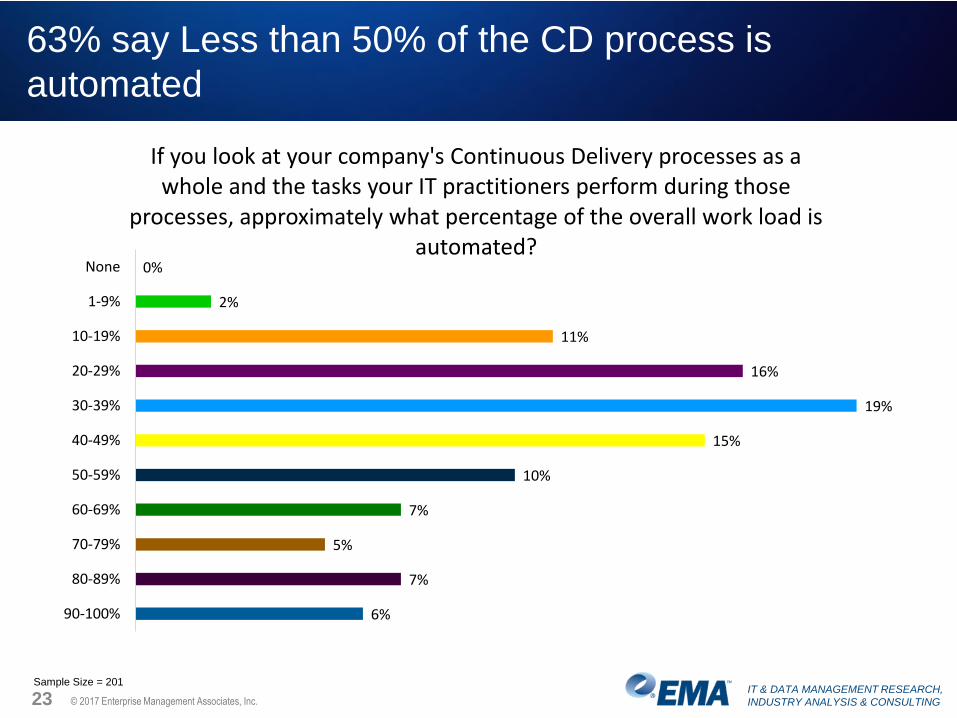
63% say Less than 50% of the CD process is
automated
23 © 2017 Enterprise Management Associates, Inc.
0%
2%
11%
16%
19%
15%
10%
7%
5%
7%
6%
None
1-9%
10-19%
20-29%
30-39%
40-49%
50-59%
60-69%
70-79%
80-89%
90-100%
If you look at your company's Continuous Delivery processes as a whole and the tasks your IT practitioners perform during those
processes, approximately what percentage of the overall work load is automated?
Sample Size = 201
IT & DATA MANAGEMENT RESEARCH,
INDUSTRY ANALYSIS & CONSULTING
Cross Domain and DevOps
• Cross Domain and DevOps
• Automation and Tooling for the Digital Business
• Revenue Impacts
• Wrap up
24 © 2017 Enterprise Management Associates, Inc.
IT & DATA MANAGEMENT RESEARCH,
INDUSTRY ANALYSIS & CONSULTING
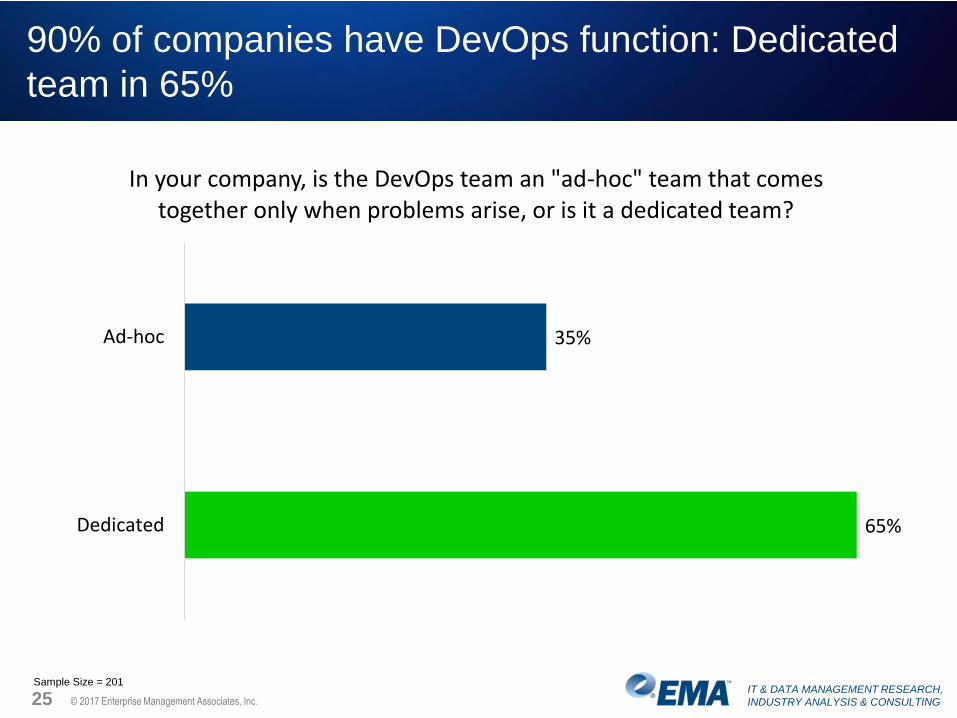
90% of companies have DevOps function: Dedicated
team in 65%
25 © 2017 Enterprise Management Associates, Inc.
35%
65%
Ad-hoc
Dedicated
In your company, is the DevOps team an "ad-hoc" team that comes together only when problems arise, or is it a dedicated team?
Sample Size = 201
IT & DATA MANAGEMENT RESEARCH,
INDUSTRY ANALYSIS & CONSULTING
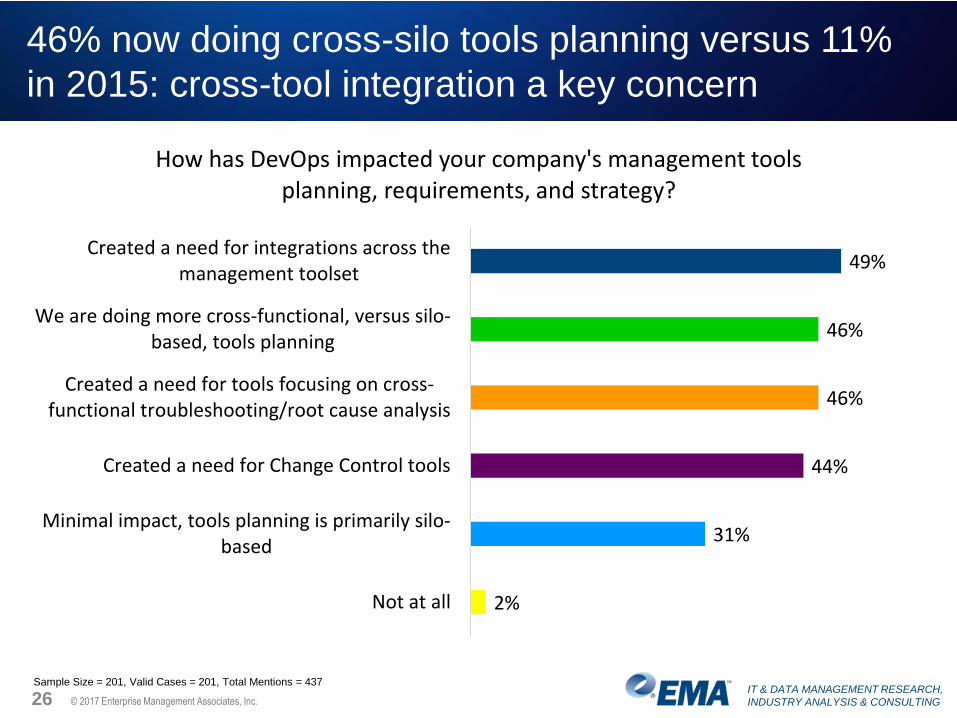
46% now doing cross-silo tools planning versus 11%
in 2015: cross-tool integration a key concern
26 © 2017 Enterprise Management Associates, Inc.
49%
46%
46%
44%
31%
2%
Created a need for integrations across themanagement toolset
We are doing more cross-functional, versus silo-based, tools planning
Created a need for tools focusing on cross-functional troubleshooting/root cause analysis
Created a need for Change Control tools
Minimal impact, tools planning is primarily silo-based
Not at all
How has DevOps impacted your company's management tools planning, requirements, and strategy?
Sample Size = 201, Valid Cases = 201, Total Mentions = 437
IT & DATA MANAGEMENT RESEARCH,
INDUSTRY ANALYSIS & CONSULTING
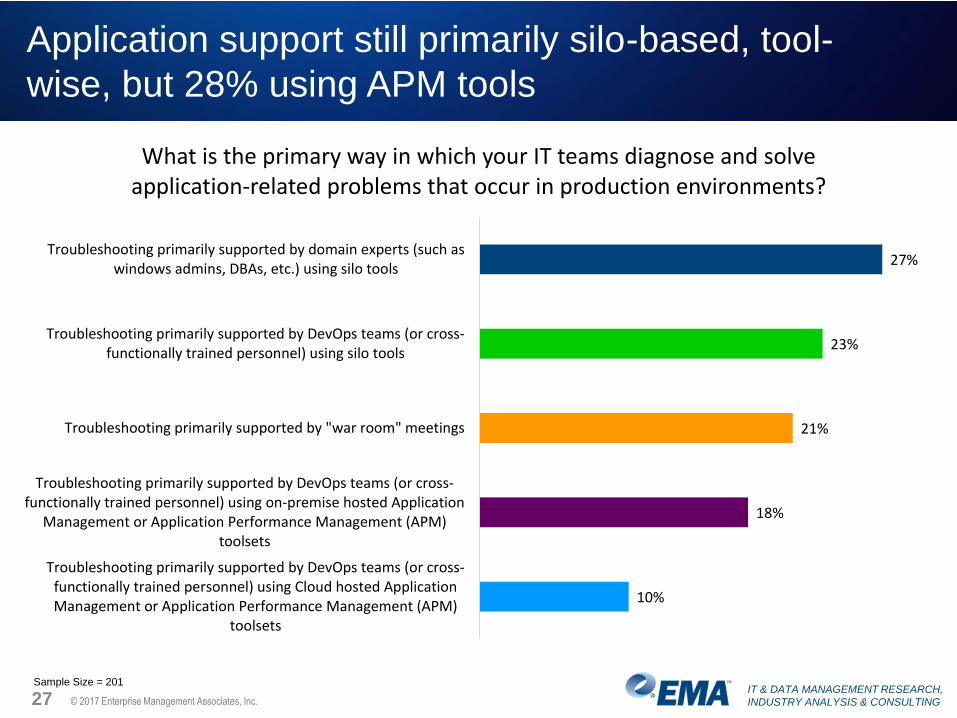
Application support still primarily silo-based, tool-
wise, but 28% using APM tools
27 © 2017 Enterprise Management Associates, Inc.
27%
23%
21%
18%
10%
Troubleshooting primarily supported by domain experts (such aswindows admins, DBAs, etc.) using silo tools
Troubleshooting primarily supported by DevOps teams (or cross-functionally trained personnel) using silo tools
Troubleshooting primarily supported by "war room" meetings
Troubleshooting primarily supported by DevOps teams (or cross-functionally trained personnel) using on-premise hosted Application
Management or Application Performance Management (APM)toolsets
Troubleshooting primarily supported by DevOps teams (or cross-functionally trained personnel) using Cloud hosted ApplicationManagement or Application Performance Management (APM)
toolsets
What is the primary way in which your IT teams diagnose and solve application-related problems that occur in production environments?
Sample Size = 201
IT & DATA MANAGEMENT RESEARCH,
INDUSTRY ANALYSIS & CONSULTING
Automation and Tooling for the Digital Business
• Automation and Tooling for the Digital Business
• Revenue Impacts
• Wrap up
28 © 2017 Enterprise Management Associates, Inc.
IT & DATA MANAGEMENT RESEARCH,
INDUSTRY ANALYSIS & CONSULTING
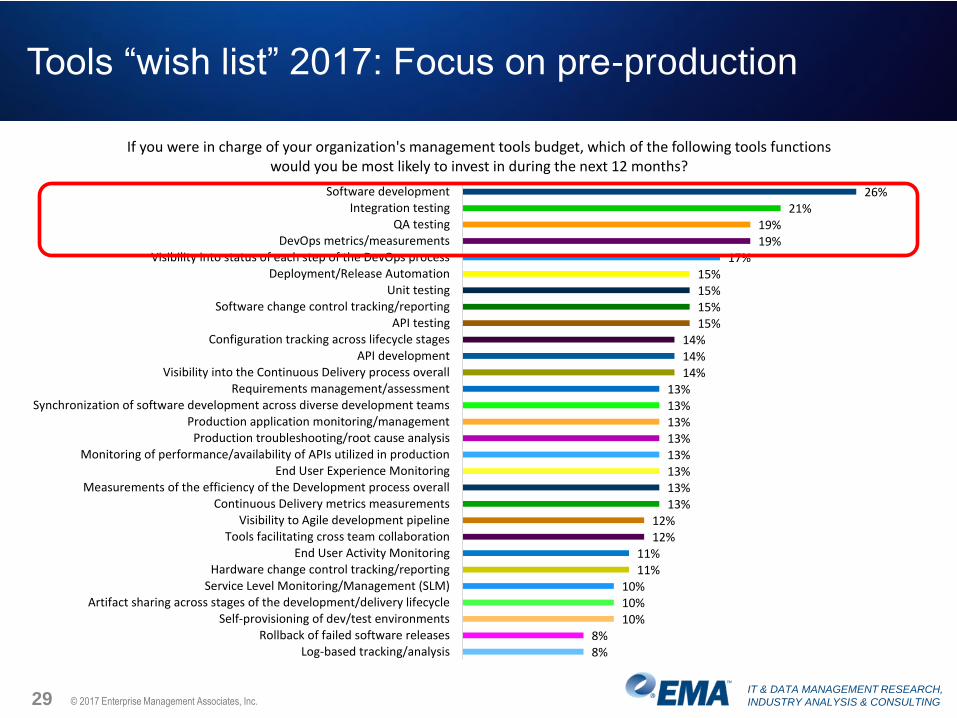
Tools “wish list” 2017: Focus on pre-production
29 © 2017 Enterprise Management Associates, Inc.
26%21%
19%19%
17%15%15%15%15%
14%14%14%
13%13%13%13%13%13%13%13%
12%12%
11%11%
10%10%10%
8%8%
Software developmentIntegration testing
QA testingDevOps metrics/measurements
Visibility into status of each step of the DevOps processDeployment/Release Automation
Unit testingSoftware change control tracking/reporting
API testingConfiguration tracking across lifecycle stages
API developmentVisibility into the Continuous Delivery process overall
Requirements management/assessmentSynchronization of software development across diverse development teams
Production application monitoring/managementProduction troubleshooting/root cause analysis
Monitoring of performance/availability of APIs utilized in productionEnd User Experience Monitoring
Measurements of the efficiency of the Development process overallContinuous Delivery metrics measurements
Visibility to Agile development pipelineTools facilitating cross team collaboration
End User Activity MonitoringHardware change control tracking/reporting
Service Level Monitoring/Management (SLM)Artifact sharing across stages of the development/delivery lifecycle
Self-provisioning of dev/test environmentsRollback of failed software releases
Log-based tracking/analysis
If you were in charge of your organization's management tools budget, which of the following tools functions would you be most likely to invest in during the next 12 months?
IT & DATA MANAGEMENT RESEARCH,
INDUSTRY ANALYSIS & CONSULTING
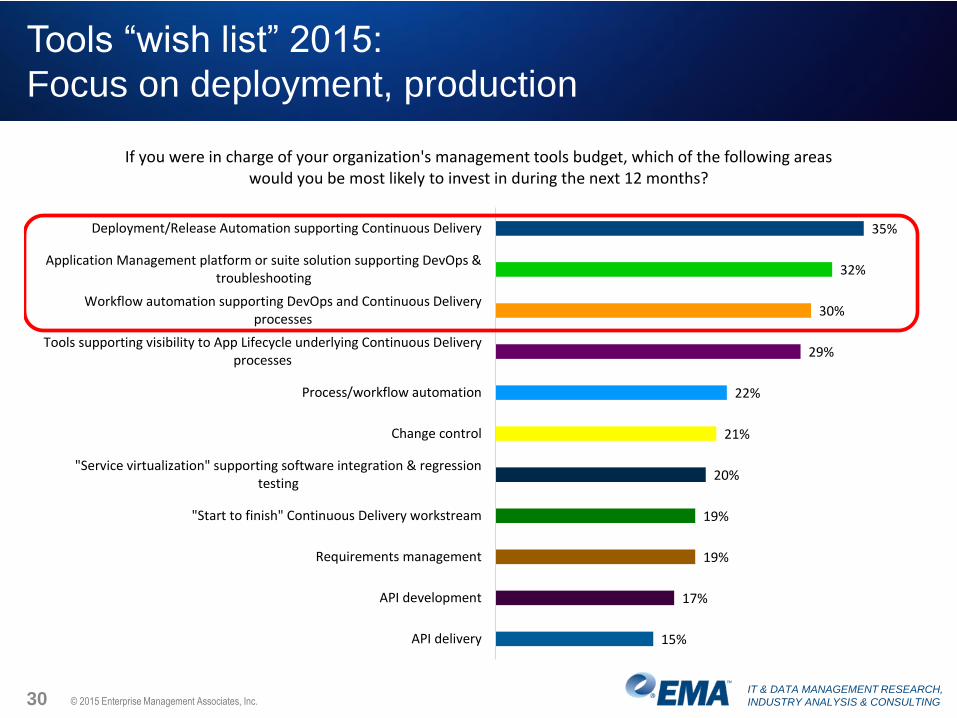
Tools “wish list” 2015:
Focus on deployment, production
30 © 2015 Enterprise Management Associates, Inc.
35%
32%
30%
29%
22%
21%
20%
19%
19%
17%
15%
Deployment/Release Automation supporting Continuous Delivery
Application Management platform or suite solution supporting DevOps &troubleshooting
Workflow automation supporting DevOps and Continuous Deliveryprocesses
Tools supporting visibility to App Lifecycle underlying Continuous Deliveryprocesses
Process/workflow automation
Change control
"Service virtualization" supporting software integration & regressiontesting
"Start to finish" Continuous Delivery workstream
Requirements management
API development
API delivery
If you were in charge of your organization's management tools budget, which of the following areas would you be most likely to invest in during the next 12 months?
IT & DATA MANAGEMENT RESEARCH,
INDUSTRY ANALYSIS & CONSULTING
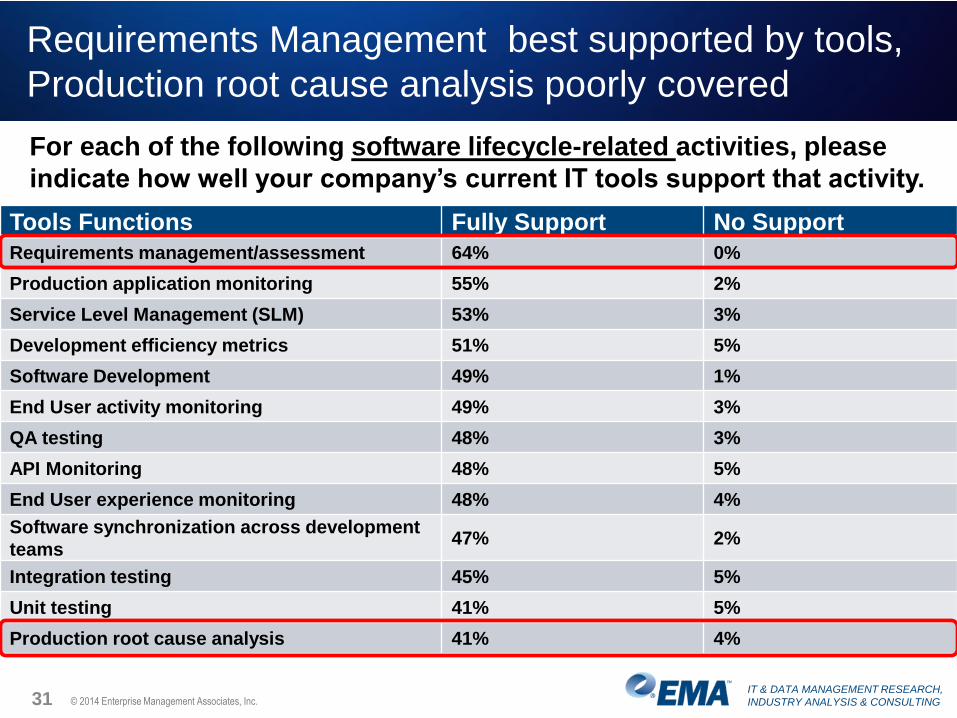
Requirements Management best supported by tools,
Production root cause analysis poorly covered
31 © 2014 Enterprise Management Associates, Inc.
Tools Functions Fully Support No Support
Requirements management/assessment 64% 0%
Production application monitoring 55% 2%
Service Level Management (SLM) 53% 3%
Development efficiency metrics 51% 5%
Software Development 49% 1%
End User activity monitoring 49% 3%
QA testing 48% 3%
API Monitoring 48% 5%
End User experience monitoring 48% 4%
Software synchronization across development
teams47% 2%
Integration testing 45% 5%
Unit testing 41% 5%
Production root cause analysis 41% 4%
For each of the following software lifecycle-related activities, please
indicate how well your company’s current IT tools support that activity.
IT & DATA MANAGEMENT RESEARCH,
INDUSTRY ANALYSIS & CONSULTING
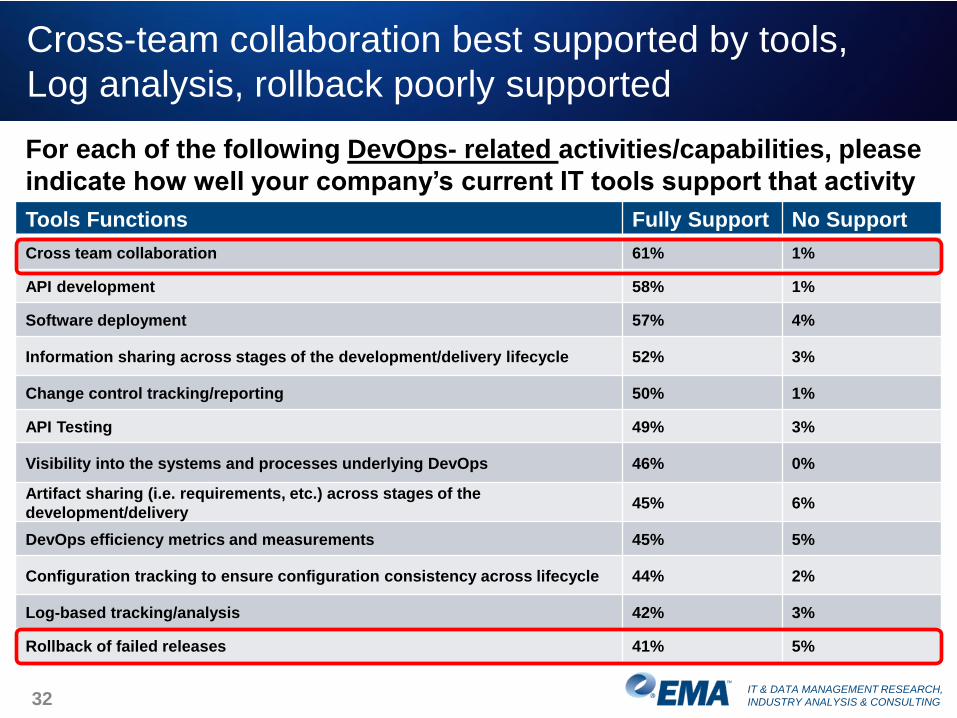
Cross-team collaboration best supported by tools,
Log analysis, rollback poorly supported
32
Tools Functions Fully Support No Support
Cross team collaboration 61% 1%
API development 58% 1%
Software deployment 57% 4%
Information sharing across stages of the development/delivery lifecycle 52% 3%
Change control tracking/reporting 50% 1%
API Testing 49% 3%
Visibility into the systems and processes underlying DevOps 46% 0%
Artifact sharing (i.e. requirements, etc.) across stages of the
development/delivery 45% 6%
DevOps efficiency metrics and measurements 45% 5%
Configuration tracking to ensure configuration consistency across lifecycle 44% 2%
Log-based tracking/analysis 42% 3%
Rollback of failed releases 41% 5%
For each of the following DevOps- related activities/capabilities, please
indicate how well your company’s current IT tools support that activity
IT & DATA MANAGEMENT RESEARCH,
INDUSTRY ANALYSIS & CONSULTING
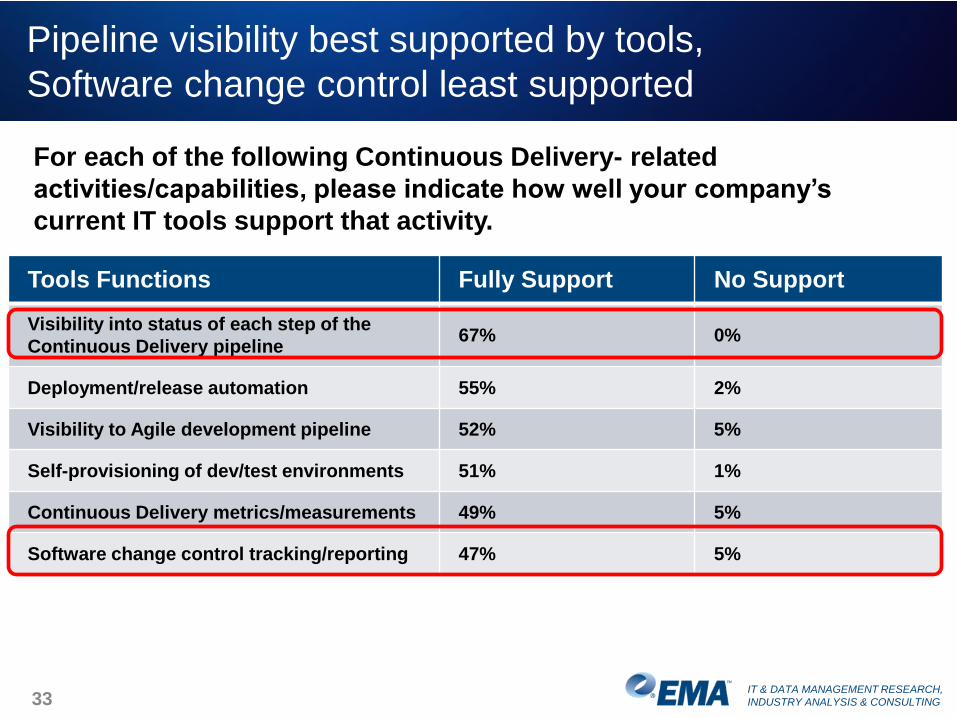
Pipeline visibility best supported by tools,
Software change control least supported
33
Tools Functions Fully Support No Support
Visibility into status of each step of the
Continuous Delivery pipeline67% 0%
Deployment/release automation 55% 2%
Visibility to Agile development pipeline 52% 5%
Self-provisioning of dev/test environments 51% 1%
Continuous Delivery metrics/measurements 49% 5%
Software change control tracking/reporting 47% 5%
For each of the following Continuous Delivery- related
activities/capabilities, please indicate how well your company’s
current IT tools support that activity.
IT & DATA MANAGEMENT RESEARCH,
INDUSTRY ANALYSIS & CONSULTING
Revenue Impacts
• Revenue Impacts
• Wrap up
34 © 2017 Enterprise Management Associates, Inc.
IT & DATA MANAGEMENT RESEARCH,
INDUSTRY ANALYSIS & CONSULTING
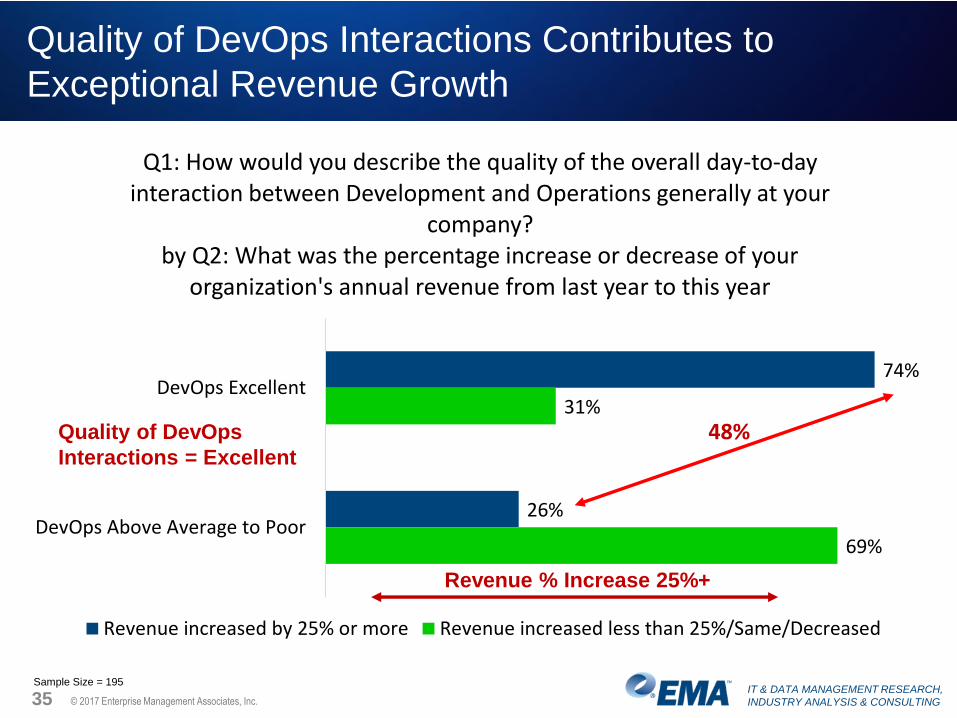
Quality of DevOps Interactions Contributes to
Exceptional Revenue Growth
35 © 2017 Enterprise Management Associates, Inc.
74%
26%
31%
69%
DevOps Excellent
DevOps Above Average to Poor
Q1: How would you describe the quality of the overall day-to-day interaction between Development and Operations generally at your
company?by Q2: What was the percentage increase or decrease of your
organization's annual revenue from last year to this year
Revenue increased by 25% or more Revenue increased less than 25%/Same/Decreased
Quality of DevOps
Interactions = Excellent
48%
Sample Size = 195
Revenue % Increase 25%+
IT & DATA MANAGEMENT RESEARCH,
INDUSTRY ANALYSIS & CONSULTING
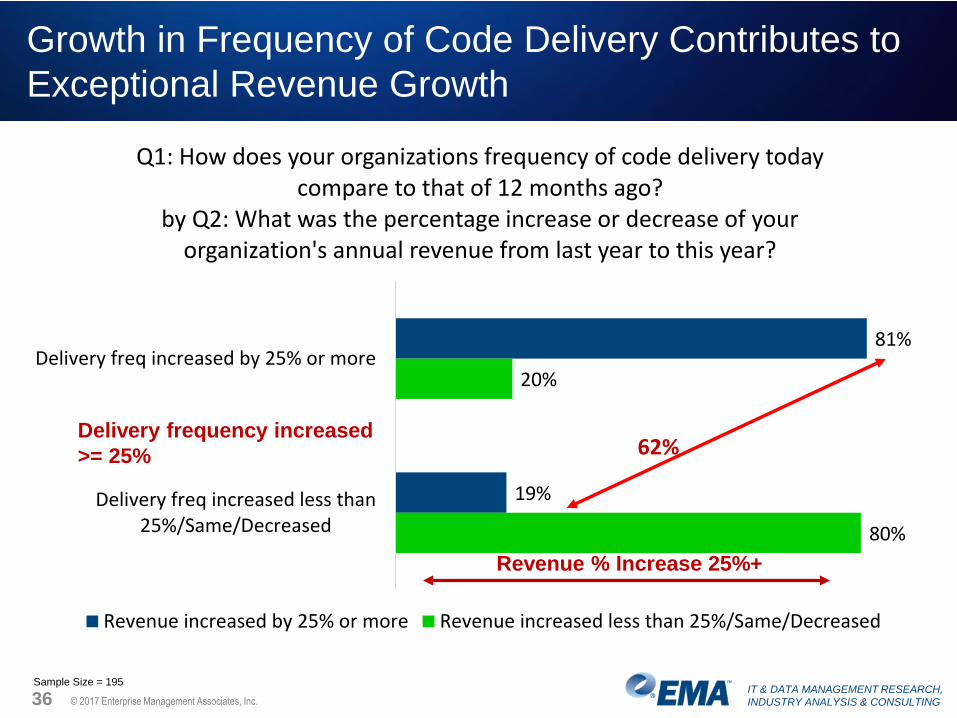
Growth in Frequency of Code Delivery Contributes to
Exceptional Revenue Growth
36 © 2017 Enterprise Management Associates, Inc.
81%
19%
20%
80%
Delivery freq increased by 25% or more
Delivery freq increased less than25%/Same/Decreased
Q1: How does your organizations frequency of code delivery today compare to that of 12 months ago?
by Q2: What was the percentage increase or decrease of your organization's annual revenue from last year to this year?
Revenue increased by 25% or more Revenue increased less than 25%/Same/Decreased
Delivery frequency increased
>= 25%
Sample Size = 195
Revenue % Increase 25%+
62%

IT & DATA MANAGEMENT RESEARCH,
INDUSTRY ANALYSIS & CONSULTING
Wrap up
• Wrap up
37 © 2017 Enterprise Management Associates, Inc.
IT & DATA MANAGEMENT RESEARCH,
INDUSTRY ANALYSIS & CONSULTING© 2017 Enterprise Management Associates, Inc.
Questions?
38
Please log your questions
in the Q&A panel