Embed Size (px)
Citation preview
Denver, April 3rd 2013
Adaptation Methods and Bioclimate Scenarios
Nicola Lacetera([email protected])
Alessandro Nardone([email protected])

Italy
Rome

Outline
• Climate scenarios
• Bioclimate scenarios
- Effects of climate on livestock
• Adaptation(s)
• European perspectives
• Take-home messages
• Acknowledgements

IPCC

European temperature (CSI 012/CLIM 001)Assessment published Jun 2012

European temperature (CSI 012/CLIM 001)Assessment published Jun 2012

Segnalini et al., in press
Distribution of Mediterranean summer THI anomalies versus CliNo (climate normal, 1971–2000 period) for the four decades 2011–2020,
2021–2030, 2031–2040, and 2041–2050

Second National Climate Assessment, 2009
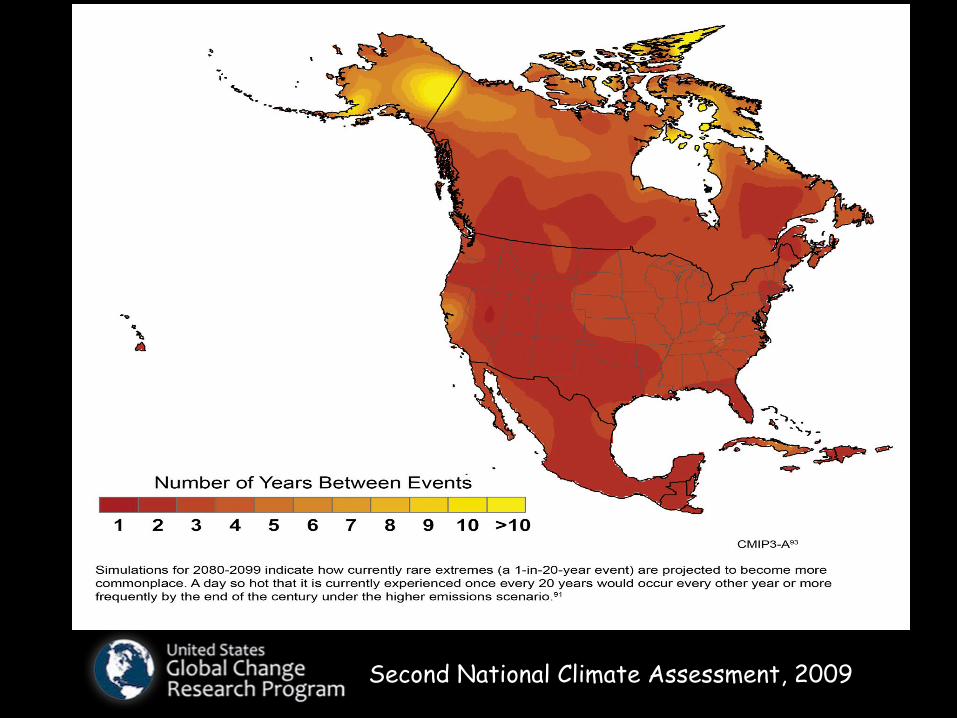
Second National Climate Assessment, 2009

• Bioclimate scenarios
- Effects of climate on livestock

Potential impacts of climate change on livestock behaviour, health, welfare and
performances
Meteorological factors: Feed and pastures• Temperature Parasites and vectors• Humidity• Wind
• Radiation • Precipitation• Barometric pressure
• Air ionization
Livestock
Direct
Indirect

Indirect

Feed and pastures

Alfalfa forage digestibility, quality and yield under future climate change scenarios … # 1 Sanz-Sáez et al., 2012.
Shoot dry matter

Alfalfa forage digestibility, quality and yield under future climate change scenarios… # 2Sanz-Sáez et al., 2012.
Crude protein
IVDMD
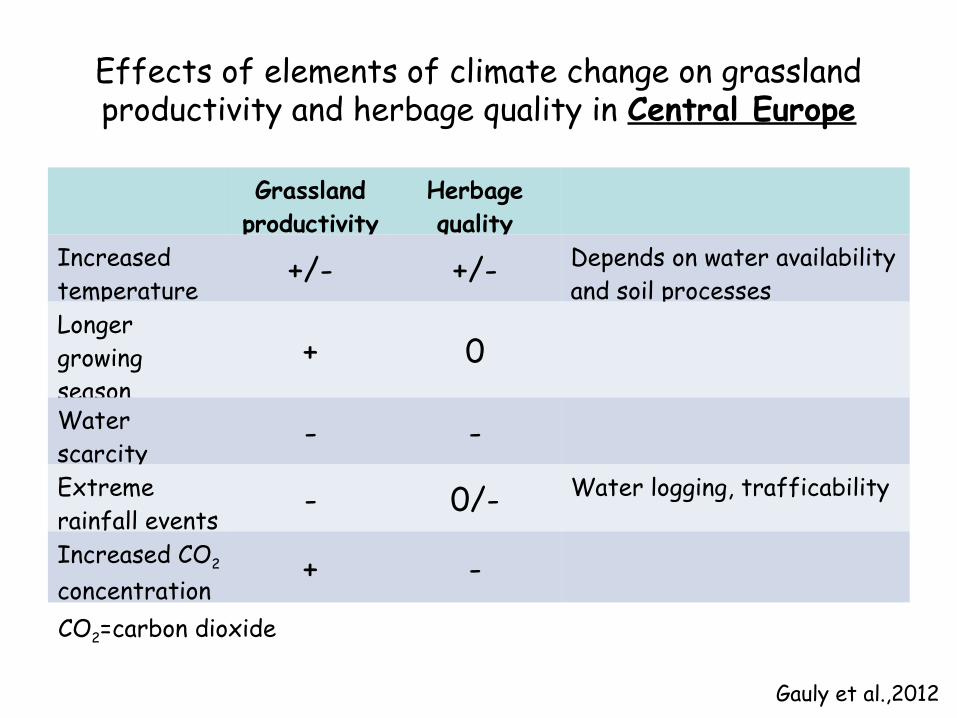
Effects of elements of climate change on grassland productivity and herbage quality in Central Europe
Grassland productivity
Herbage quality
Increased temperature
+/- +/- Depends on water availability and soil processes
Longer growing season
+ 0
Water scarcity
- -Extreme rainfall events
- 0/- Water logging, trafficability
Increased CO2 concentration
+ -
CO2=carbon dioxide
Gauly et al.,2012

Factors affecting mycotoxin occurrence in the food chain (Russell et al., 2010)

Trends of the presence of mycotoxins in cereal grains in North Western Europe over the period 1989-2009 for 3-acetyl-deoxynivalenol (3-Ac-DON) in oats (a),
deoxynivalenol in oats (b) and wheat (c) and of zearalenone in maize (d). The presence of mycotoxins is indicated by the percentage of samples that contained the toxin above the level of detection.
Except for the presence of DON in wheat (c), the effect of year on the presence of the toxin was significant.
Van der Fels-Klerx Hietaniemi et al., 2012
Parasites and vectors

Region No. of outbreaks
Number of animals in the outbreaks
Number of clinical cases
Number of deaths
Number of animals slaugthered
Basilicata 63 4,766 152 16Calabria 427 52,722 10,176 236 9,877Campania 1 64 3 2Lazio 62 23,040 431 69 356Sardegna 6,090 1,294,365 239,178 72,502 159,636Sicilia 6 853 29 29Toscana 158 33,988 693 119 560Total 6,807 1,409,798 250,662 72,973 170,429
Culicoides spp BTV

Wittmann et al., (2001)
Suitability of sites in Europe for the
occurrence of Culicoides imicola
Suitability of sites in Europe for the
occurrence of Culicoides imicola
with a 2° C increase in temperature

Climate change was associated with a
northwards extension, in Europe, of Culicoides
vectors
1998: Northern limit C. imicola midge
2004: Northern limit C. imicola midge
1998: Northern range of virus (in sheep)
2004: Northern range* of virus (in sheep)
Purse et al, 2005
C. pulcaris C. obsoletus C. imicola
Current northern limit
Northern limit < 1998
Northern limit
Southern limit
Midge species: potential vectors of BT Virus

Positive latitudinal shifts indicate movement toward the north (pole); negative values indicate shifts toward the south (Equator). Horizontal lines mark the Median. Open Circles are outliers.
Observed latitudinal shifts (kilometres)
of the northern range boundaries of species belonging to 4 taxonomic groups
(spiders, ground beetles, butterflies and grasshoppers),
studied over 25 years in Britain.

Overview of some of the mosquitoes and vector-borne viruses detected in
Europe in the last five years


Direct


Ongoing climate change: Reduced risk and severity of cold stress in cold climates!

Consequences of heat stress in farm animals
• Reduced growth
• Impaired reproduction
• Altered milk production (quantity and quality)
• Higher risk of diseases (metabolic, infectious, etc.)
• Higher mortality rate

Climate chambers
Rome

Commercial dairy farms
Bioclimatic areas(JJA, 1971-2000)
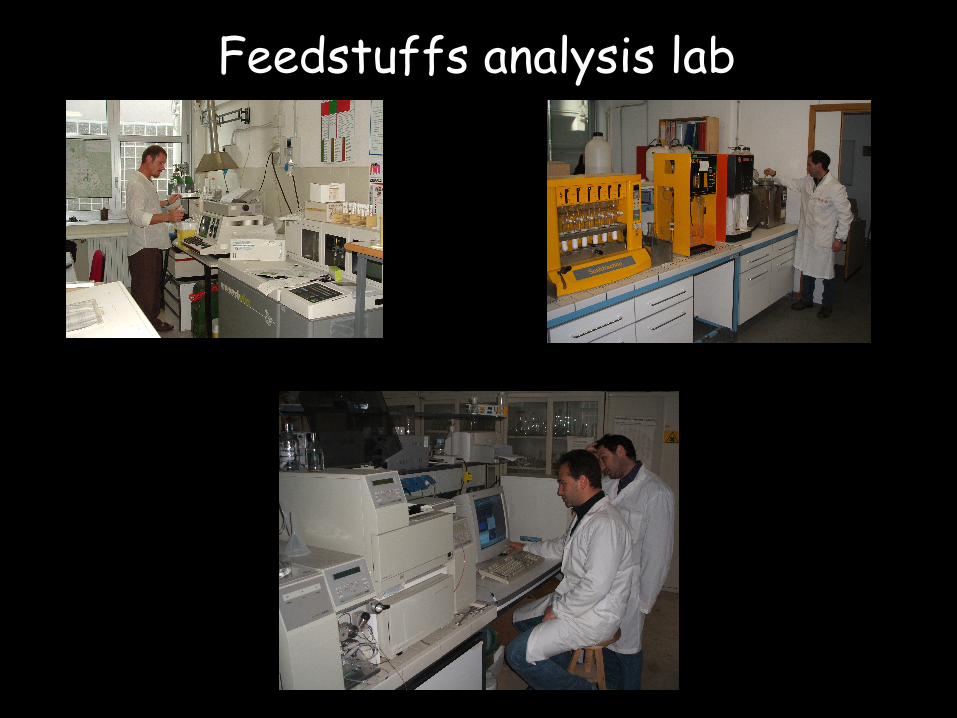
Feedstuffs analysis lab

Clinical biochemistry and immunology labs

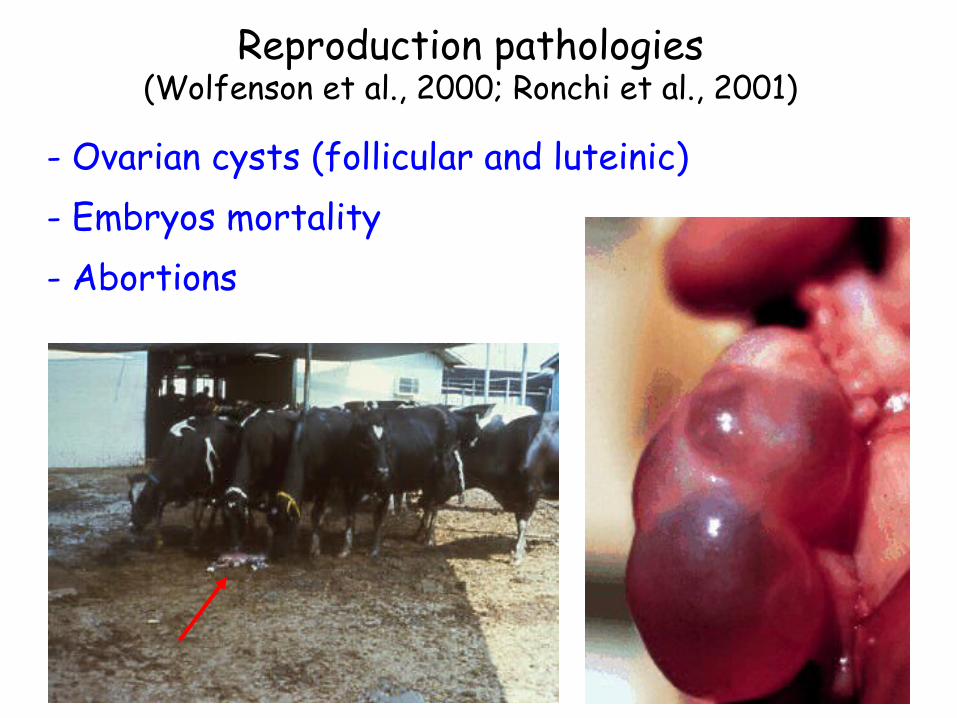
Reproduction pathologies(Wolfenson et al., 2000; Ronchi et al., 2001)
- Ovarian cysts (follicular and luteinic)- Embryos mortality- Abortions


Milk quality
Technological
Hygienic Microbiological
SCCPhysical
Electrical conductivityFreezing pointBoiling point
pH Titratable acidity Specific gravitySurface tension
Viscosity
Nutritional
ChemicalCarbohydrates
LipidsProteinsNPN
VitaminsMinerals, ions and trace elements

6.7
6.8
6.9
7.0
7.1
7.2
7.3
7.4
7.5
J F M A M J J A S O N D
Months
Chee
se y
ield
(%)
100
110
120
130
140
150
160
170
Supp
lied
milk
(q/d
)
3,20
3,25
3,30
3,35
3,40
3,45
3,50
J M M J S NMonths
Soxh
let-
Hen
kel d
egre
es/5
0 m
l
141516171819202122232425
10-giu
20-giu
30-giu
10-lug
20-lug
30-lug
09-ago
19-ago
29-ago
08-set
Days
Clot
ting
tim
e (m
in)
60
65
70
75
80M
ean
daily
TH
I
35
40
45
50
55
60
10-giu
20-giu
30-giu
10-lug
20-lug
30-lug
09-ago
19-ago
29-ago
08-set
18-set
Days
Milk
cre
amin
g (%
)
60
65
70
75
80
Mea
n da
ily T
HI
Adapted from Bernabucci & Calamari, 1998

Milk protein fractions (%) in summer (su) and spring (sp) cows (Bernabucci et al., 2002)
αs-CN β-CN k-CN α-La β-LG sp
SU 1.12A 0.79A 0.27 0.16 0.38 0.29B
SP 1.36B 0.97B 0.25 0.17 0.38 0.18A
A,B = P < 0.01

“High ambient temperatures are associated with higher incidence of health problems”(Martin et al., 1975; Webster et al., 1983; Silanikove, 2000; Kadzere et al., 2002; Lopes-Gatius et al., 2002)

BCS changes in spring (sp) and summer (su) transition dairy cows
1.0
1.5
2.0
2.5
3.0
3.5
4.0
-30 -25 -20 -15 -10 -5 0 5 10 15 20 25 30 35
Days from calving
BCS
BCS-sp BCS-su
** ****b
a a
bc c
a a a
b
a
b
Bernabucci et al., 2005

Plasma NEFA in spring and summer cows
0.2
0.3
0.4
0.5
0.6
0.7
0.8
LBCS MBCS HBCS LBCS MBCS HBCS
A
B
C
BB
AB
Summer Spring
BCS groups
mm
ol/l

0.3
0.5
0.7
0.9
1.1
0 10 20 30 40 50
Days of lactation
BHBA
(mmol/l)
TC
WE
Lacetera et al., 1996
* * *
Post-calving plasma BHBA in cows kept under Thermal comfort or Warm
environment

Cows pant to cool off
Respiratory Alkalosis (CO2)Bicarbonate excretion in the urineLoss of saliva from drooling
Metabolic Acidosis
Abnormal blood flow in the feet
Increased standingtime
Weakened hooves: connective tissue breaks down; developing hoof horn is of poor quality; bloody areas or abscesses may develop on sole
LAMENESS
(Shearer, 1999)

• Changes in geographical ranges and incidence of vector-borne disease
• Changed incidence of diarrheal and other infectious diseases
• Malnutrition and hunger, and consequent impairment of child growth and development
• Increased risk of infectious disease, psychological disorders
• Asthma and allergies; other acute and chronic respiratory disorders and deaths
• Wide range of public health consequences: mental health and nutritional impairment, infectious diseases, civil strife
• Disturbances of ecological systems: effect on range and activity of vectors and infective parasites
• Changed local ecology of water-borne and food-borne infective agents
• Changed food productivity (especially crops) through changes in climate and associated pests and diseases
• Sea level rise with population displacement and damage to infrastructure
• Biological impact of air pollution changes (including pollens and spores); improper actions to reduce GHG emissions
• Social, economic, and demographic dislocation through effects on economy, infrastructure, and resource supply
Indirect effects
• Changes rates of illness and death related to heat and cold
• Deaths, injuries, psychological disorders; damage to public health infrastructure
• Thermal stress (altered immunity)
• Changed frequency or intensity of extreme and less severe weather events
Direct effectsHealth outcomeMediating process
MEDIATING PROCESSES AND DIRECT/INDIRECT HEALTH EFFECTS
Adapted from McMichael, A.J., A. Haines, R. Sloof, and S. Kovats (eds),(1996). Climate Change and Human Health (Geneva: WHO, WMO, UNEP)

Post-colostral increase of plasma Ig in Holstein calves (Lacetera, 1998)
0
5
10
15
20
0 4 8 12 16 20 24 36
Hours of life
Plas
ma I
g, g
/l
__ Thermal comfort
__ Heat stress
**

00.5
11.5
22.5
3
-28 -21 -14 -7 +7 +14 +28
0
1
2
3
4
-28 -21 -14 -7 +7 +14 +28
-0.5
0
0.5
1
1.5
2
2.5
-28 -21 -14 -7 +7 +14 +28
PHA
Con-A
PWM
Time relative to parturition (d)
DNA s
ynth
esis (OD)
Summer
Spring
* * * * *
* * * *
* * * **
(Modified from Lacetera et al., 2005)
RT: > 40 C°RR: > 80 breaths.minute

SP: either day-time (9-20 h) or night-time (21-8 h) THI were below the UCTHI (72) SU: daytime and night-time THI were 79.5 ± 2.9 and 70.1 ± 4.7, respectively
THI data(summer 2003)
Heat wave - Duration (d) - Max THI - Mean THI > 72
1 5 83.4 78.9 2 6 85.8 79.1 3 15 90.5 79

Isolines of summer temperature humidity index (THI) anomalies for the year 2003 versus CliNo (Climate Normal, 1961-1990 period)
Segnalini et al., 2011
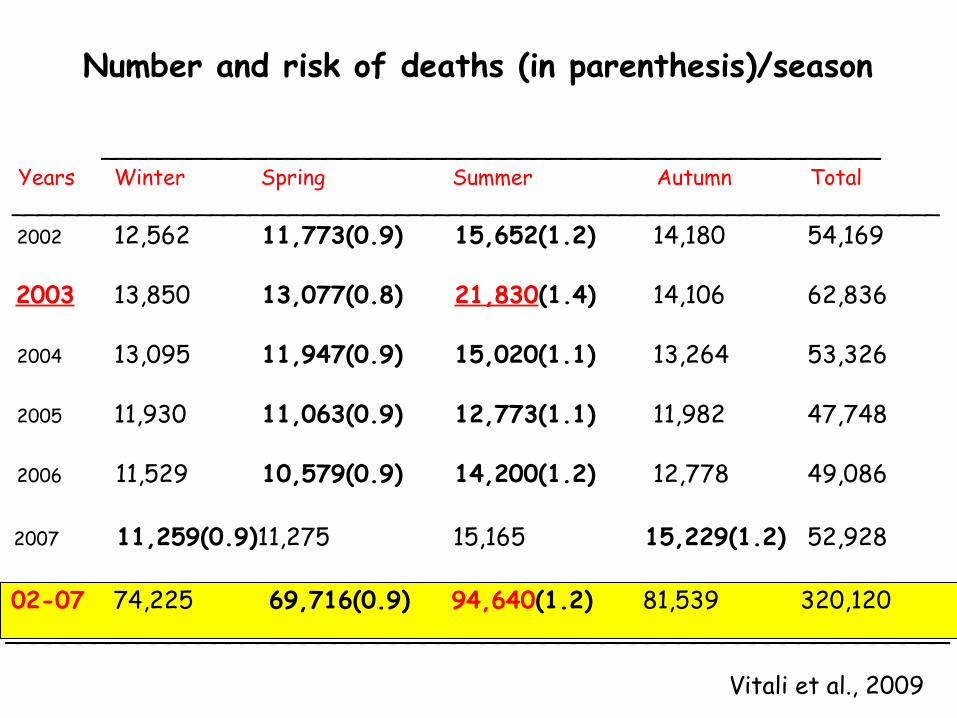
____________________________________________________ Years Winter Spring Summer Autumn Total ______________________________________________________________________ 2002 12,562 11,773(0.9) 15,652(1.2) 14,180 54,169
2003 13,850 13,077(0.8) 21,830(1.4) 14,106 62,836
2004 13,095 11,947(0.9) 15,020(1.1) 13,264 53,326
2005 11,930 11,063(0.9) 12,773(1.1) 11,982 47,748
2006 11,529 10,579(0.9) 14,200(1.2) 12,778 49,086
2007 11,259(0.9)11,275 15,165 15,229(1.2) 52,928
02-07 74,225 69,716(0.9) 94,640(1.2) 81,539 320,120_______________________________________________________________
Number and risk of deaths (in parenthesis)/season
Vitali et al., 2009
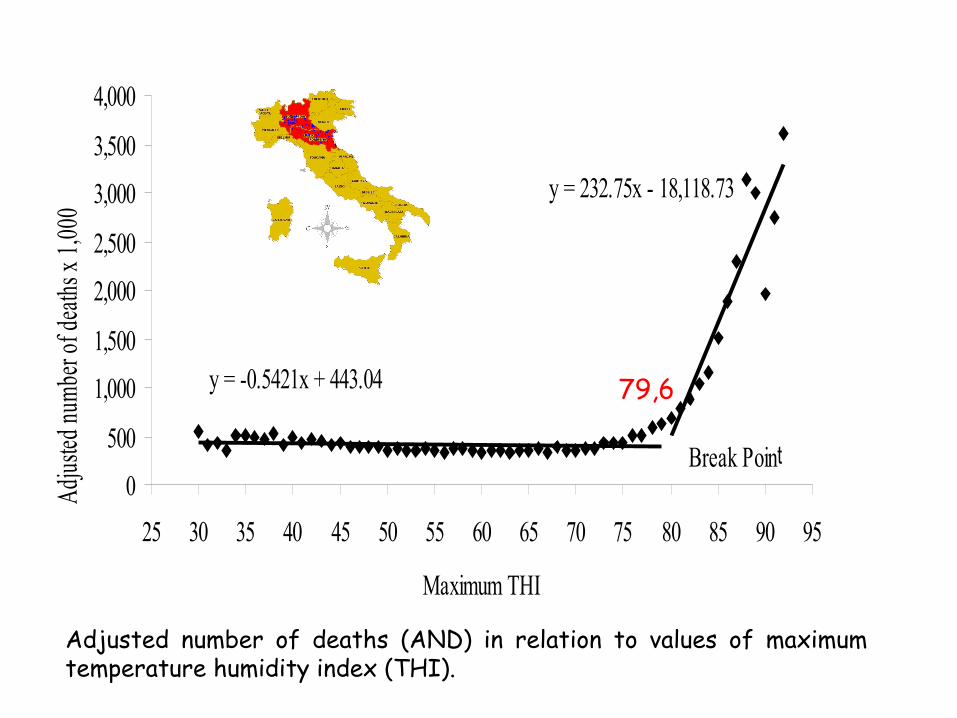
y = 232.75x - 18,118.73
y = -0.5421x + 443.04
0
500
1,000
1,500
2,000
2,500
3,000
3,500
4,000
25 30 35 40 45 50 55 60 65 70 75 80 85 90 95
Maximum THI
Adju
sted
num
ber o
f dea
ths x
1,0
00
§§
Break Point
79,6
Adjusted number of deaths (AND) in relation to values of maximum temperature humidity index (THI).
0
500
1,000
1,500
2,000
2,500
3,000
3,500
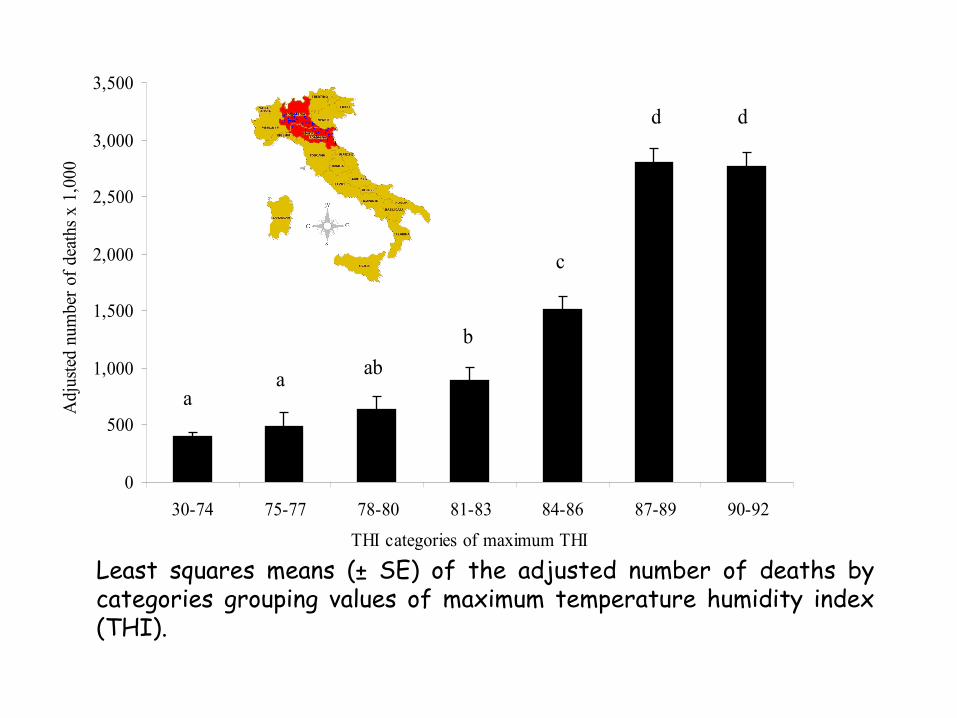
30-74 75-77 78-80 81-83 84-86 87-89 90-92
THI categories of maximum THI
Adj
uste
d nu
mbe
r of
dea
ths
x 1,
000
a
dd
c
aba
b
Least squares means (± SE) of the adjusted number of deaths by categories grouping values of maximum temperature humidity index (THI).

Descriptive statistics of two pig studies
Study period (years) 2003-2007Geographic area North Italy
Seasonal pattern studyNumber of journeys 24,099Number of in-transit pigs 3,676,153Number of farms 1,618Number of in-transit losses 1,161Number of lairage losses 675THI-mortality relationships studyNumber of journeys 14,316Number of in-transit pigs 2,156,322Number of farms 1,209Number of in-transit losses 664Number of lairage losses 399
Vitali et al., 2010

95% confidence interval (CI) estimates of risk ratios (RR) for season in heavy pigs died during transport to the slaughter house and in lairage
RR 95% CI P value
TransportWinter 0.716 0.566 - 0.905 0.005375
Spring 0.565 0.435 - 0.734 0.000019
Summer 1.107 1.008 - 1.217 0.033166
Fall 1.023 0.906 - 1.154 0.708065
LairageWinter 0.645 0.465 - 0.894 0.008624
Spring 0.575 0.409 - 0.808 0.001437
Summer 1.143 1.011 - 1.292 0.031910
Fall 0.973 0.828 - 1.144 0.745810

In-transit mortality rate of pigs in relation to temperature-humidity index (THI).
Two phases regression_in transit pigs losses
0
2
4
6
8
10
31 34 37 40 43 46 49 52 55 58 61 64 67 70 73 76 79 82
THI
Mor
talit
y ra
te *
1000
0
y=1,47827+0,02095 * THI y'=-109,20+1,43013 * THI Mortality rate_moving average
Break point a THI = 78,54
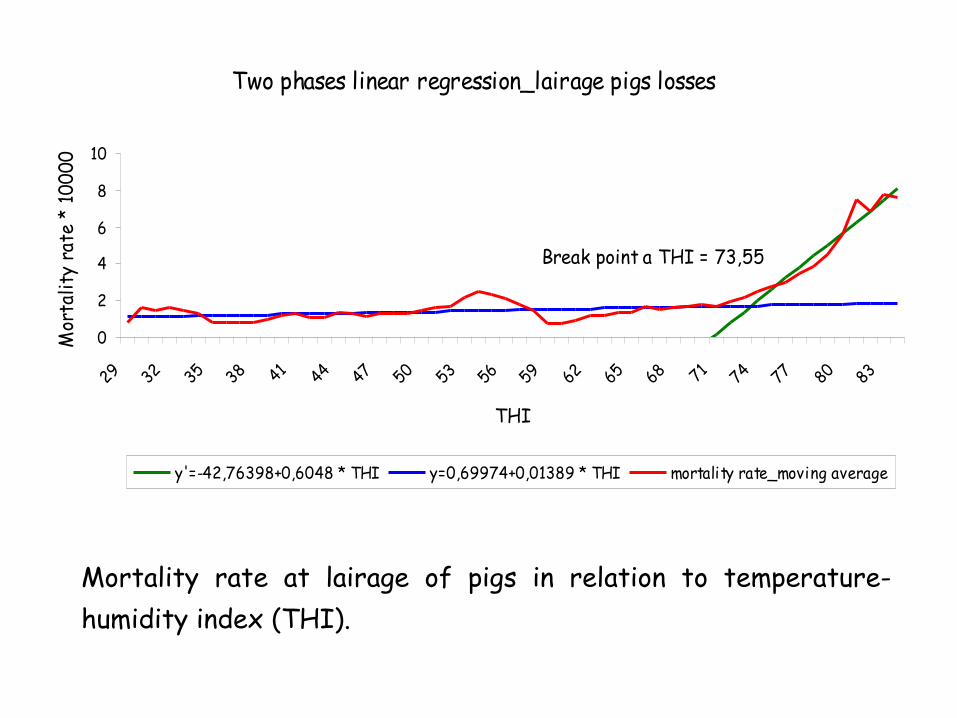
Mortality rate at lairage of pigs in relation to temperature-humidity index (THI).
Two phases linear regression_lairage pigs losses
0
2
4
6
8
10
29 32 35 38 41 44 47 50 53 56 59 62 65 68 71 74 77 80 83
THI
Mor
talit
y ra
te *
100
00
y'=-42,76398+0,6048 * THI y=0,69974+0,01389 * THI mortality rate_moving average
Break point a THI = 73,55
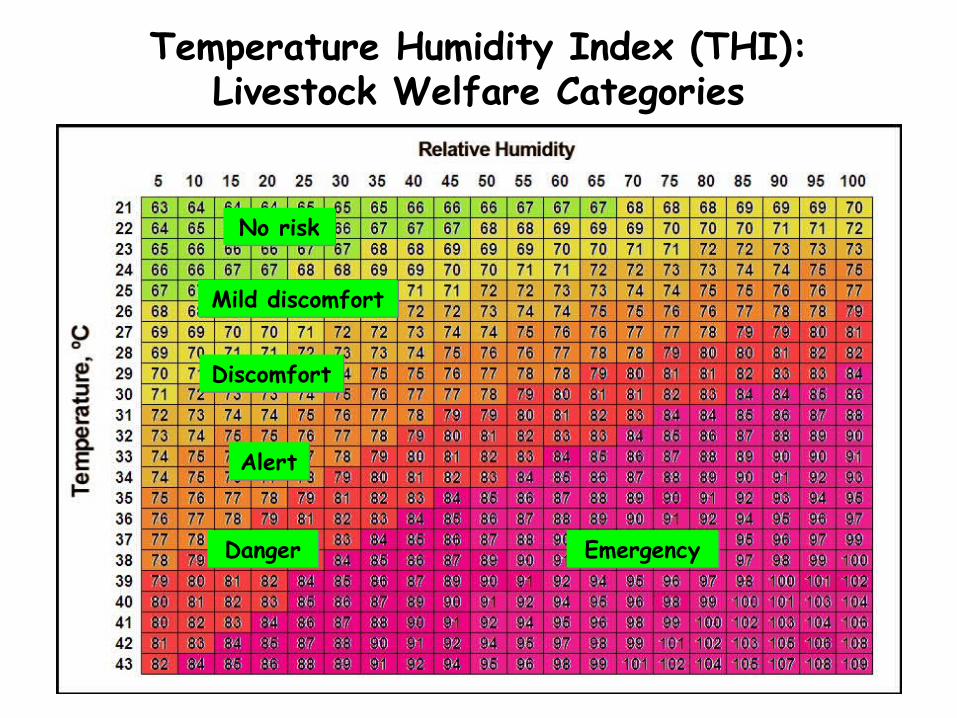
No riskNo risk
Mild discomfortMild discomfort
DiscomfortDiscomfort
AlertAlert
DangerDanger EmergencyEmergency
Temperature Humidity Index (THI):Livestock Welfare Categories

Maps of summer THI expressed as livestock welfare categories for CliNo period (1971-2000) and the decades 2011-2020, 2021-2030, 2031-2040, and 2041-2050.Different colors correspond to different livestock welfare categories: THI < 68, 68 ≤ THI < 72, 72 ≤ THI < 75,75 ≤ THI < 79, 79 ≤ THI < 84, and THI ≥ 84.
Segnalini et al., in press
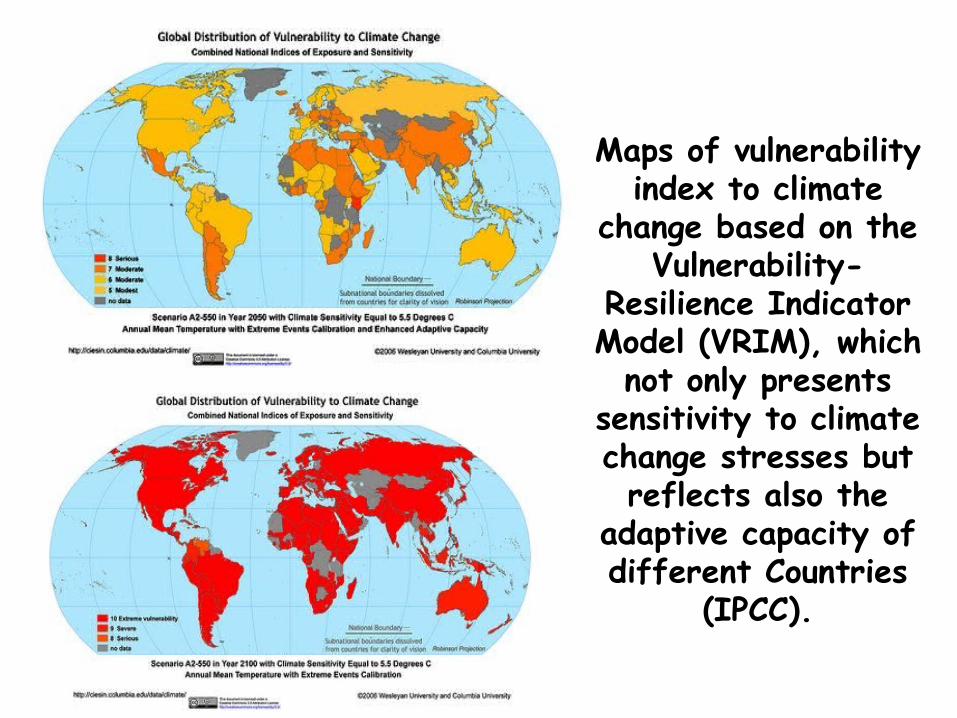
Maps of vulnerability index to climate
change based on the Vulnerability-
Resilience Indicator Model (VRIM), which
not only presents sensitivity to climate change stresses but reflects also the
adaptive capacity of different Countries
(IPCC).

Potentially independent
Partially dependent
Totally dependent
CLIMATE
Mixed
SYSTEMS
Industrialized/landless
Grazing/pastoral
RainfedIrrigated
Climate dependence/vulnerability of livestock systems
Nardone et al., 2010

Global warming affects GHG emissions from livestock systems
1. Lower quality of feedstuffs: ↑ CH4 emissions from EF.
2. Reduced efficiency in feed utilization due to heat stress: ↑ CH4 emissions from EF.
3. Reduced life expectancy: a rapid turnover of milkers means that energy inputs and GHG outputs are ‘wasted’ in the process of rearing heifers before they reach first pregnancy and lactation.4. Higher mortality rate: ↑ emissions of GHG for disposal of carcasses.5. Higher environmental temperatures: ↑ N2O emission from manure.6. Less need for warming in cold climates: ↓ on farm fossil fuel need.
• Adaptations

Adaptation (definitions)
• IPCC: Adjustment in natural or human systems in response to actual or expected climatic stimuli or their effects, which moderates harm or exploits beneficial opportunities.
• European Commission: Cost-effective actions taken to cope with a changing climate and aimed at reducing the risk and damage from current and future impacts.
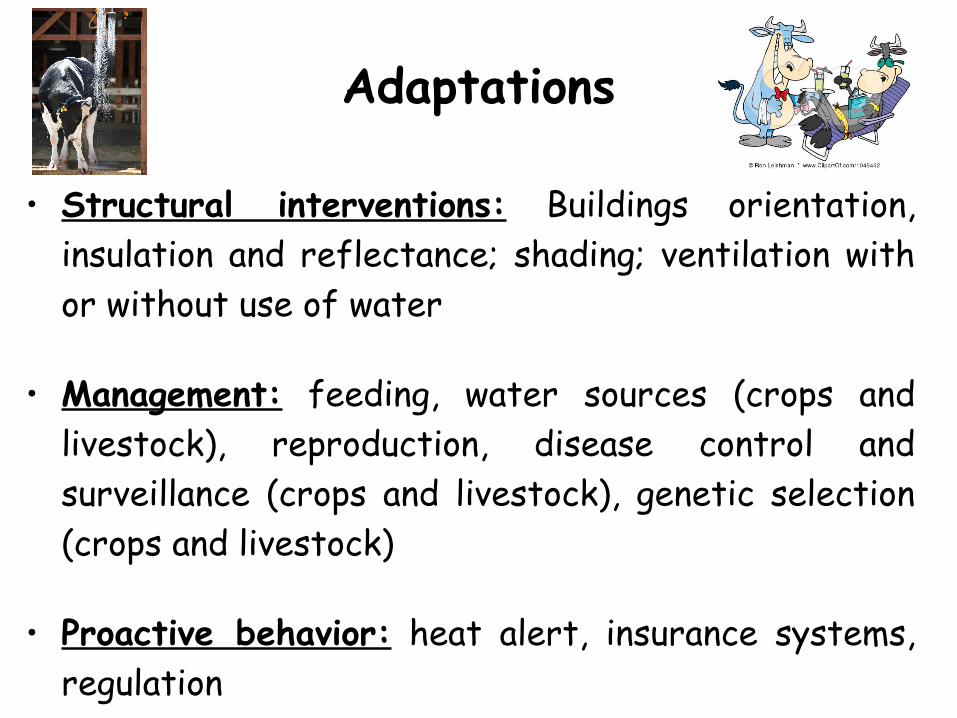
• Structural interventions: Buildings orientation, insulation and reflectance; shading; ventilation with or without use of water
• Management: feeding, water sources (crops and livestock), reproduction, disease control and surveillance (crops and livestock), genetic selection (crops and livestock)
• Proactive behavior: heat alert, insurance systems, regulation
Adaptations

Administration of high doses of Vitamin E and Selenium in late pregnant-summer dairy cows
DIM DIM
DIM
Milk
/litre
s
(Bernabucci et al., unpublished)
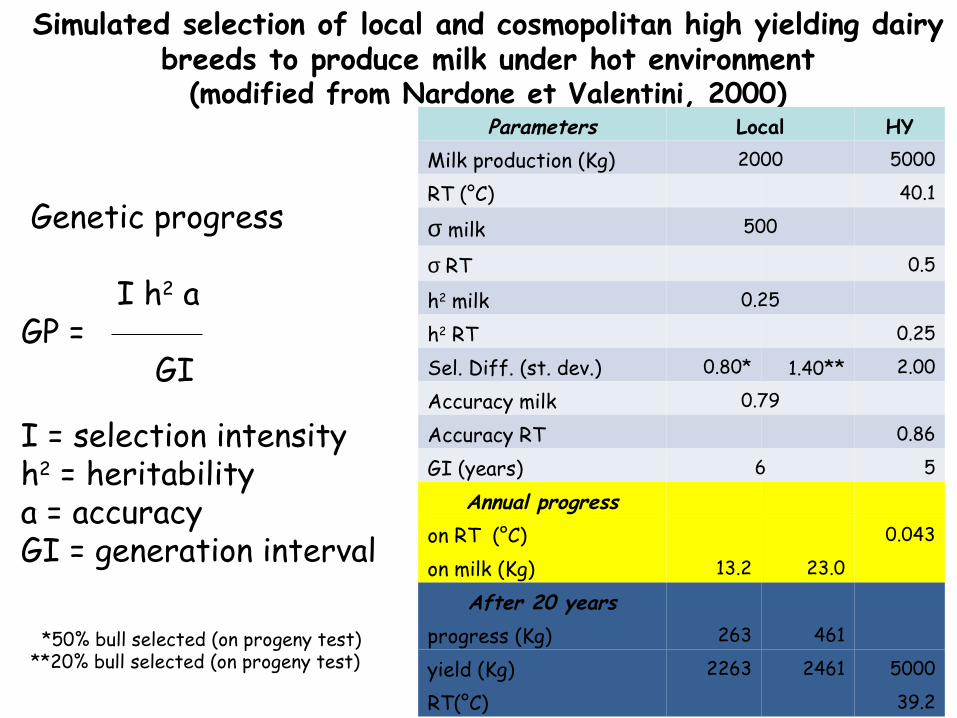
Simulated selection of local and cosmopolitan high yielding dairy breeds to produce milk under hot environment
(modified from Nardone et Valentini, 2000)
Genetic progress
I h2 aGP = GI
I = selection intensityh2 = heritabilitya = accuracyGI = generation interval
*50% bull selected (on progeny test)**20% bull selected (on progeny test)
Parameters Local HYMilk production (Kg) 2000 5000
RT (°C) 40.1
σ milk 500
σ RT 0.5
h2 milk 0.25
h2 RT 0.25
Sel. Diff. (st. dev.) 0.80* 1.40** 2.00
Accuracy milk 0.79
Accuracy RT 0.86
GI (years) 6 5
Annual progresson RT (°C) 0.043
on milk (Kg) 13.2 23.0
After 20 yearsprogress (Kg) 263 461
yield (Kg) 2263 2461 5000
RT(°C) 39.2

Milk yield: ranking of the first 50 Italian Holstein bulls based on EBV calculated with or without considering THI
Sire RANK EBV RANK THIS26 26 21S27 27 36S28 28 28S29 29 22S30 30 39S31 31 33S32 32 29S33 33 41S34 34 38S35 35 42S36 36 34S37 37 24S38 38 37S39 39 47S40 40 45S41 41 35S42 42 46S43 43 50S44 44 82S45 45 32S46 46 31S47 47 48S48 48 40S49 49 55S50 50 59
Sire RANK EBV RANK THIS1 1 1S2 2 3S3 3 2S4 4 5S5 5 8S6 6 4S7 7 6S8 8 10S9 9 7S10 10 9S11 11 11S12 12 14S13 13 13S14 14 17S15 15 16S16 16 23S17 17 25S18 18 12S19 19 27S20 20 19S21 21 15S22 22 30S23 23 26S24 24 20S25 25 18
(Bernabucci et al., submitted)

Milk protein: ranking of the first 50 Italian Holstein bulls based on EBV calculated with or without considering THI
Sire RANK EBV RANKTHIS26 26 17S27 27 25S28 28 30S29 29 28S30 30 36S31 31 32S32 32 29S33 33 33S34 34 31S35 35 38S36 36 37S37 37 35S38 38 40S39 39 43S40 40 34S41 41 41S42 42 39S43 43 42S44 44 44S45 45 45S46 46 48S47 47 47S48 48 46S49 49 56S50 50 49
Sire RANK EBV RANK THIS1 1 1S2 2 2S3 3 5S4 4 3S5 5 7S6 6 6S7 7 4S8 8 11S9 9 9S10 10 8S11 11 10S12 12 12S13 13 13S14 14 15S15 15 21S16 16 14S17 17 19S18 18 23S19 19 22S20 20 18S21 21 20S22 22 24S23 23 26S24 24 16S25 25 27

Prediction of sires’ EBV for milk yield as a function of temperature-humidity index (THI)
for the first ten ranked bulls
Sire rank within
76 THIEBV
Sire rank at 83 THIS1 3.64 4
S2 2.72 8S3 2.61 10S4 2.58 3S5 2.46 9S6 2.45 2S7 2.43 1S8 2.42 5S9 2.35 6S10 2.05 7
-20.0
-15.0
-10.0
-5.0
0.0
5.0
70 71 72 73 74 75 76 77 78 79 80 81 82 83
Mil
k y
ield
, kg/
day
THI
S1
S2
S3
S4
S5
S6
S7
S8
S9
S10
Stan
dard
ized
milk
yie
ld (k
g)/T
HI
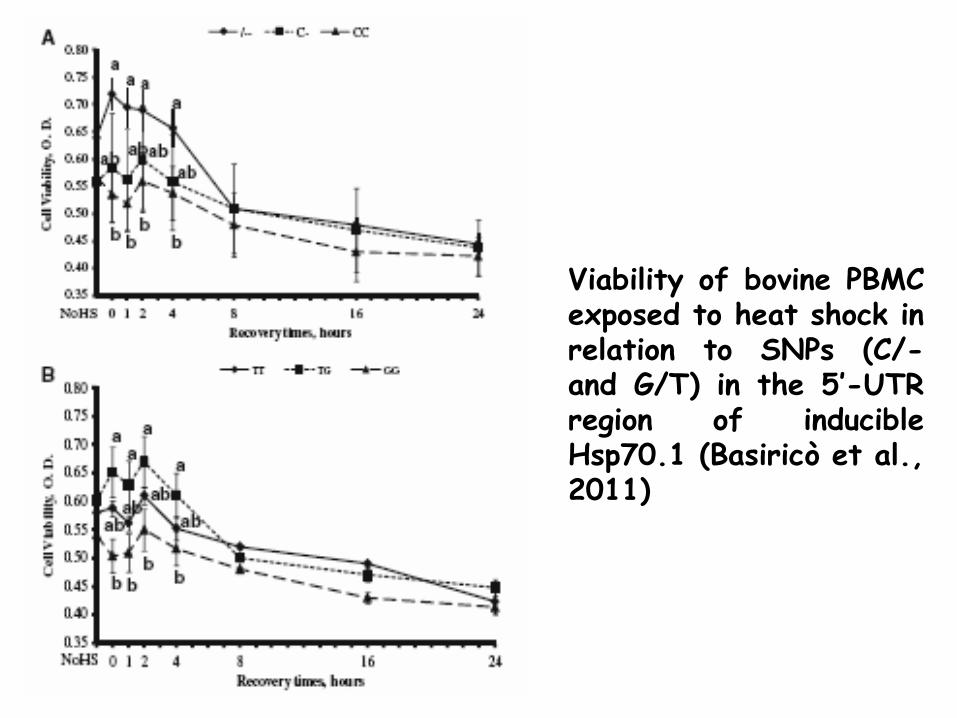
Viability of bovine PBMC exposed to heat shock in relation to SNPs (C/- and G/T) in the 5′-UTR region of inducible Hsp70.1 (Basiricò et al., 2011)

• European perspectives

http://ec.europa.eu/clima/sites/change/what_is_eu_doing/index_en.htm
• The EU’s role:• Spreading knowledge on climate change
impacts and risks;• Providing guidance on best approaches;• Coordinating national activities,
particularly when impacts cross borders such as in river basins;
• Adopting legislation and targets;• Providing funding.

European Commission→Agriculture and Rural Development→Climate change
http://ec.europa.eu/agriculture/climate-change/index_en.htm
Projected impacts from climate change in different EU regions

http://ec.europa.eu/clima/sites/change/what_is_eu_doing/agriculture_en.htm
Finding ways of adapting to climate change will be crucial for the agricultural sector in the years to come. Coupling adaptation efforts to climate-change mitigation efforts will enable farmers to work with, and not against, the environment.
Measures include:
• Introducing crop rotation to make the most of the available water;• Rewarding farmers who carry out sustainable practices;• Using different crop varieties which are more resistant to heat or
drought;• Altering sowing dates and other practices to adapt to changing
weather patterns;• Modernizing farm buildings and machinery to make them more
energy efficient;• Providing more information and training to keep farmers informed
on climate change impacts.

Seventh Framework Programme (FP7)
Community Research and Development Information Service ( CORDIS):http://cordis.europa.eu/fp7/projects_en.html
- 116 Projects with Climate Change + Adaptation
- 37 Projects with Climate Change + Scenario
- 9 Projects with Climate Change + Scenario + Adaptation
- 3 Projects with Climate Change + Scenario + Agriculture - 25 Projects with Climate Change + Adaptation + Agriculture - 2 Projects with Climate Change + Scenario + Adaptation + Agriculture

1. CLIMSAVETitle: Climate change integrated assessment methodology for cross-sectorial adaptation and vulnerability in EuropeResearch area: ENV.2009.1.1.6.1 Integrated methodology providing a common platform for an improved assessment of climate change impacts vulnerability and related cost effective adaptation measuresProject start date: [2010-01-01]
2. IMPACT2CTitle: Quantifying projected impacts under 2°C warmingResearch area: ENV.2011.1.1.6-1 Impacts of a global temperature increase up to 2°C from pre-industrial level, in Europe and most vulnerable regions of the worldProject start date: [2011-10-01]
Seventh Framework Programme (FP7)
• Take Home Messages
• Analysis of regional bioclimate scenarios may help farmers, nutritionists, veterinarians, and policy-makers to develop appropriate anticipatory adaptation strategies to limit the consequences of climate change for the livestock sector
• Bioclimate scenarios indicate that climate changes will impact dramatically on animal health, welfare and performances
• Need for regional economic analysis aimed at establishing costs and potential benefits of anticipatory adaptation actions in a context of economic and bioclimate uncertainty

• AcknowledgementsAcademic- Loredana Basiricò- Umberto Bernabucci- Patrizia Morera- Bruno Ronchi
Clinical biochemistry and immunology labs- Piero Bondi- Giorgina Kuzminsky
Feedstuffs analysis lab - Corrado BrutiPost-doc students
- Maria Segnalini- Andrea Vitali
Major fundings- CNR - EU- MiPAF (Agriculture)- MinSal (Health)- MIUR (Research)- Università della Tuscia
Literature reviews and bibliographic searches- Maria Stella Ranieri