Embed Size (px)
Citation preview

www.edureka.co/decision-tree-Modeling-using-r
Decision Tree for predictive modeling
Slide 2 www.edureka.co/decision-tree-Modeling-using-r
Agenda
® Business need of a model
® Anatomy of a decision tree
® Advantage of using decision tree in the business scenario
® Usage of decision tree techniques in business
® Key decision tree features
® Course framework
At the end of the session we would learn about :

Slide 3 www.edureka.co/decision-tree-Modeling-using-r
Business Scenario – Need of a Model
Slide 4 www.edureka.co/decision-tree-Modeling-using-rSlide 4
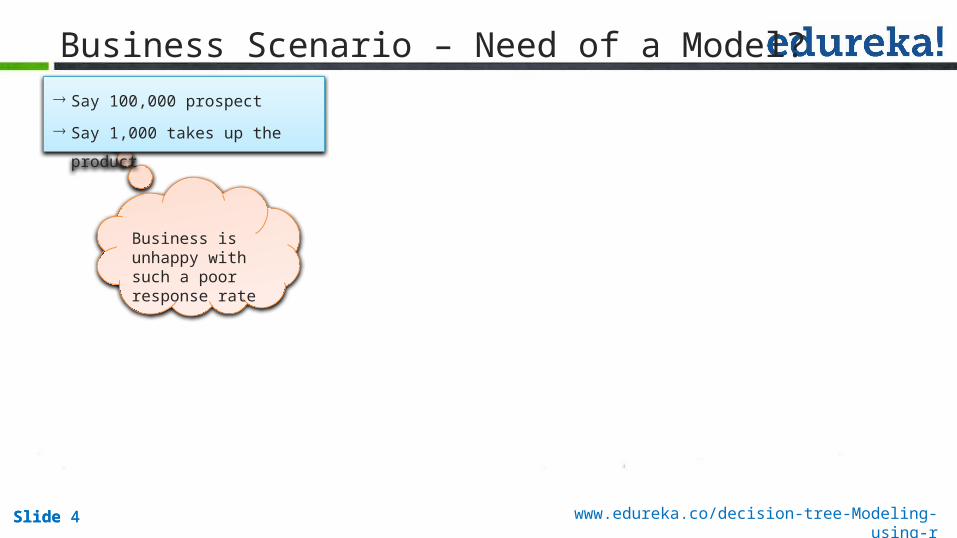
Business Scenario – Need of a Model?
Business is unhappy with such a poor response rate
® Say 100,000 prospect® Say 1,000 takes up the
product

Slide 5 www.edureka.co/decision-tree-Modeling-using-rSlide 5
Business Scenario – Need of a Model?
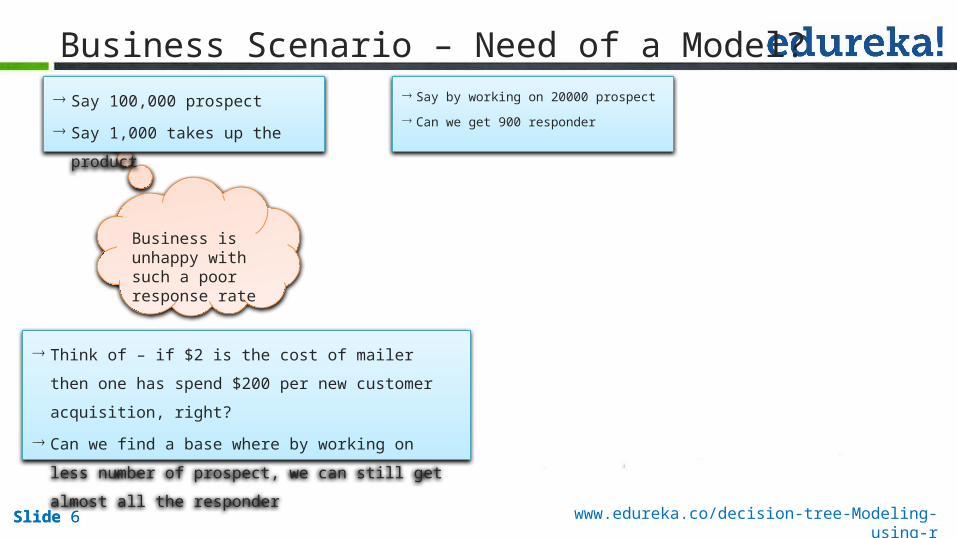
® Think of – if $2 is the cost of mailer then one has spend $200 per new customer acquisition, right?
® Can we find a base where by working on less number of prospect, we can still get almost all the responder
Business is unhappy with such a poor response rate
® Say 100,000 prospect® Say 1,000 takes up the
product
Slide 6 www.edureka.co/decision-tree-Modeling-using-rSlide 6
Business Scenario – Need of a Model?® Say by working on 20000 prospect® Can we get 900 responder
® Think of – if $2 is the cost of mailer then one has spend $200 per new customer acquisition, right?
® Can we find a base where by working on less number of prospect, we can still get almost all the responder
Business is unhappy with such a poor response rate
® Say 100,000 prospect® Say 1,000 takes up the
product

Slide 7 www.edureka.co/decision-tree-Modeling-using-rSlide 7
Business Scenario – Need of a Model?® Say by working on 20000 prospect® Can we get 900 responder
® Note – no possibility of exact match in real life scenarios
® Also very rare possibility of getting all the responder by working on part of population
® Target is to get almost all the responder by working on only small portion of the population
® Think of – if $2 is the cost of mailer then one has spend $200 per new customer acquisition, right?
® Can we find a base where by working on less number of prospect, we can still get almost all the responder
Business is unhappy with such a poor response rate
® Say 100,000 prospect® Say 1,000 takes up the
product

Slide 8 www.edureka.co/decision-tree-Modeling-using-rSlide 8
So the Target is …..
® Target is to get almost all the responder by working on only part of the population
Population – NResponder – K
X % of Population NY % – of Responder K
Y > X

Slide 9 www.edureka.co/decision-tree-Modeling-using-rSlide 9
So the Target is …..
® Target is to get almost all the responder by working on only part of the population
Population – NResponder – K
X % of Population NY %– of Responder K
Y > X
1 – X% of Population – N1 – Y% of Responder – K

Slide 10 www.edureka.co/decision-tree-Modeling-using-rSlide 10
So the Target is …..
® Target is to get almost all the responder by working on only part of the population
® Note RGB concept» Green the bench mark response rate » more response rate – red» Less response rate – blue
® Work on red / blue– higher response/lower response rate section
Population – NResponder – K
X % of Population NY %– of Responder K
Y > X
1 – X% of Population – N1 – Y% of Responder – K

Slide 11 www.edureka.co/decision-tree-Modeling-using-r
Decision Tree Example – Understand the Anatomy

Slide 12 www.edureka.co/decision-tree-Modeling-using-rSlide 12
Decision Tree Example
® Send files to bureau for credit worthiness of existing customers® 70% gets good rating, 30% bad rating
30%
70%
N
Y
Credit Rating Y: Good, N: Bad
Slide 13 www.edureka.co/decision-tree-Modeling-using-rSlide 13
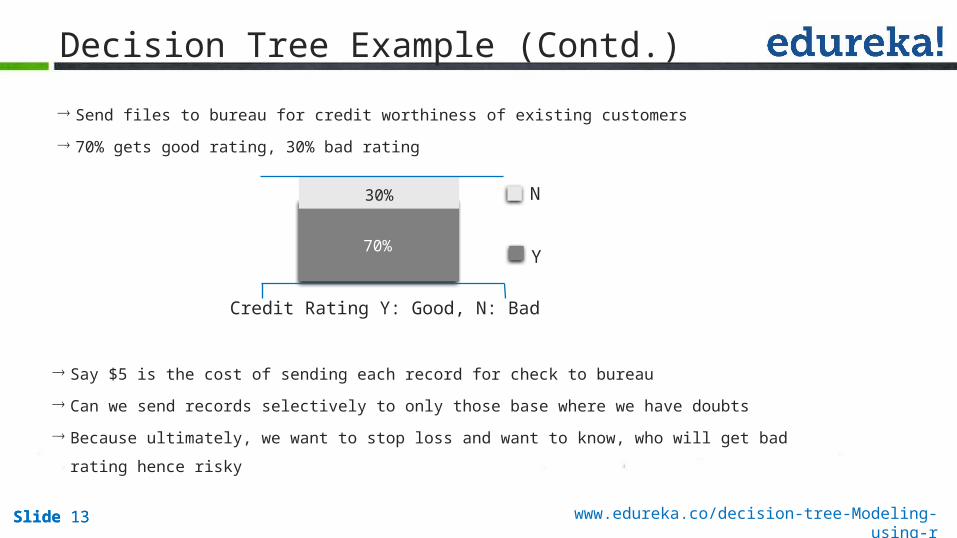
® Send files to bureau for credit worthiness of existing customers® 70% gets good rating, 30% bad rating
® Say $5 is the cost of sending each record for check to bureau® Can we send records selectively to only those base where we have doubts® Because ultimately, we want to stop loss and want to know, who will get bad rating hence
risky
Decision Tree Example (Contd.)
30%
70%
N
Y
Credit Rating Y: Good, N: Bad
Slide 14 www.edureka.co/decision-tree-Modeling-using-rSlide 14
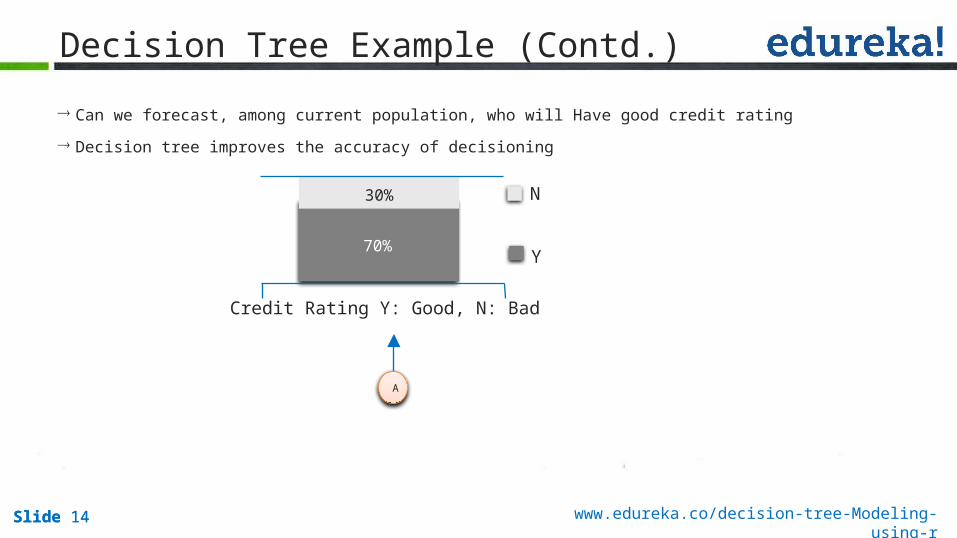
Decision Tree Example (Contd.)
® Can we forecast, among current population, who will Have good credit rating® Decision tree improves the accuracy of decisioning
A
30%
70%
N
Y
Credit Rating Y: Good, N: Bad
Slide 15 www.edureka.co/decision-tree-Modeling-using-rSlide 15
10.80.60.40.20
10.80.60.40.20
10.80.60.4
00.2
10.80.60.4
00.2
Z
Y
Z
Y
Z
Y
Z
Y
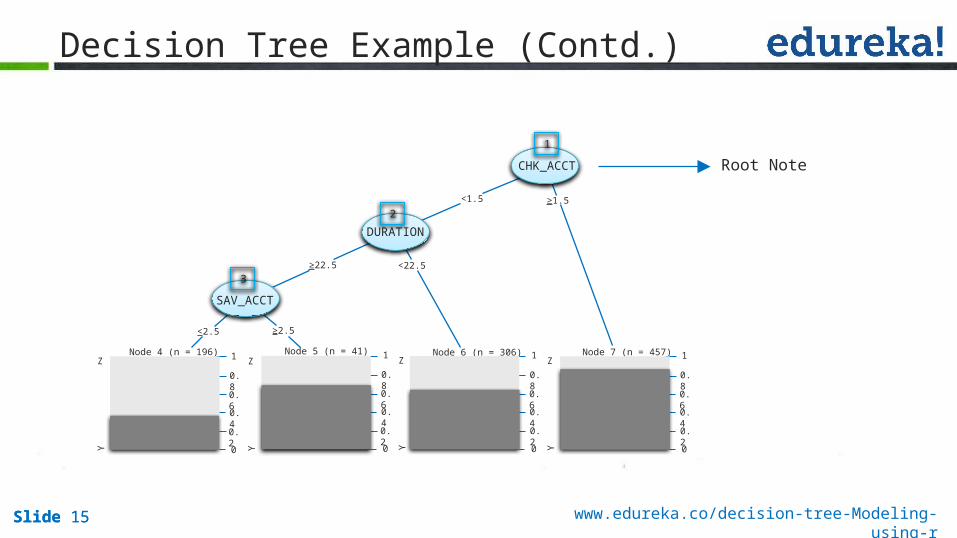
Node 4 (n = 196) Node 5 (n = 41) Node 6 (n = 306) Node 7 (n = 457)
<2.5 ≥2.5
≥22.5 <22.5
<1.5 ≥1.5
1
SAV_ACCT
DURATION
CHK_ACCT Root Note
2
3
Decision Tree Example (Contd.)

Slide 16 www.edureka.co/decision-tree-Modeling-using-rSlide 16
10.80.60.40.20
10.80.60.40.20
10.80.60.4
00.2
10.80.60.4
00.2
Z
Y
Z
Y
Z
Y
Z
Y
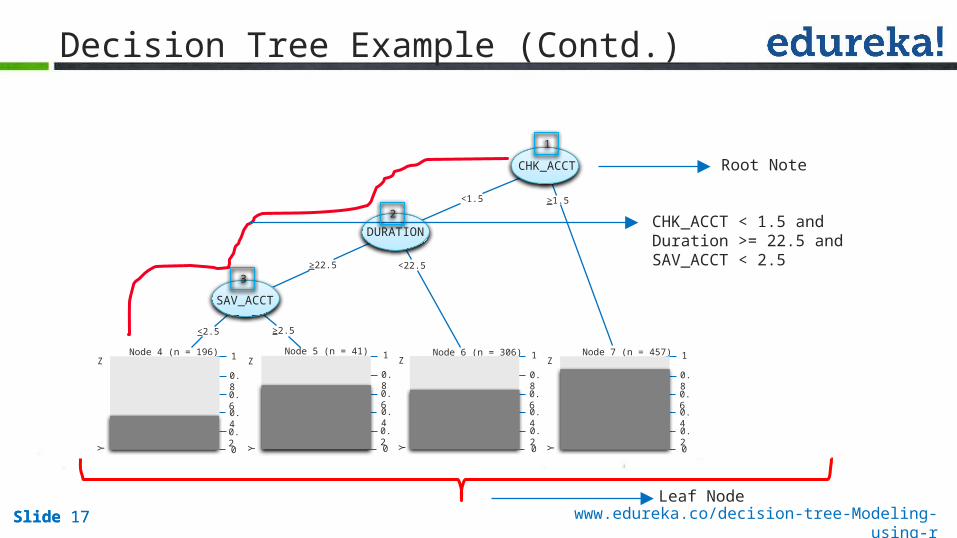
Node 4 (n = 196) Node 5 (n = 41) Node 6 (n = 306) Node 7 (n = 457)
<2.5 ≥2.5
≥22.5 <22.5
<1.5 ≥1.5
1
SAV_ACCT
DURATION
CHK_ACCT Root Note
Leaf Node
2
3
Decision Tree Example (Contd.)
Slide 17 www.edureka.co/decision-tree-Modeling-using-rSlide 17
10.80.60.40.20
10.80.60.40.20
10.80.60.4
00.2
10.80.60.4
00.2
Z
Y
Z
Y
Z
Y
Z
Y
Node 4 (n = 196) Node 5 (n = 41) Node 6 (n = 306) Node 7 (n = 457)
<2.5 ≥2.5
≥22.5 <22.5
<1.5 ≥1.5
1
SAV_ACCT
DURATION
CHK_ACCT Root Note
Leaf Node
CHK_ACCT < 1.5 and Duration >= 22.5 and SAV_ACCT < 2.5
2
3
Decision Tree Example (Contd.)

Slide 18 www.edureka.co/decision-tree-Modeling-using-rSlide 18
10.80.60.40.20
10.80.60.40.20
10.80.60.4
00.2
10.80.60.4
00.2
Z
Y
Z
Y
Z
Y
Z
Y
Node 4 (n = 196) Node 5 (n = 41) Node 6 (n = 306) Node 7 (n = 457)
<2.5 ≥2.5
≥22.5 <22.5
<1.5 ≥1.5
1
SAV_ACCT
DURATION
CHK_ACCT
37%71% 65% 87%
Root Note
Leaf Node
CHK_ACCT < 1.5 and Duration >= 22.5 and SAV_ACCT < 2.5
2
3
Decision Tree Example (Contd.)

Slide 19 www.edureka.co/decision-tree-Modeling-using-rSlide 19
10.80.60.40.20
10.80.60.40.20
10.80.60.4
00.2
10.80.60.4
00.2
Z
Y
Z
Y
Z
Y
Z
Y
Node 4 (n = 196) Node 5 (n = 41) Node 6 (n = 306) Node 7 (n = 457)
<2.5 ≥2.5
≥22.5 <22.5
<1.5 ≥1.5
1
SAV_ACCT
DURATION
CHK_ACCT
37%71% 65% 87%
Root Note
Leaf Node
CHK_ACCT < 1.5 and Duration >= 22.5 and SAV_ACCT < 2.5
® Node Size
® Depth
2
3
Decision Tree Example (Contd.)

Slide 20 www.edureka.co/decision-tree-Modeling-using-r
Decision Tree Example – Understand the Gain from Decision Tree

Slide 21 www.edureka.co/decision-tree-Modeling-using-rSlide 21
Decision Tree Example
10.80.60.40.20
10.80.60.40.20
10.80.60.4
00.2
10.80.60.4
00.2
Z
Y
Z
Y
ZY
Z
Y
Node 4 (n = 196) Node 5 (n = 41) Node 6 (n = 306)
Node 7 (n = 457)
<2.5 ≥2.5
≥22.5 <22.5
<1.5 ≥1.5
1
SAV_ACCT
DURATION
CHK_ACCT
2
3
>=1.5<1.5
<22.5>=22.5
>=2.5
Node 4(37%)
Node 5(71%)
Node 6(65%) SAV_ACCT
Duration NODE 7 (87%)
CHK_ACCT(70%)
<2.5
Slide 22 www.edureka.co/decision-tree-Modeling-using-rSlide 22
10.80.60.40.20
10.80.60.40.20
10.80.60.4
00.2
10.80.60.4
00.2
Z
Y
Z
Y
Z
Y
Z
Y
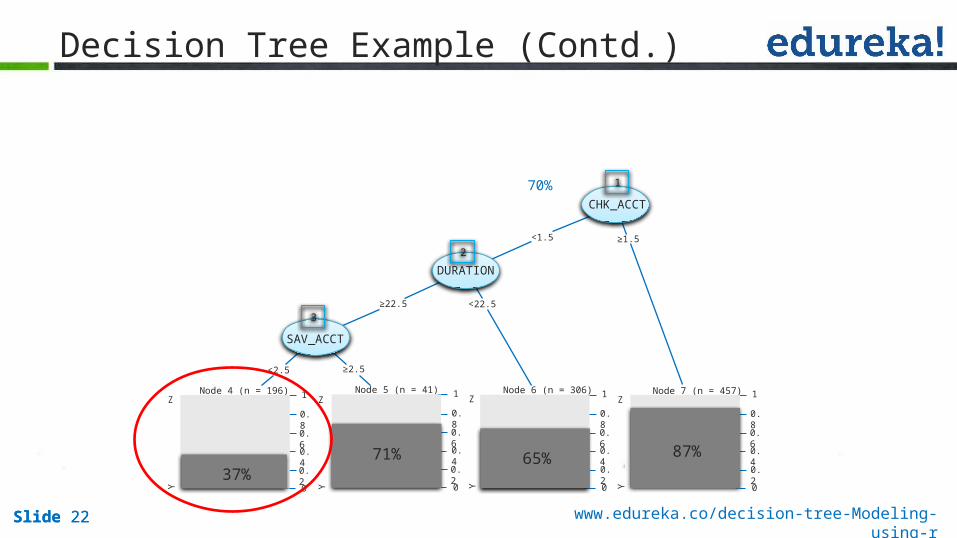
Node 4 (n = 196) Node 5 (n = 41) Node 6 (n = 306) Node 7 (n = 457)
<2.5 ≥2.5
≥22.5 <22.5
<1.5 ≥1.5
1
SAV_ACCT
DURATION
CHK_ACCT
37%71% 65% 87%
2
3
70%
Decision Tree Example (Contd.)

Slide 23 www.edureka.co/decision-tree-Modeling-using-rSlide 23
10.80.60.40.20
10.80.60.40.20
10.80.60.4
00.2
10.80.60.4
00.2
Z
Y
Z
Y
Z
Y
Z
Y
Node 4 (n = 196) Node 5 (n = 41) Node 6 (n = 306) Node 7 (n = 457)
<2.5 ≥2.5
≥22.5 <22.5
<1.5 ≥1.5
1
SAV_ACCT
DURATION
CHK_ACCT
37%71% 65% 87%
2
3
70%
Decision Tree Example (Contd.)® Understand gain by working on different nodes

Slide 24 www.edureka.co/decision-tree-Modeling-using-rSlide 24
10.80.60.40.20
10.80.60.40.20
10.80.60.4
00.2
10.80.60.4
00.2
Z
Y
Z
Y
Z
Y
Z
Y
Node 4 (n = 196) Node 5 (n = 41) Node 6 (n = 306) Node 7 (n = 457)
<2.5 ≥2.5
≥22.5 <22.5
<1.5 ≥1.5
1
SAV_ACCT
DURATION
CHK_ACCT
37%71% 65% 87%
2
3
70%
Decision Tree Example (Contd.)® Understand gain by working on different nodes® Now we can keep a documentation cell to demand more document from a subset of population and
then send them to bureau after receipt of documents

Slide 25 www.edureka.co/decision-tree-Modeling-using-rSlide 25
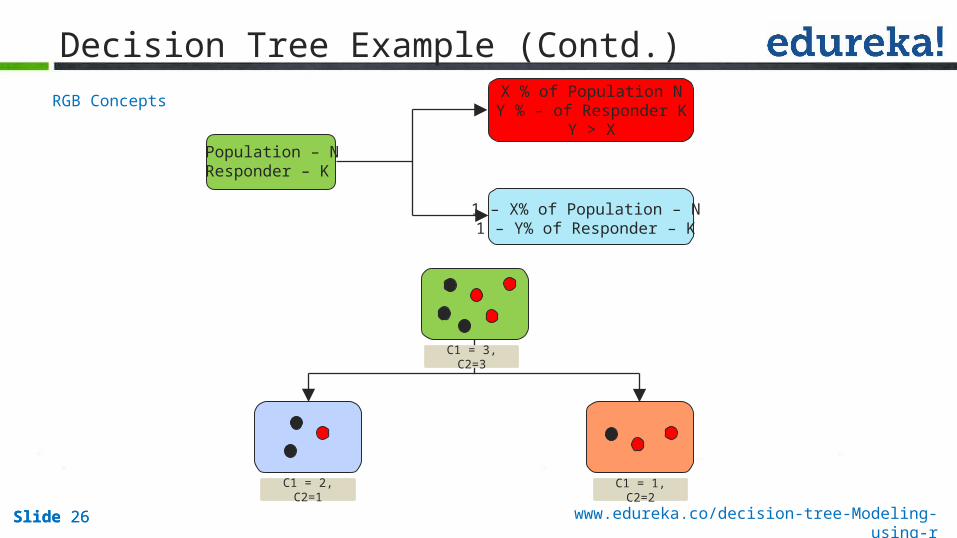
RGB Concepts
Decision Tree Example (Contd.)
Population – NResponder – K
X % of Population NY % – of Responder K
Y > X
1 – X% of Population – N1 – Y% of Responder – K
Slide 26 www.edureka.co/decision-tree-Modeling-using-rSlide 26
C1 = 3, C2=3
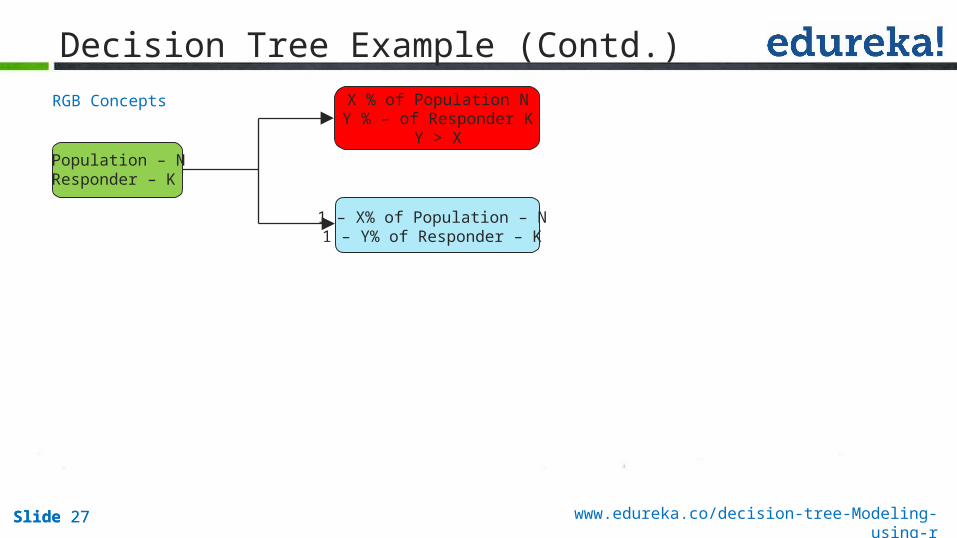
RGB Concepts
C1 = 1, C2=2
C1 = 2, C2=1
Decision Tree Example (Contd.)
Population – NResponder – K
X % of Population NY % – of Responder K
Y > X
1 – X% of Population – N1 – Y% of Responder – K
Slide 27 www.edureka.co/decision-tree-Modeling-using-rSlide 27
RGB Concepts
Decision Tree Example (Contd.)
Population – NResponder – K
X % of Population NY % – of Responder K
Y > X
1 – X% of Population – N1 – Y% of Responder – K

Slide 28 www.edureka.co/decision-tree-Modeling-using-rSlide 28
RGB Concepts
Decision Tree Example (Contd.)
Population – NResponder – K
X % of Population NY % – of Responder K
Y > X
1 – X% of Population – N1 – Y% of Responder – K
10.80.60.40.20
10.80.60.40.20
10.80.60.4
00.2
10.80.60.4
00.2
Z
Y
Z
Y
Z
Y
Z
Y
Node 4 (n = 196) Node 5 (n = 41) Node 6 (n = 306) Node 7 (n = 457)
<2.5 ≥2.5
≥22.5 <22.5
<1.5 ≥1.5
1
SAV_ACCT
DURATION
CHK_ACCT
37%71% 65% 87%
2
3
70%

Slide 29 www.edureka.co/decision-tree-Modeling-using-rSlide 29
RGB Concepts
Decision Tree Example (Contd.)
Population – NResponder – K
X % of Population NY % – of Responder K
Y > X
1 – X% of Population – N1 – Y% of Responder – K
70%
10.80.60.40.20
10.80.60.40.20
10.80.60.4
00.2
10.80.60.4
00.2
Z
Y
Z
Y
Z
Y
Z
Y
Node 4 (n = 196) Node 5 (n = 41) Node 6 (n = 306) Node 7 (n = 457)
<2.5 ≥2.5
≥22.5 <22.5
<1.5 ≥1.5
1
SAV_ACCT
DURATION
CHK_ACCT
37%71% 65% 87%
2
3
70%
Slide 30 www.edureka.co/decision-tree-Modeling-using-rSlide 30
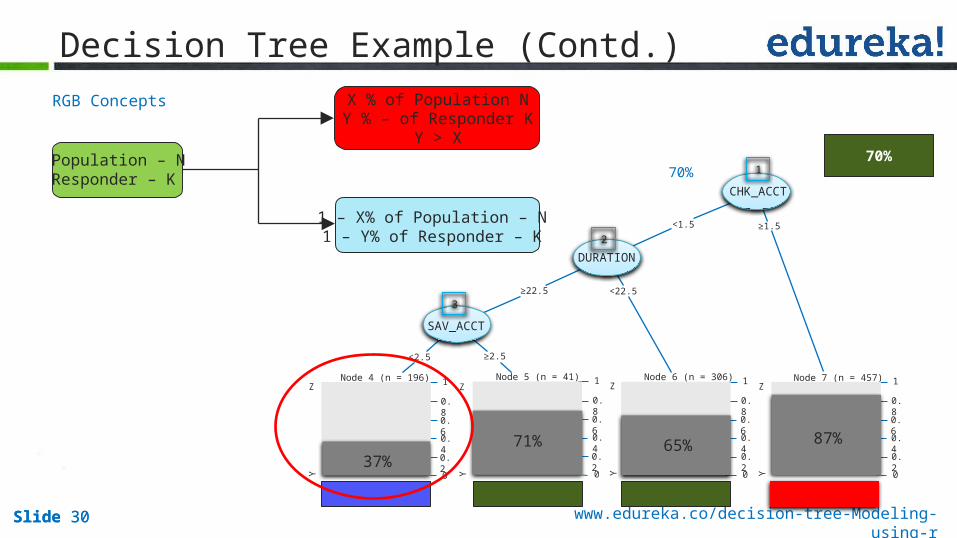
RGB Concepts
Decision Tree Example (Contd.)
70%Population – NResponder – K
X % of Population NY % – of Responder K
Y > X
1 – X% of Population – N1 – Y% of Responder – K
10.80.60.40.20
10.80.60.40.20
10.80.60.4
00.2
10.80.60.4
00.2
Z
Y
Z
Y
Z
Y
Z
Y
Node 4 (n = 196) Node 5 (n = 41) Node 6 (n = 306) Node 7 (n = 457)
<2.5 ≥2.5
≥22.5 <22.5
<1.5 ≥1.5
1
SAV_ACCT
DURATION
CHK_ACCT
37%71% 65% 87%
2
3
70%

Slide 31 www.edureka.co/decision-tree-Modeling-using-r
Business Applications of a Decision Tree – Use of a Model
Slide 32 www.edureka.co/decision-tree-Modeling-using-rSlide 32
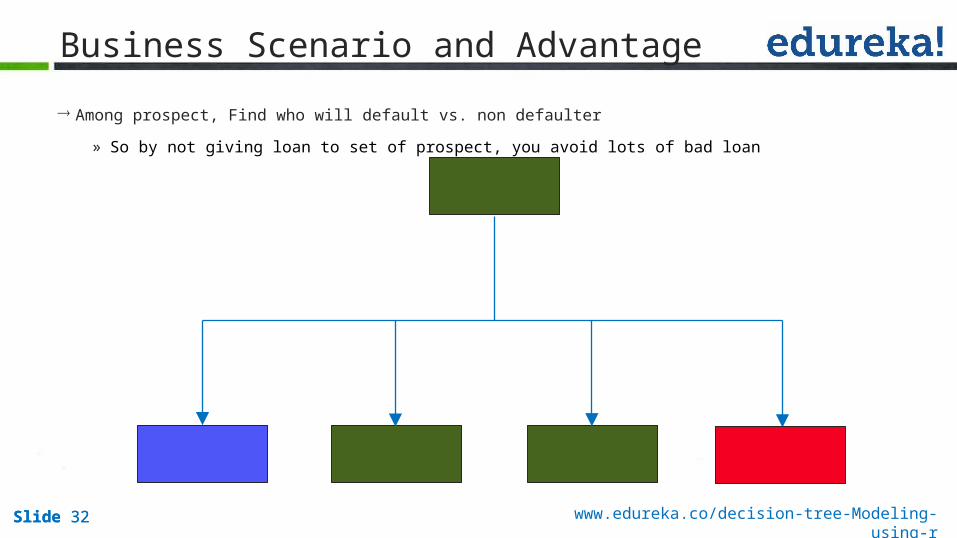
Business Scenario and Advantage
® Among prospect, Find who will default vs. non defaulter» So by not giving loan to set of prospect, you avoid lots of bad loan

Slide 33 www.edureka.co/decision-tree-Modeling-using-rSlide 33
Business Scenario and Advantage
® Among prospect, Find who will default vs. non defaulter
Slide 34 www.edureka.co/decision-tree-Modeling-using-rSlide 34
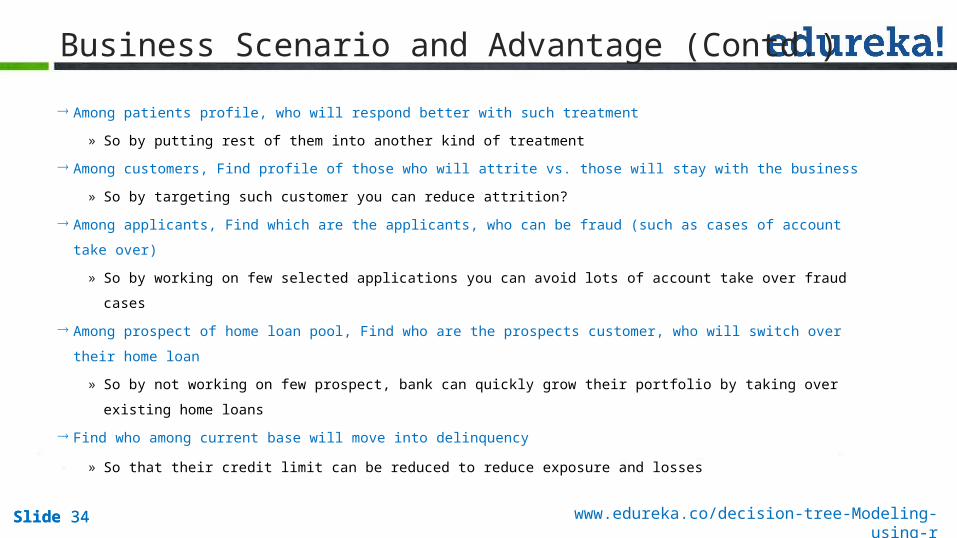
Business Scenario and Advantage (Contd.)
® Among patients profile, who will respond better with such treatment» So by putting rest of them into another kind of treatment
® Among customers, Find profile of those who will attrite vs. those will stay with the business» So by targeting such customer you can reduce attrition?
® Among applicants, Find which are the applicants, who can be fraud (such as cases of account take over)
» So by working on few selected applications you can avoid lots of account take over fraud cases® Among prospect of home loan pool, Find who are the prospects customer, who will switch over their
home loan» So by not working on few prospect, bank can quickly grow their portfolio by taking over existing
home loans® Find who among current base will move into delinquency
» So that their credit limit can be reduced to reduce exposure and losses
Slide 35 www.edureka.co/decision-tree-Modeling-using-r
Key decision tree features

Slide 36 www.edureka.co/decision-tree-Modeling-using-rSlide 36
Key Decision Tree features
® Automated field selection» handles any number of fields
» automatically selects relevant fields® Little data preprocessing needed
» Does not require any kind of variable transforms» Impervious to outliers
® Missing value tolerant» Moderate loss of accuracy due to missing values
® Quick development and validation
Slide 37 www.edureka.co/decision-tree-Modeling-using-r
Questions
Slide 38 www.edureka.co/decision-tree-Modeling-using-r
Your feedback is important to us, be it a compliment, a suggestion or a complaint. It helps us to make the course better!
Please spare few seconds to take the survey after the webinar.
www.edureka.co/
Survey

Slide 39 www.edureka.co/decision-tree-Modeling-using-r