Embed Size (px)
Citation preview
#DataVizInSixWeeksCopyright Anne Stevens
Perception & cognition
#DataVizInSixWeeksCopyright Anne Stevens
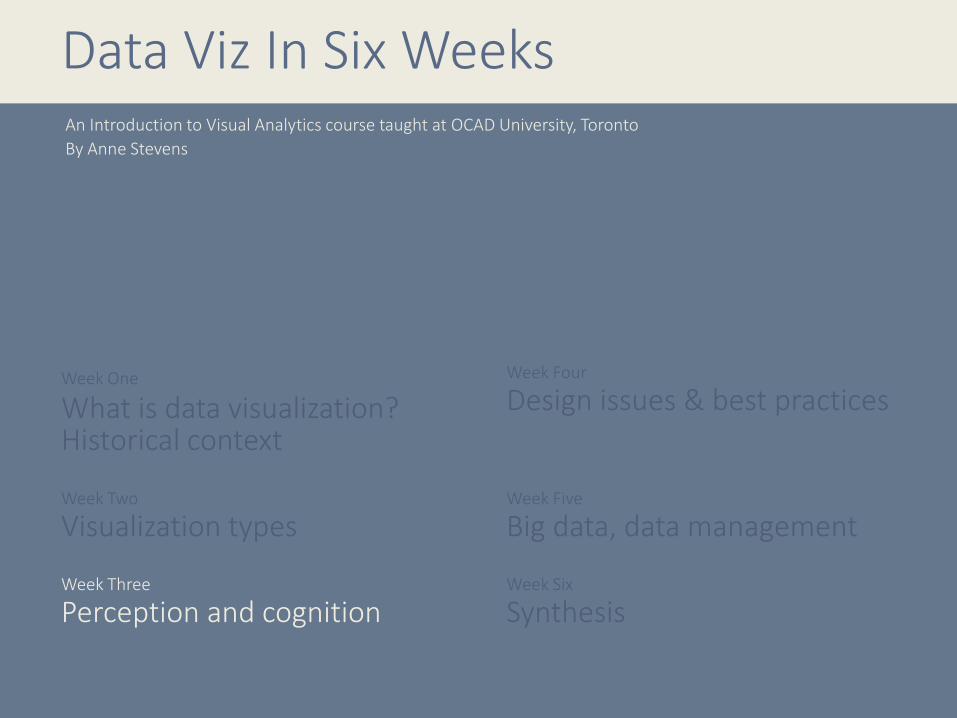
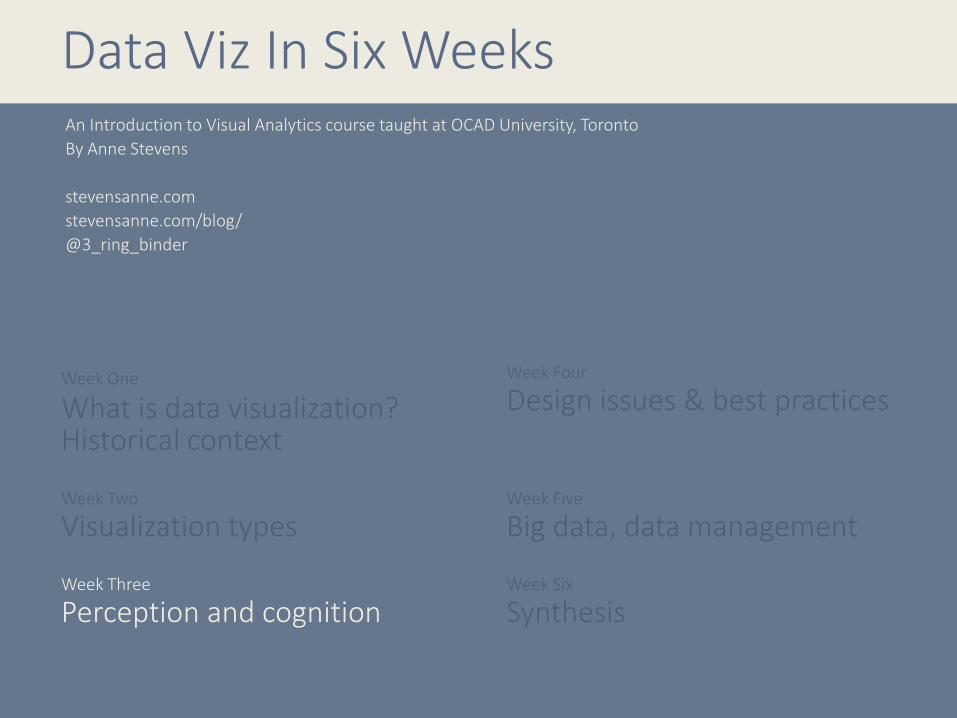
Week One
What is data visualization? Historical context
Week Four
Design issues & best practices
Week Two
Visualization typesWeek Five
Big data, data management
Week Three
Perception and cognitionWeek Six
Synthesis
Data Viz In Six WeeksAn Introduction to Visual Analytics course taught at OCAD University, Toronto
By Anne Stevens

#DataVizInSixWeeksCopyright Anne Stevens
c/o Fanny Chevalier
#DataVizInSixWeeksCopyright Anne Stevens
Why perception & cognition
Work with laws of perception & cognition, not against them
Gives the designer objective tools to assess own work
#DataVizInSixWeeksCopyright Anne Stevens
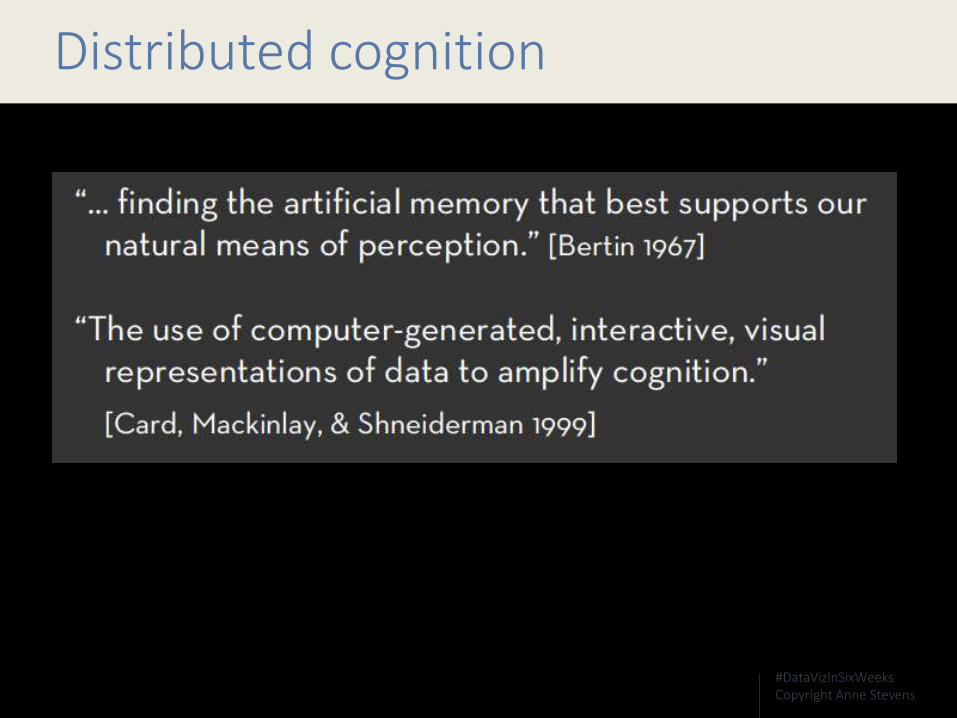
Distributed cognition
#DataVizInSixWeeksCopyright Anne Stevens
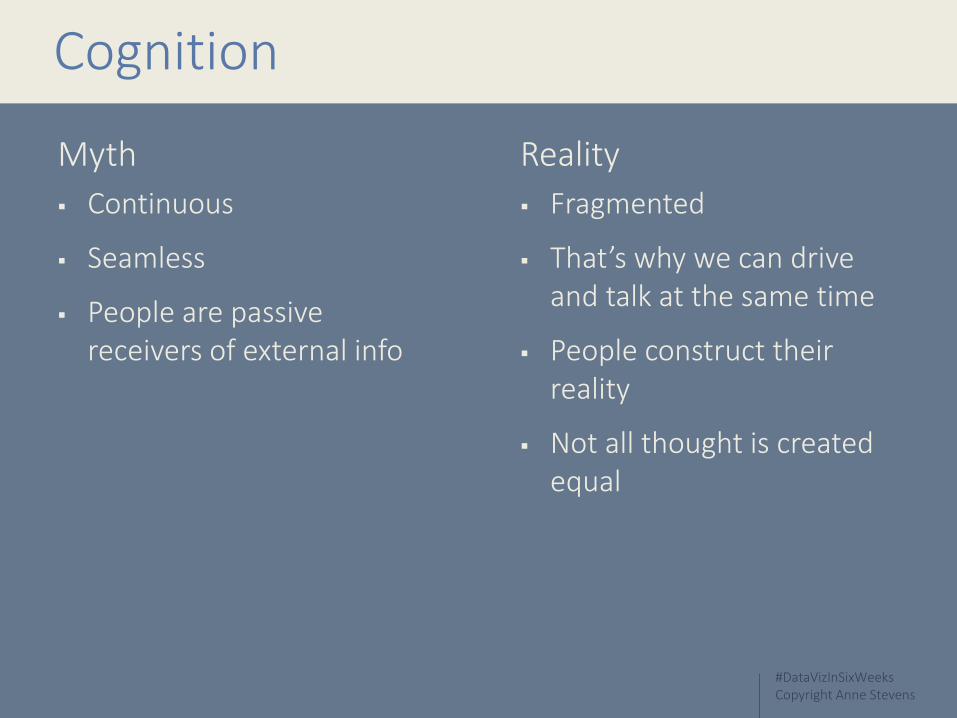
Cognition
Myth
Continuous
Seamless
People are passive receivers of external info
Reality
Fragmented
That’s why we can drive and talk at the same time
People construct their reality
Not all thought is created equal
#DataVizInSixWeeksCopyright Anne Stevens
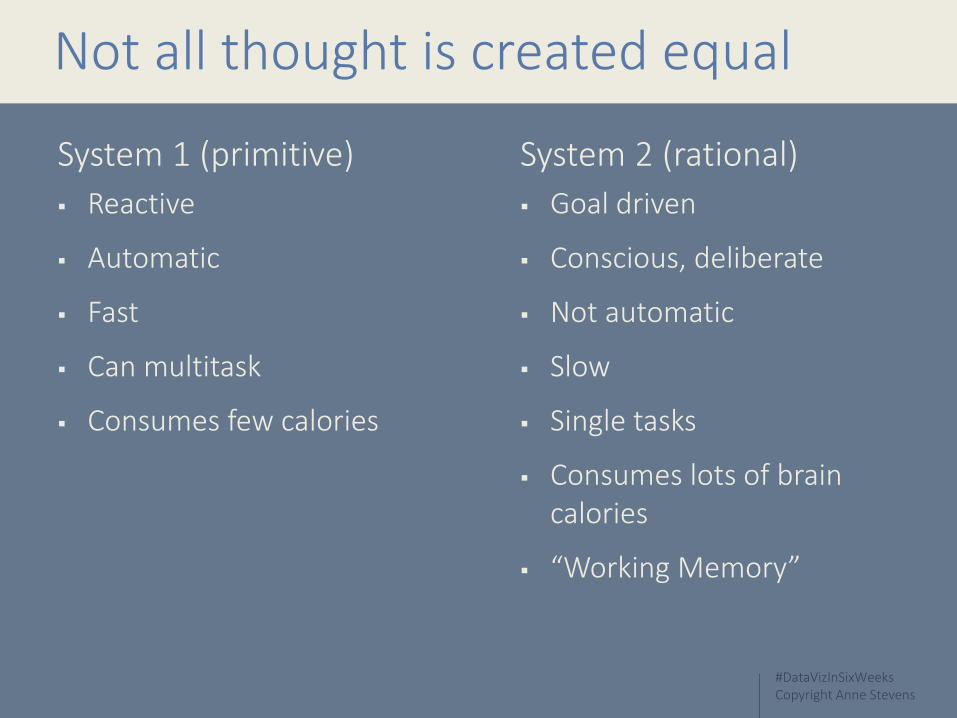
Not all thought is created equal
System 1 (primitive)
Reactive
Automatic
Fast
Can multitask
Consumes few calories
System 2 (rational)
Goal driven
Conscious, deliberate
Not automatic
Slow
Single tasks
Consumes lots of brain calories
“Working Memory”

#DataVizInSixWeeksCopyright Anne Stevens

#DataVizInSixWeeksCopyright Anne Stevens
Perception
Myth
Continuous
That we see everything at once …
… and equally well
We are passive receptors
Reality
Details on demand
Just in time delivery
Most efficient use of brain resources
Bottom-up and top-down processes
Preattentive & Attentive processes
#DataVizInSixWeeksCopyright Anne Stevens
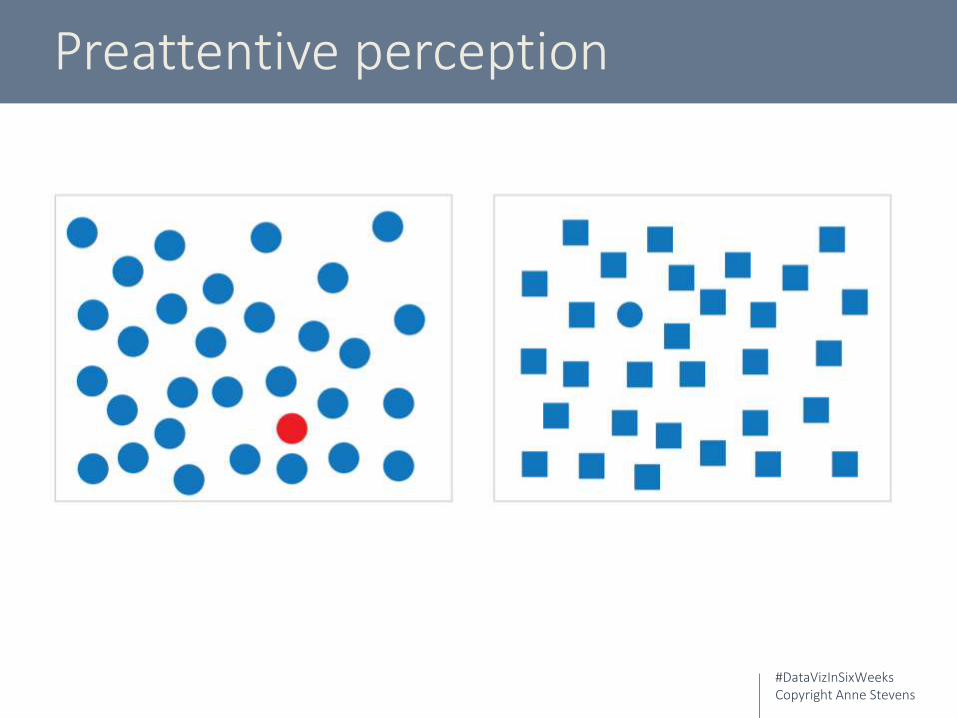
Preattentive perception

#DataVizInSixWeeksCopyright Anne Stevens
Find the red circle

#DataVizInSixWeeksCopyright Anne Stevens
Preattentive Attentive
Equiv. to System 1 thinking
Fast, automatic
Bottom-up
Instinctive
Efficient
Multitasks
Equiv. to System 2 thinking
Slow, deliberate, focussed
Top-down
Consumes more ‘Visual Working Memory’
VWM can hold very few objects at a time

#DataVizInSixWeeksCopyright Anne Stevens
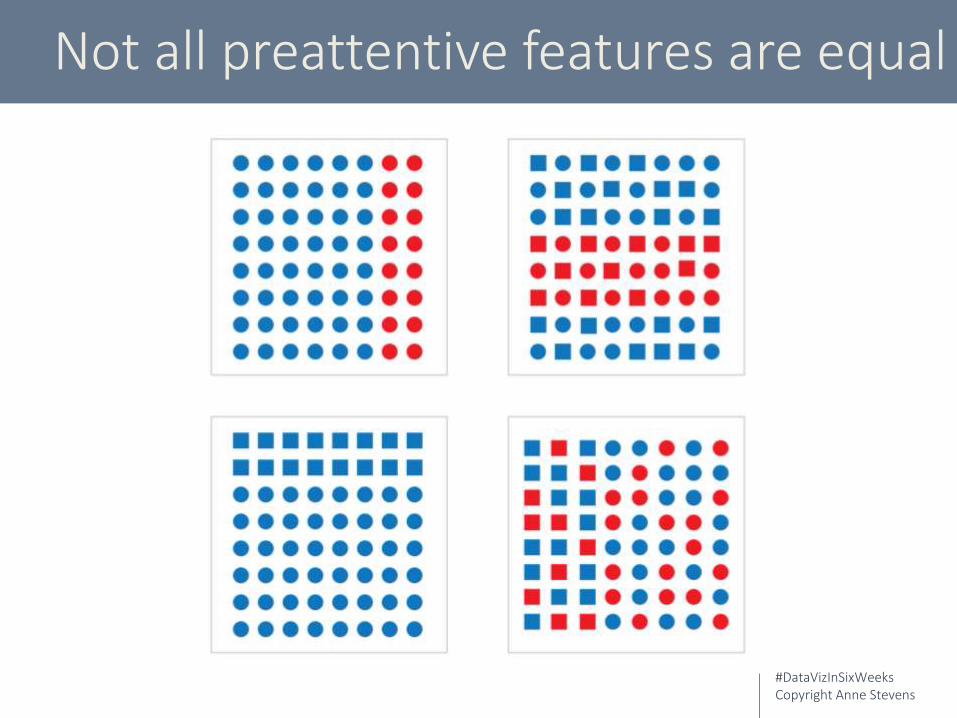
Preattentive features
#DataVizInSixWeeksCopyright Anne Stevens
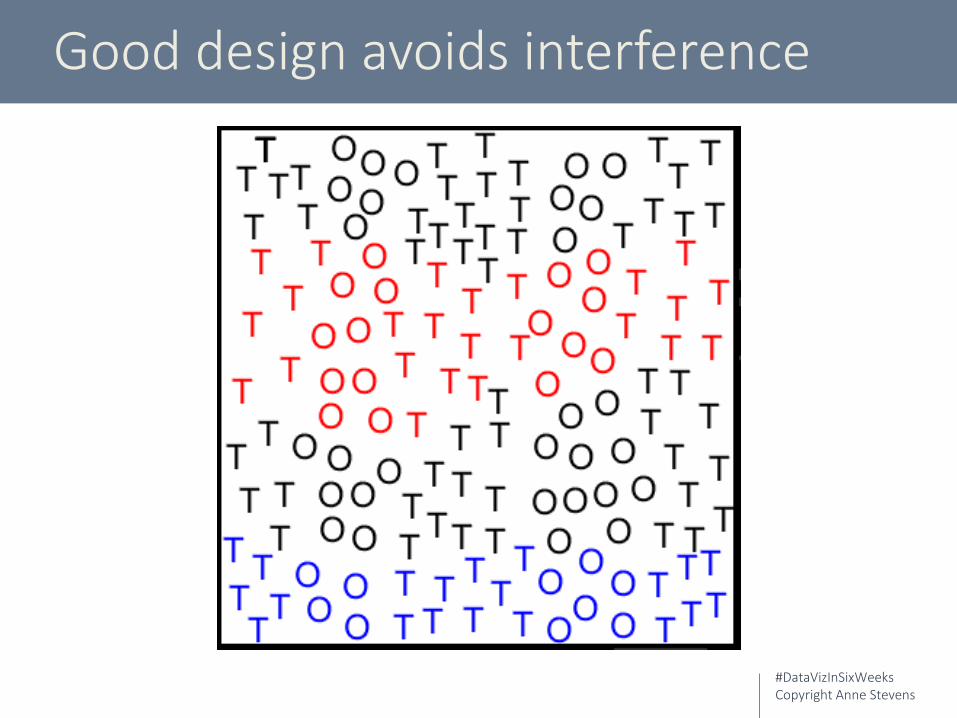
Not all preattentive features are equal
#DataVizInSixWeeksCopyright Anne Stevens
Good design avoids interference
#DataVizInSixWeeksCopyright Anne Stevens
Brain – pattern recognition machine
#DataVizInSixWeeksCopyright Anne Stevens
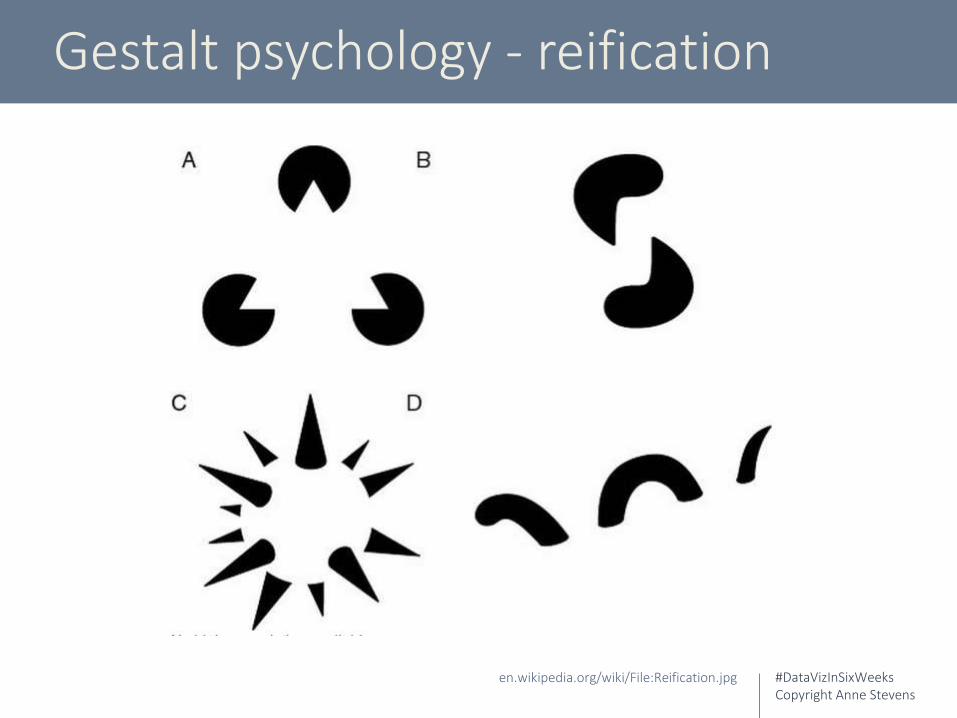
Gestalt psychology - reification
en.wikipedia.org/wiki/File:Reification.jpg
#DataVizInSixWeeksCopyright Anne Stevens
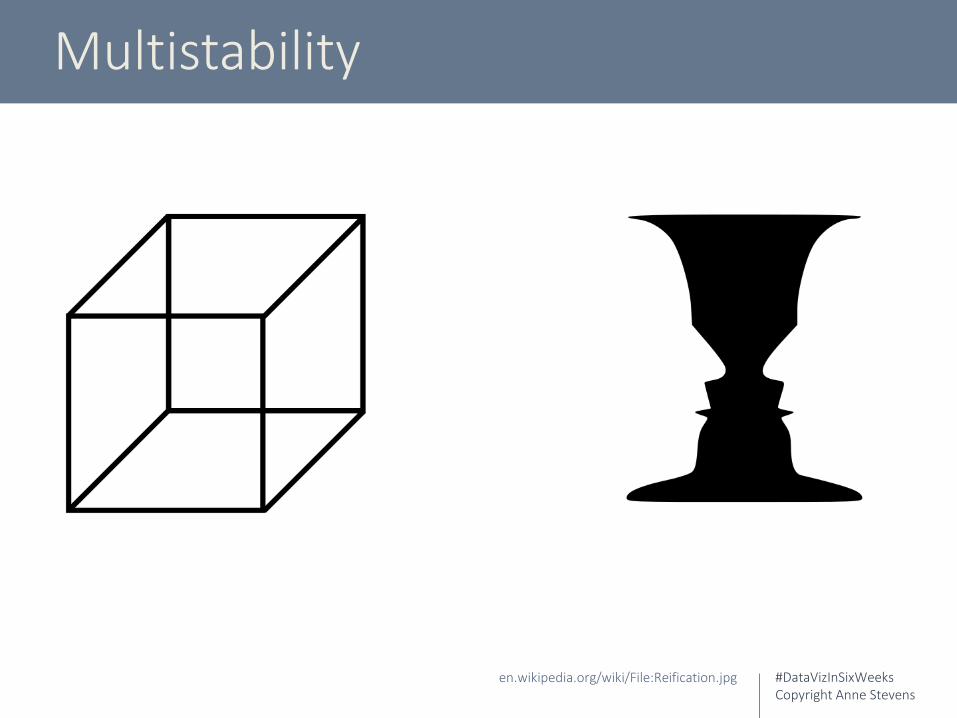
Multistability
en.wikipedia.org/wiki/File:Reification.jpg
#DataVizInSixWeeksCopyright Anne Stevens
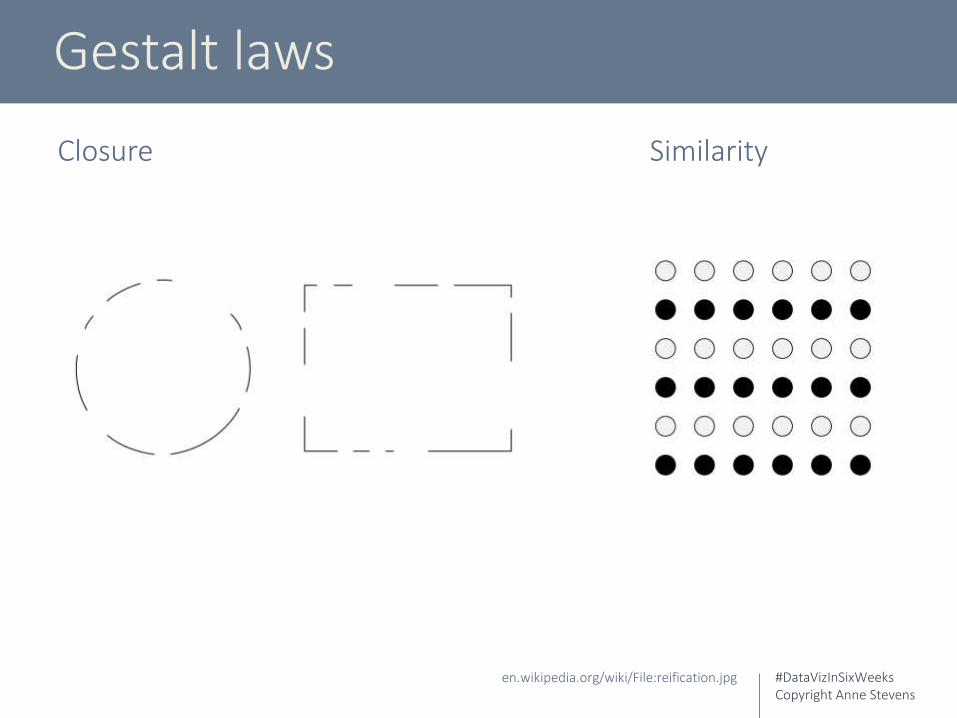
Gestalt laws
en.wikipedia.org/wiki/File:reification.jpg
Closure Similarity

#DataVizInSixWeeksCopyright Anne Stevens
Gestalt laws
en.wikipedia.org/wiki/File:reification.jpg
Proximity
#DataVizInSixWeeksCopyright Anne Stevens
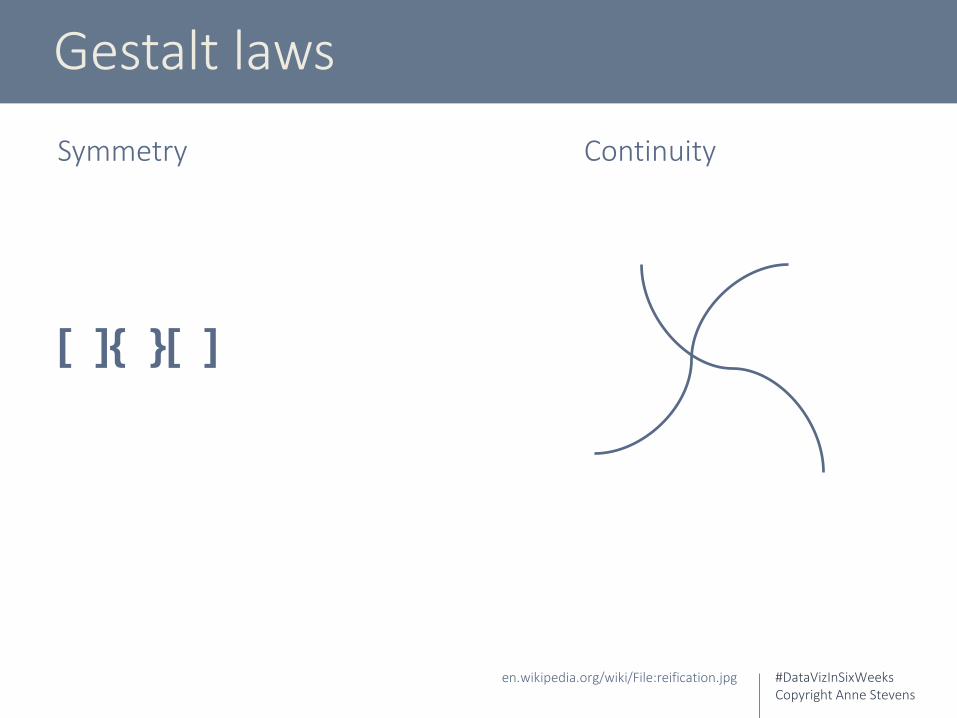
Gestalt laws
en.wikipedia.org/wiki/File:reification.jpg
Symmetry Continuity
[ ]{ }[ ]
#DataVizInSixWeeksCopyright Anne Stevens
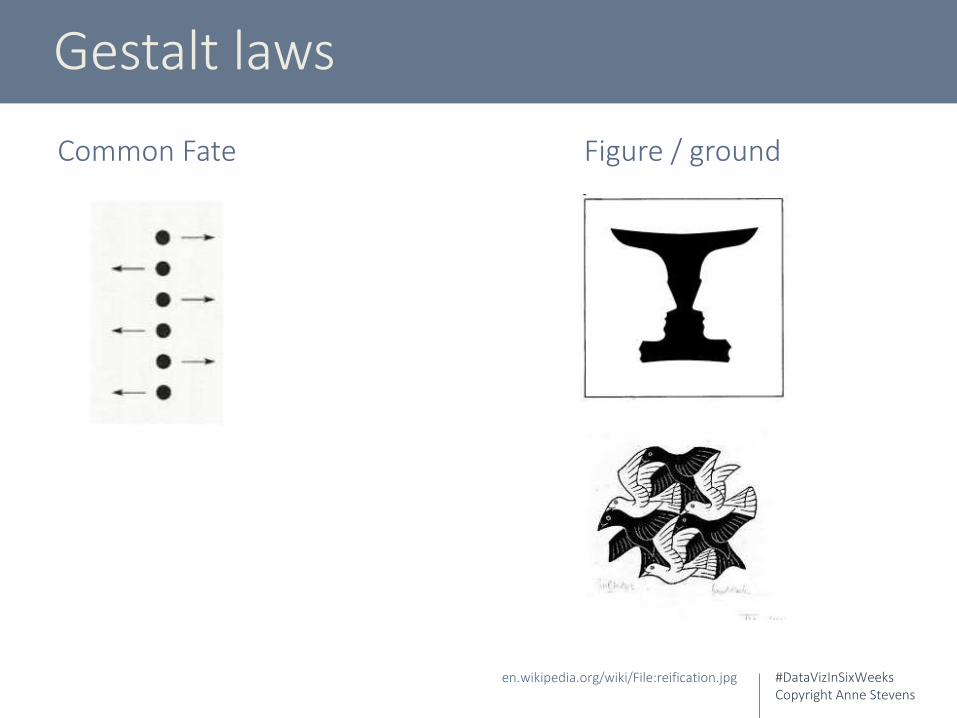
Gestalt laws
en.wikipedia.org/wiki/File:reification.jpg
Common Fate Figure / ground
#DataVizInSixWeeksCopyright Anne Stevens
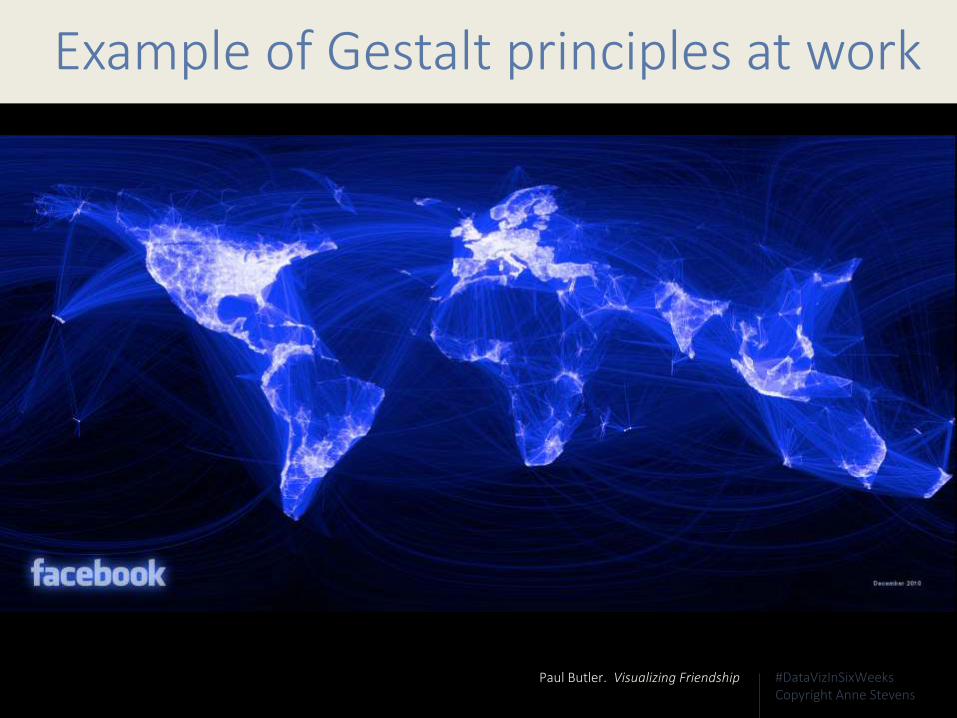
Example of Gestalt principles at work
Paul Butler. Visualizing Friendship

#DataVizInSixWeeksCopyright Anne Stevens
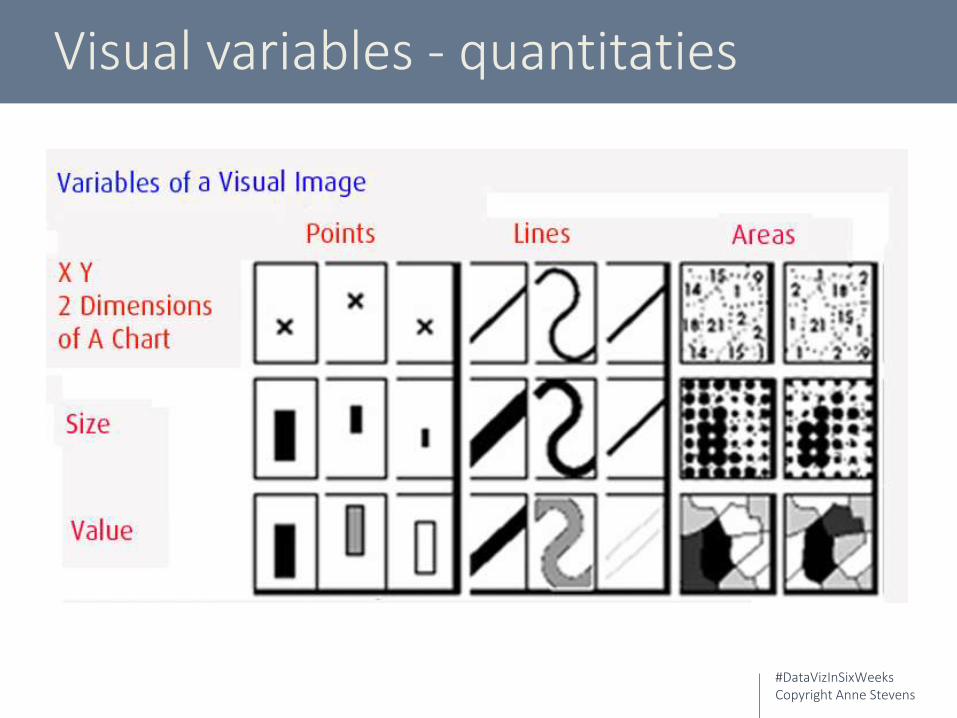
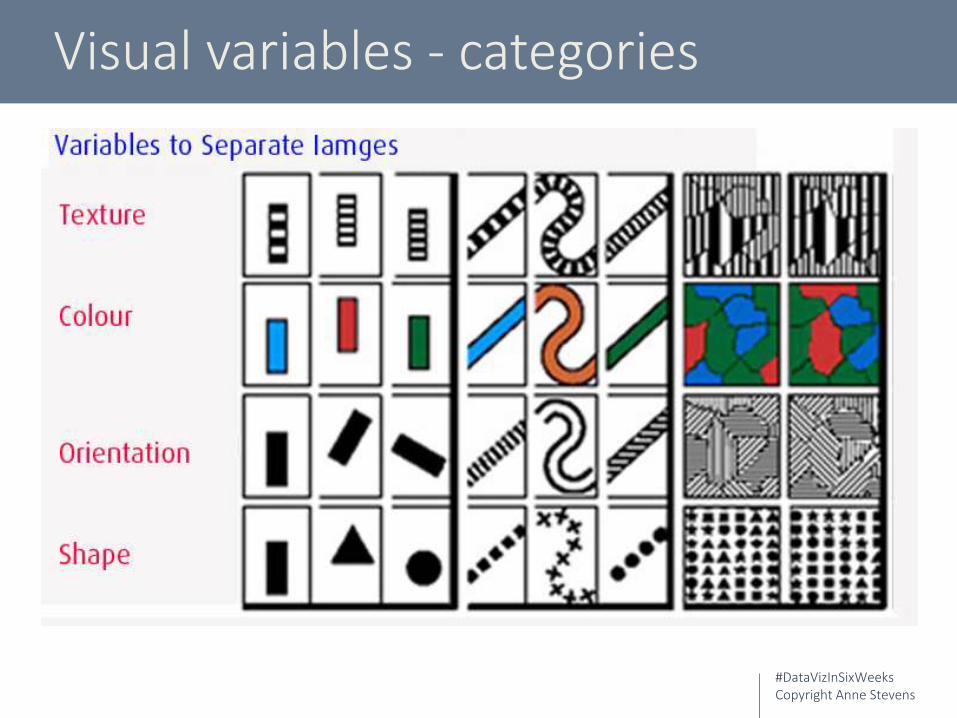
Jacques Bertin – patron saint
Semiology of Graphics, 1967
#DataVizInSixWeeksCopyright Anne Stevens
Visual variables - quantitaties
#DataVizInSixWeeksCopyright Anne Stevens
Visual variables - categories
#DataVizInSixWeeksCopyright Anne Stevens
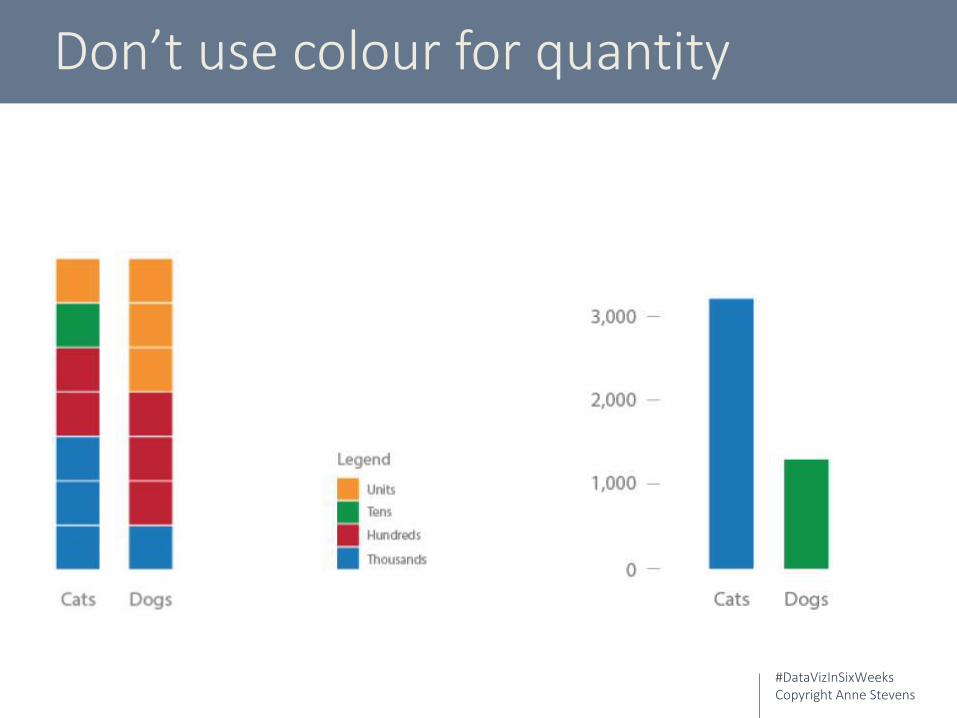
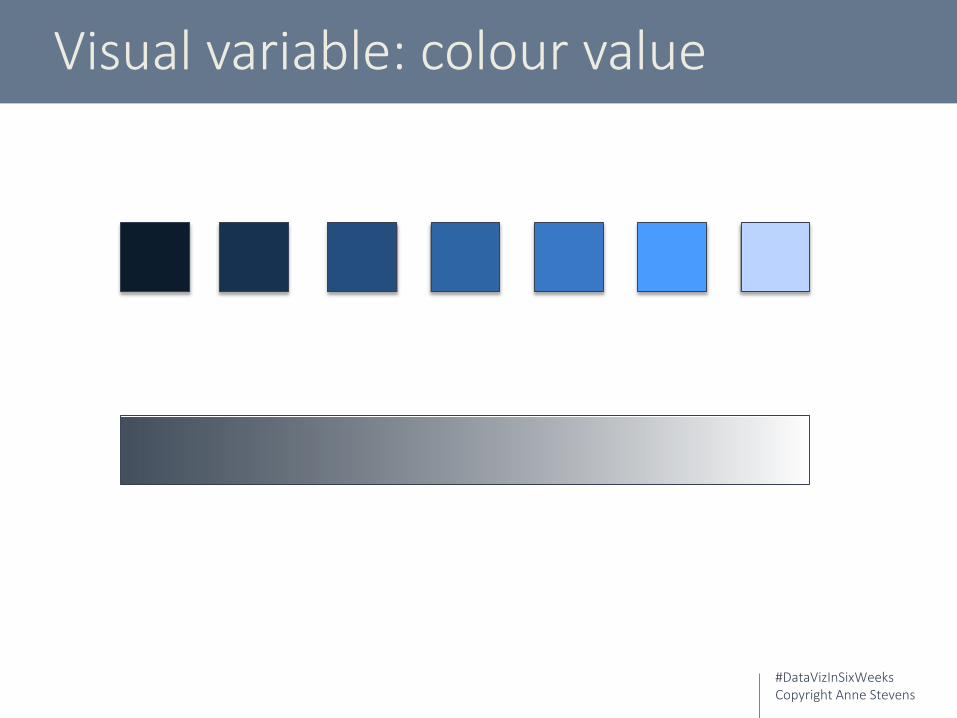
Don’t use colour for quantity
#DataVizInSixWeeksCopyright Anne Stevens
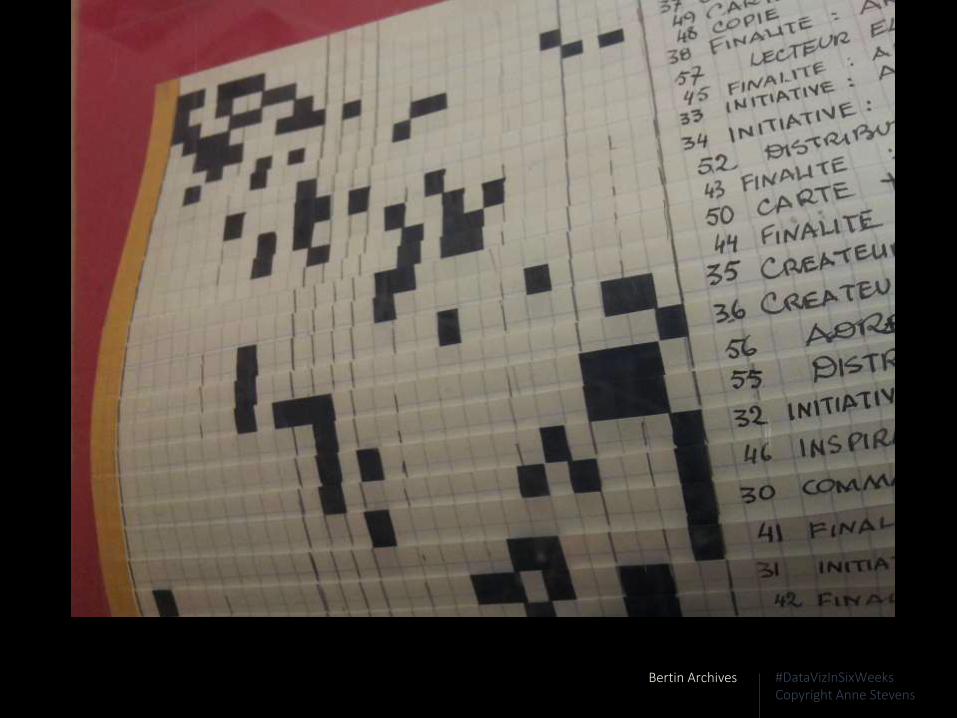
Bertin Archives
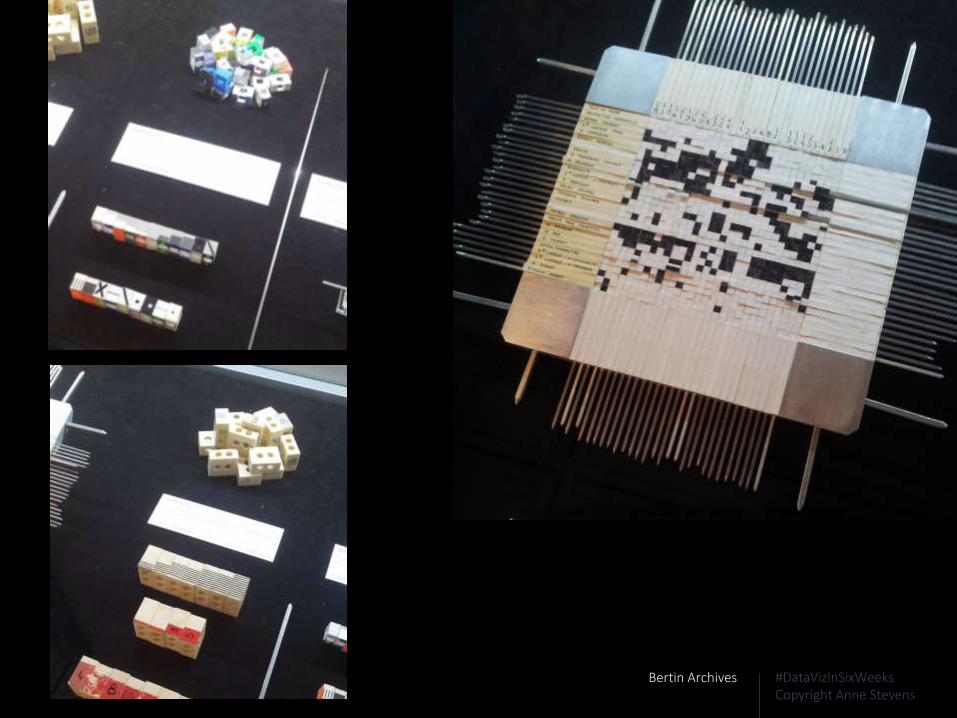
#DataVizInSixWeeksCopyright Anne Stevens
Bertin Archives
#DataVizInSixWeeksCopyright Anne Stevens
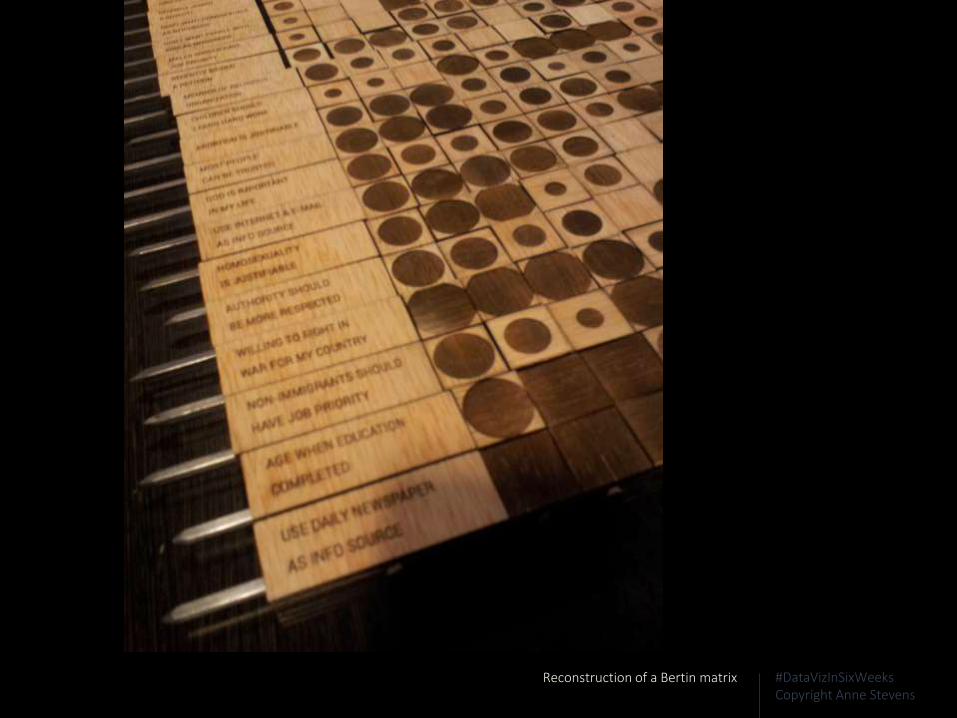
Reconstruction of a Bertin matrix

#DataVizInSixWeeksCopyright Anne Stevens
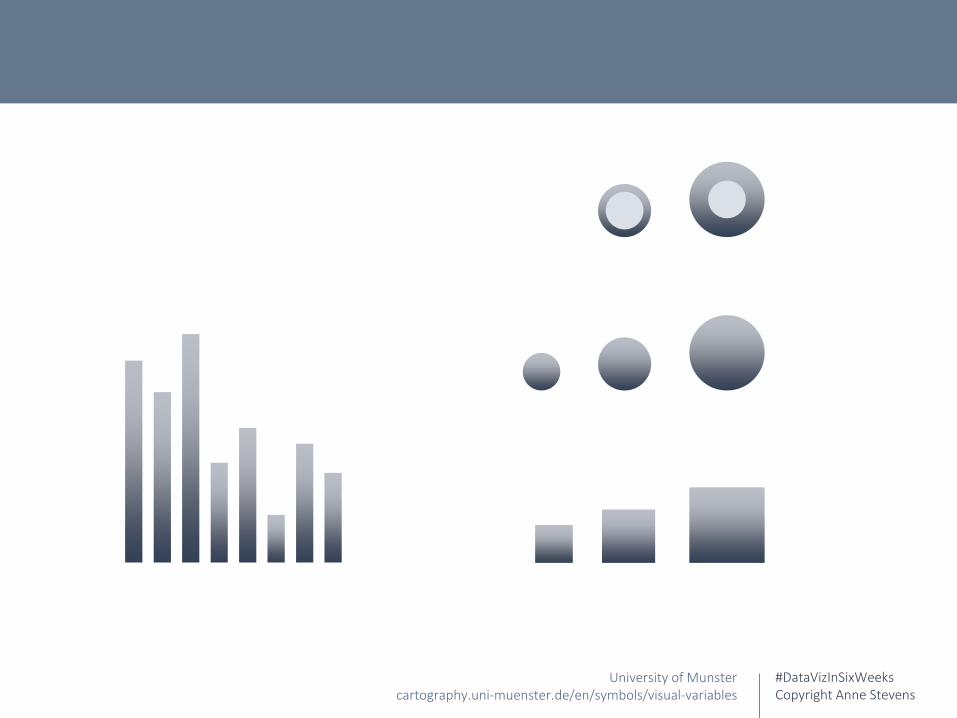
Visual variables: line and size
University of Munstercartography.uni-muenster.de/en/symbols/visual-variables
#DataVizInSixWeeksCopyright Anne Stevens
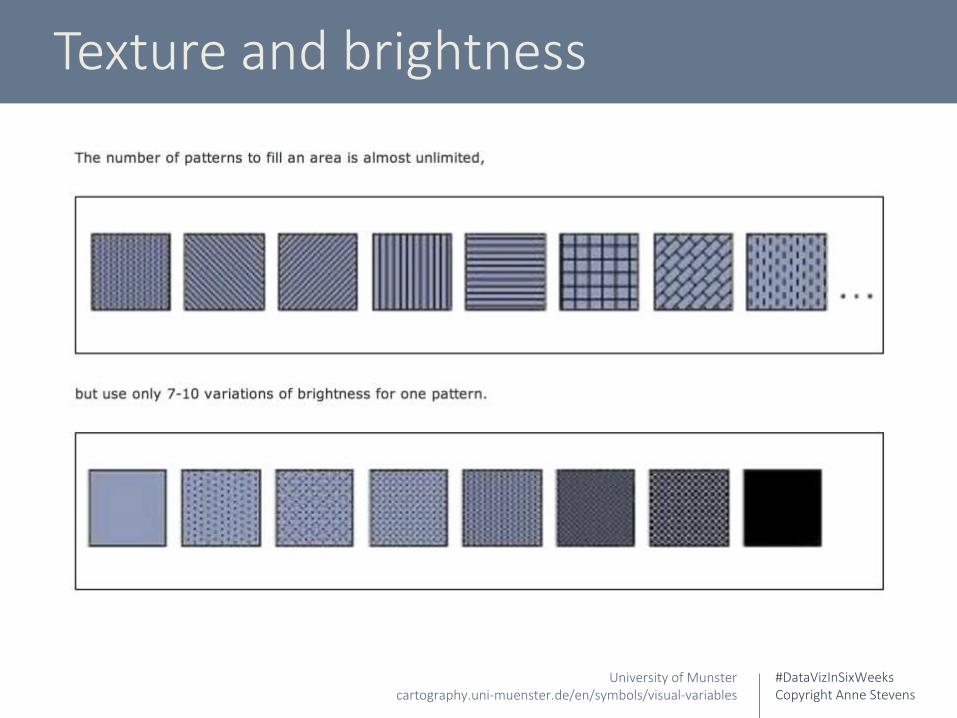
Texture and brightness
University of Munstercartography.uni-muenster.de/en/symbols/visual-variables
#DataVizInSixWeeksCopyright Anne Stevens
University of Munstercartography.uni-muenster.de/en/symbols/visual-variables

#DataVizInSixWeeksCopyright Anne Stevens
Dan Berlinslideshare.net/Banderlin/visual-principles-of-experience-design-blending-art-and-science
#DataVizInSixWeeksCopyright Anne Stevens
Visual variable: colour value
#DataVizInSixWeeksCopyright Anne Stevens
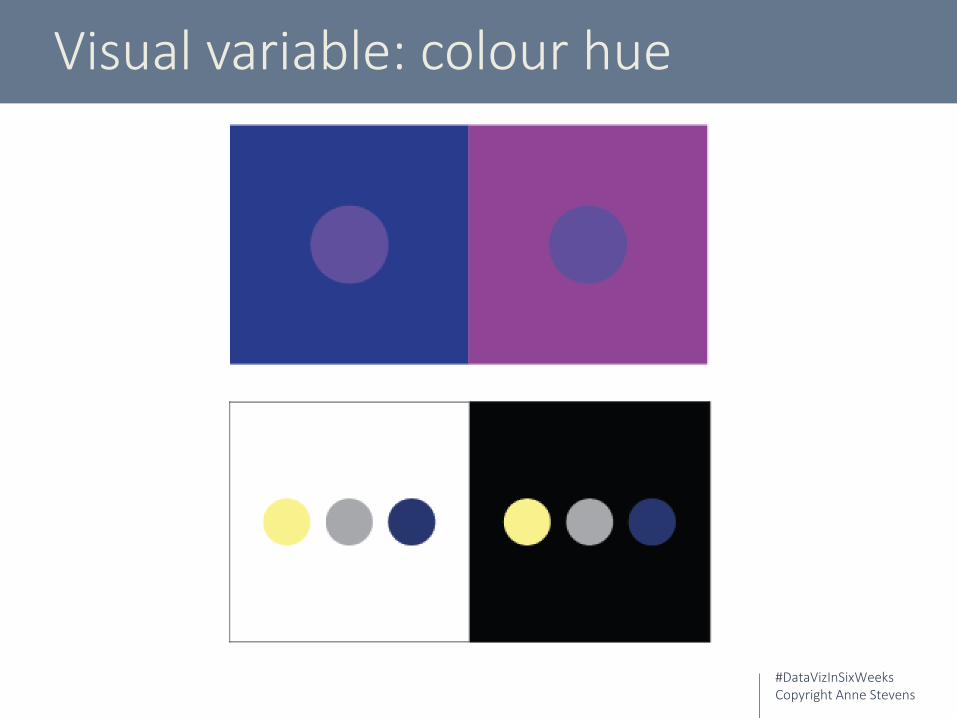
Visual variable: colour hue
#DataVizInSixWeeksCopyright Anne Stevens
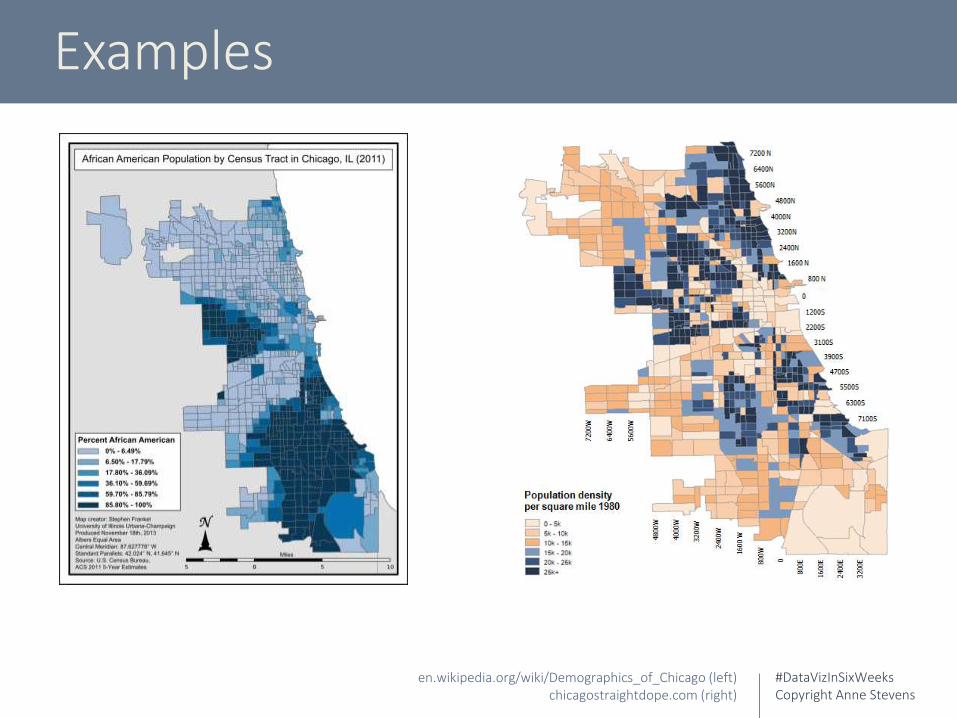
Examples
en.wikipedia.org/wiki/Demographics_of_Chicago (left)chicagostraightdope.com (right)

#DataVizInSixWeeksCopyright Anne Stevens
Map of the Marketmarketwatch.com/tools/stockresearch/marketmap
#DataVizInSixWeeksCopyright Anne Stevens
Data mapping
One dimensional data: easy
Multi-dimensional data: more tricky
Map each data dimension to a different visual variable
Chose visual variables that suit data type
Avoid interference with preattentive perception
Map primary data to primary visual feature; secondary to secondary, and so on
#DataVizInSixWeeksCopyright Anne Stevens
Week One
What is data visualization? Historical context
Week Four
Design issues & best practices
Week Two
Visualization typesWeek Five
Big data, data management
Week Three
Perception and cognitionWeek Six
Synthesis
Data Viz In Six WeeksAn Introduction to Visual Analytics course taught at OCAD University, Toronto
By Anne Stevens
stevensanne.com
stevensanne.com/blog/
@3_ring_binder