Embed Size (px)
Citation preview
Demand Response in Commercial Buildings
Technology as an Enabler for Scaling Up
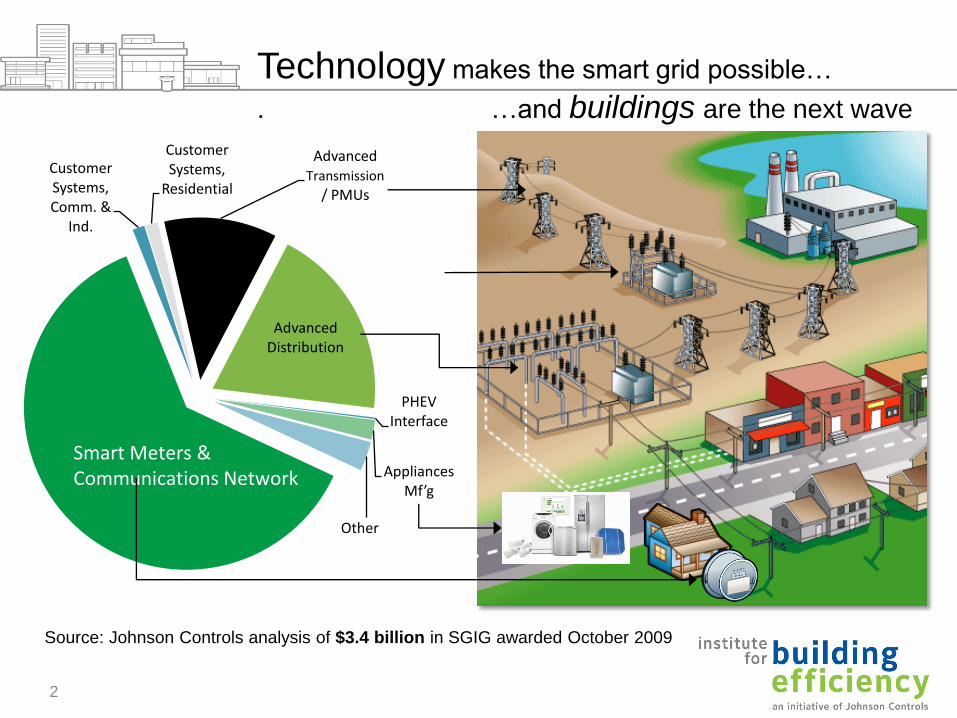
Technology makes the smart grid possible…
. …and buildings are the next wave
2
Customer Systems, Comm. &
Ind.
Customer Systems,
Residential
Advanced Transmission
/ PMUs
Advanced Distribution
PHEV Interface
Appliances Mf’g
Other
Smart Meters & Communications Network
Source: Johnson Controls analysis of $3.4 billion in SGIG awarded October 2009
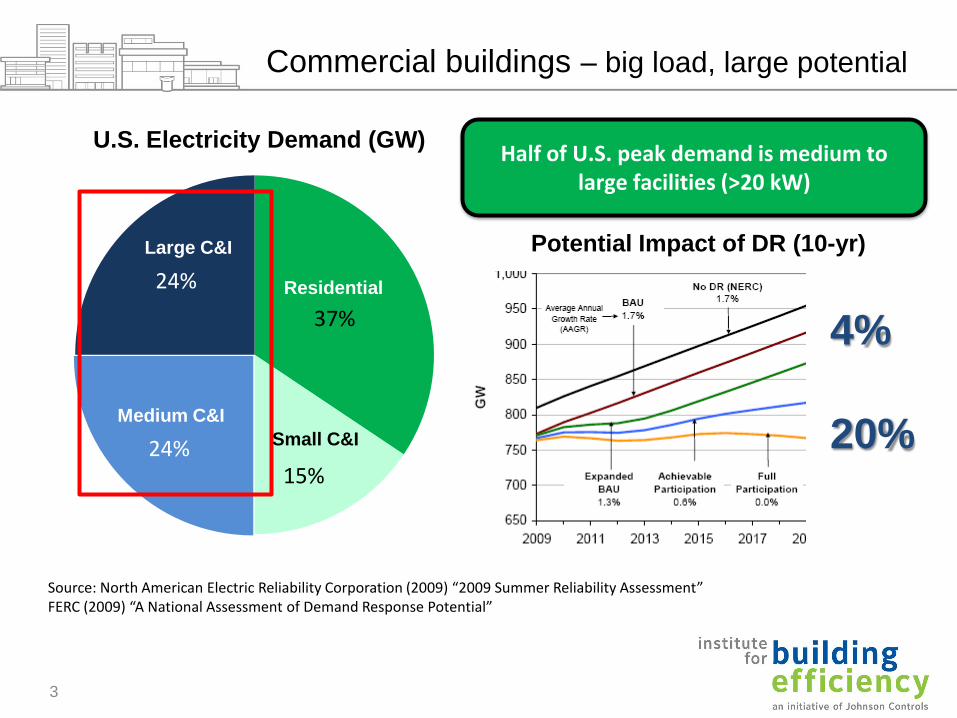
Commercial buildings – big load, large potential
3
Source: North American Electric Reliability Corporation (2009) “2009 Summer Reliability Assessment” FERC (2009) “A National Assessment of Demand Response Potential”
37%
15%24%
24% Residential
Medium C&I
Large C&I
U.S. Electricity Demand (GW)
4%
20%
Potential Impact of DR (10-yr)
Small C&I
Half of U.S. peak demand is medium to large facilities (>20 kW)
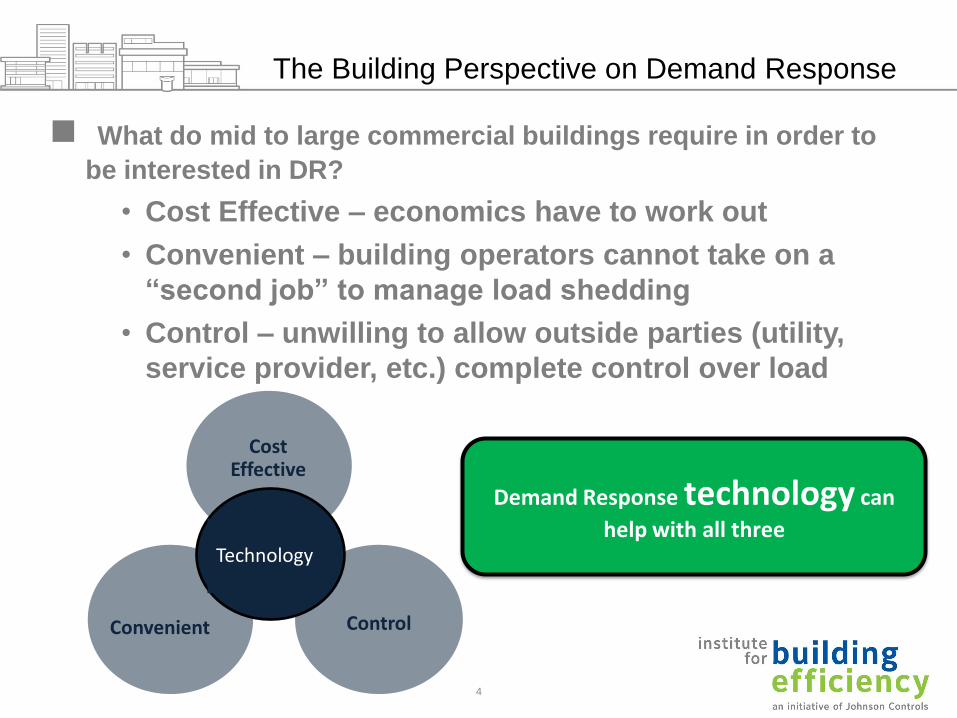
The Building Perspective on Demand Response
What do mid to large commercial buildings require in order to
be interested in DR?
• Cost Effective – economics have to work out
• Convenient – building operators cannot take on a
“second job” to manage load shedding
• Control – unwilling to allow outside parties (utility,
service provider, etc.) complete control over load
Demand Response technology can
help with all three
ControlConvenient
Cost Effective
Technology
4

Cost Effective – Automating DR on Operations Budgets
Source: PG&E/LBNL AutoDR Pilot, 2006.
Median payback of projects under
PG&E’s Auto-DR program is 2.25
years
0 2000 4000 6000 8000 10000 12000 14000
Site 1
Site 2
Site 3
Site 4
Site 5
Site 6
Site 7
Site 8
Site 9
Site 10
Site 11
Site 12
Up-Front Cost ($)
Installation cost for DR automation technology
5

Convenient – If it’s not easy, no one will do it
Source: Global Energy Partners (2007) “PG&E 2007 Auto-DR Program Assessment”
2006 CRA SPP C&I Report; Demand Response Research Center
5% load response
without technology
vs.
10% load response
with auto-DR
technology
Two pilot studies show that automation leads to better response
6

Control – A “Spectrum” of Demand Response Options
Direct Load
Control
(AC Cycling)
Logic, decision making and control can sit with the load-serving entity, the customer, or
anywhere between (e.g. a curtailment service provider):
Pure Real -Time PriceInterruptible Rate
Wholesale Capacity
Programs
Traditional “Aggregator”
Model
Critical Peak Pricing
Wholesale Energy
Programs
Voluntary Demand
Bidding
Central Control Autonomous Control
7
Historical DR has been centrally controlled, but there is a push to the right of the spectrum. Buildings benefit.
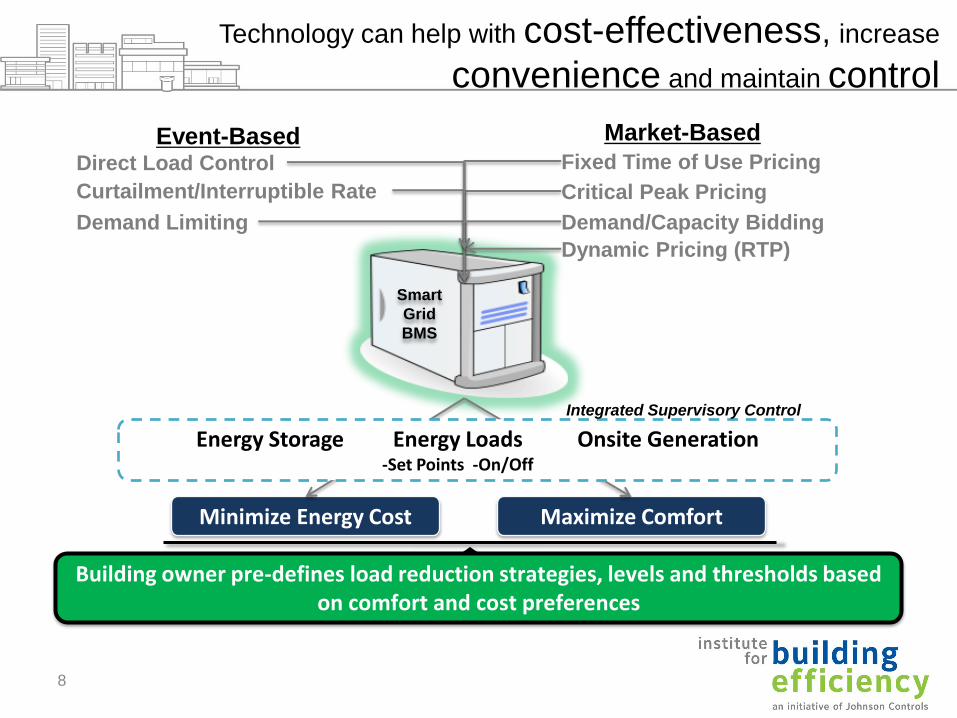
Dynamic Pricing (RTP)
Curtailment/Interruptible Rate
Demand/Capacity Bidding
Direct Load Control
Demand Limiting
Fixed Time of Use Pricing
Critical Peak Pricing
Event-Based Market-Based
Minimize Energy Cost Maximize Comfort
Smart
Grid
BMS
Energy Storage Energy Loads Onsite Generation-Set Points -On/Off
Integrated Supervisory Control
Technology can help with cost-effectiveness, increase
convenience and maintain control
8
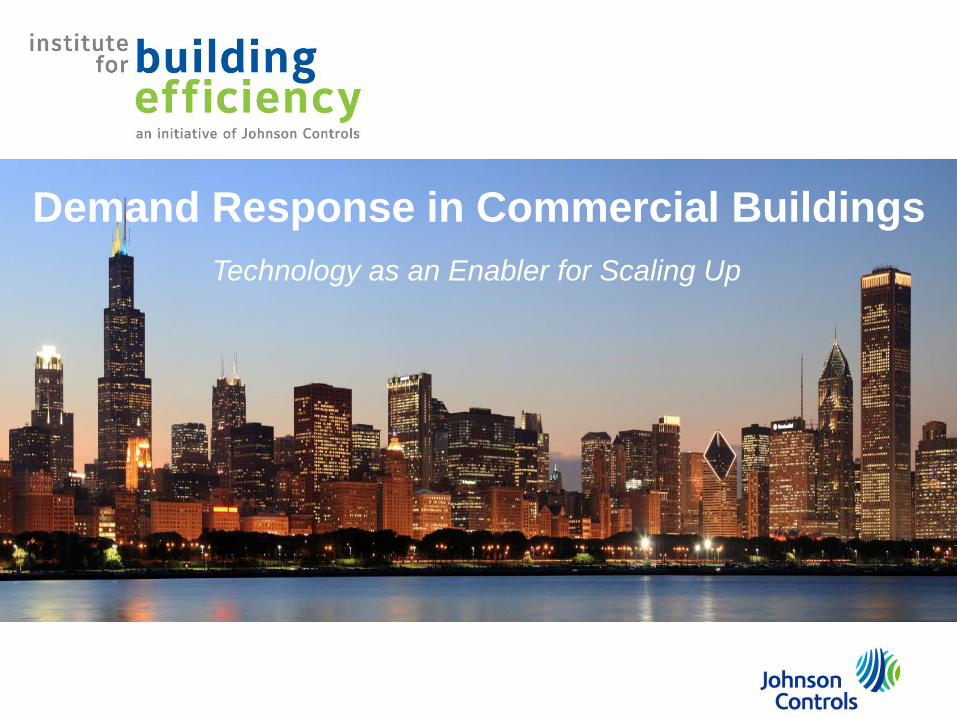
Building owner pre-defines load reduction strategies, levels and thresholds based on comfort and cost preferences
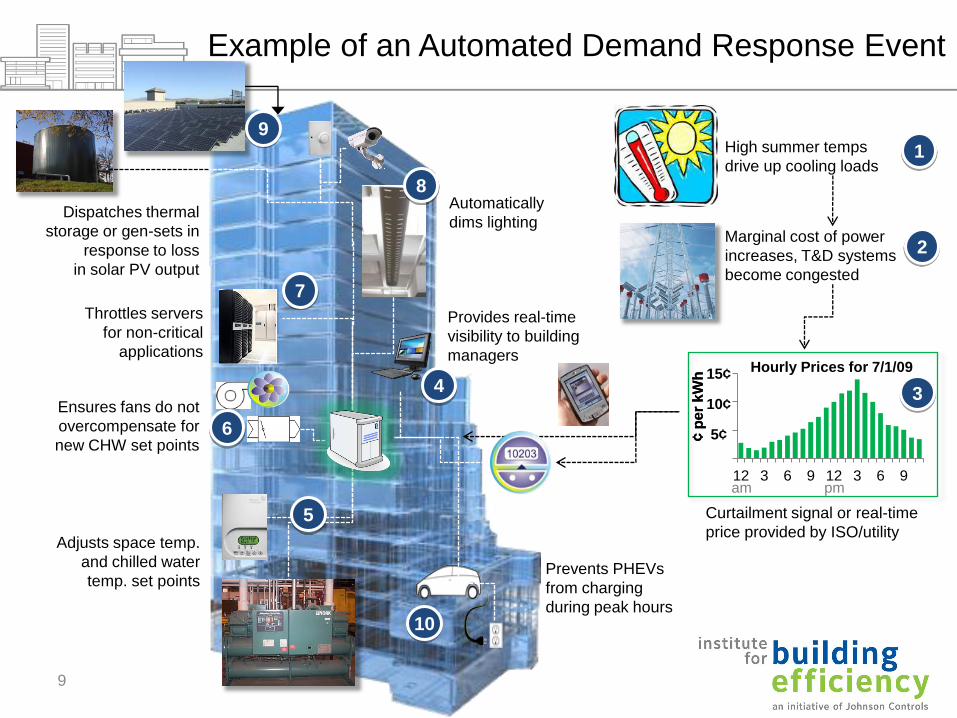
9
12 3 6 9 12 3 6 9
Hourly Prices for 7/1/0915¢
10¢
5¢¢ p
er
kW
h¢ p
er
kW
h
am pm
Prevents PHEVs
from charging
during peak hours
Adjusts space temp.
and chilled water
temp. set points
Dispatches thermal
storage or gen-sets in
response to loss
in solar PV output
Throttles servers
for non-critical
applications
Ensures fans do not
overcompensate for
new CHW set points
Provides real-time
visibility to building
managers
Automatically
dims lightingMarginal cost of power
increases, T&D systems
become congested
Curtailment signal or real-time
price provided by ISO/utility
1
2
3
5
7
8
6
9
10
4
High summer temps
drive up cooling loads
Example of an Automated Demand Response Event
9

Case Study – Automated Demand Response:
Georgia Institute of Technology
• Georgia Institute of Technology is on a
dynamic hourly tariff from Georgia Power.
• Each hour, the building management system
reads prices for the next 48 hours from the
utility’s web-service feed.
• The facilities director sets the price threshold
for automated load shedding mode.
Observing a 1MW peak load reduction, ~7% of load for participating buildings
Savings during initial summer 2006 pilot
10