Embed Size (px)
Citation preview
Combing behaviors at different parameters 2013
Produced By Mr. Sunil Kumar Sharma, Published in Spinning Textiles Magazine, Vol.7, Issue-5, Sept.-Oct. 2013 Edition. Page 1
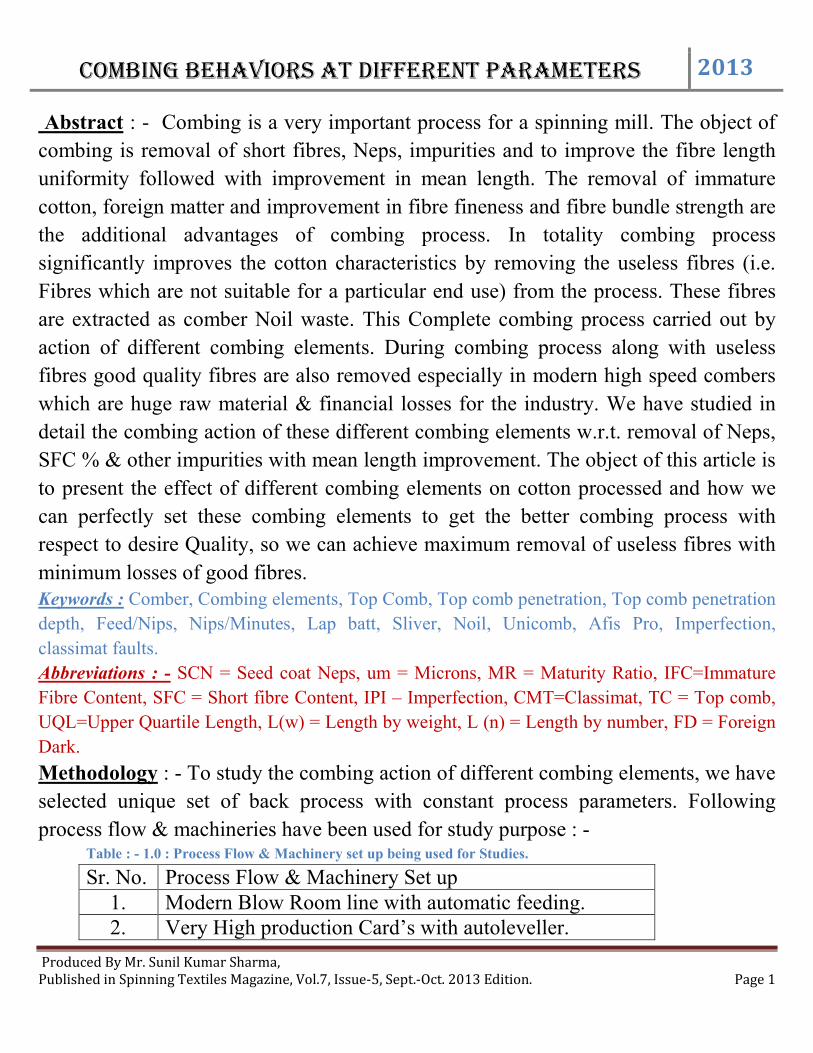
Abstract : - Combing is a very important process for a spinning mill. The object of
combing is removal of short fibres, Neps, impurities and to improve the fibre length
uniformity followed with improvement in mean length. The removal of immature
cotton, foreign matter and improvement in fibre fineness and fibre bundle strength are
the additional advantages of combing process. In totality combing process
significantly improves the cotton characteristics by removing the useless fibres (i.e.
Fibres which are not suitable for a particular end use) from the process. These fibres
are extracted as comber Noil waste. This Complete combing process carried out by
action of different combing elements. During combing process along with useless
fibres good quality fibres are also removed especially in modern high speed combers
which are huge raw material & financial losses for the industry. We have studied in
detail the combing action of these different combing elements w.r.t. removal of Neps,
SFC % & other impurities with mean length improvement. The object of this article is
to present the effect of different combing elements on cotton processed and how we
can perfectly set these combing elements to get the better combing process with
respect to desire Quality, so we can achieve maximum removal of useless fibres with
minimum losses of good fibres. Keywords : Comber, Combing elements, Top Comb, Top comb penetration, Top comb penetration
depth, Feed/Nips, Nips/Minutes, Lap batt, Sliver, Noil, Unicomb, Afis Pro, Imperfection,
classimat faults.
Abbreviations : - SCN = Seed coat Neps, um = Microns, MR = Maturity Ratio, IFC=Immature
Fibre Content, SFC = Short fibre Content, IPI – Imperfection, CMT=Classimat, TC = Top comb,
UQL=Upper Quartile Length, L(w) = Length by weight, L (n) = Length by number, FD = Foreign
Dark.
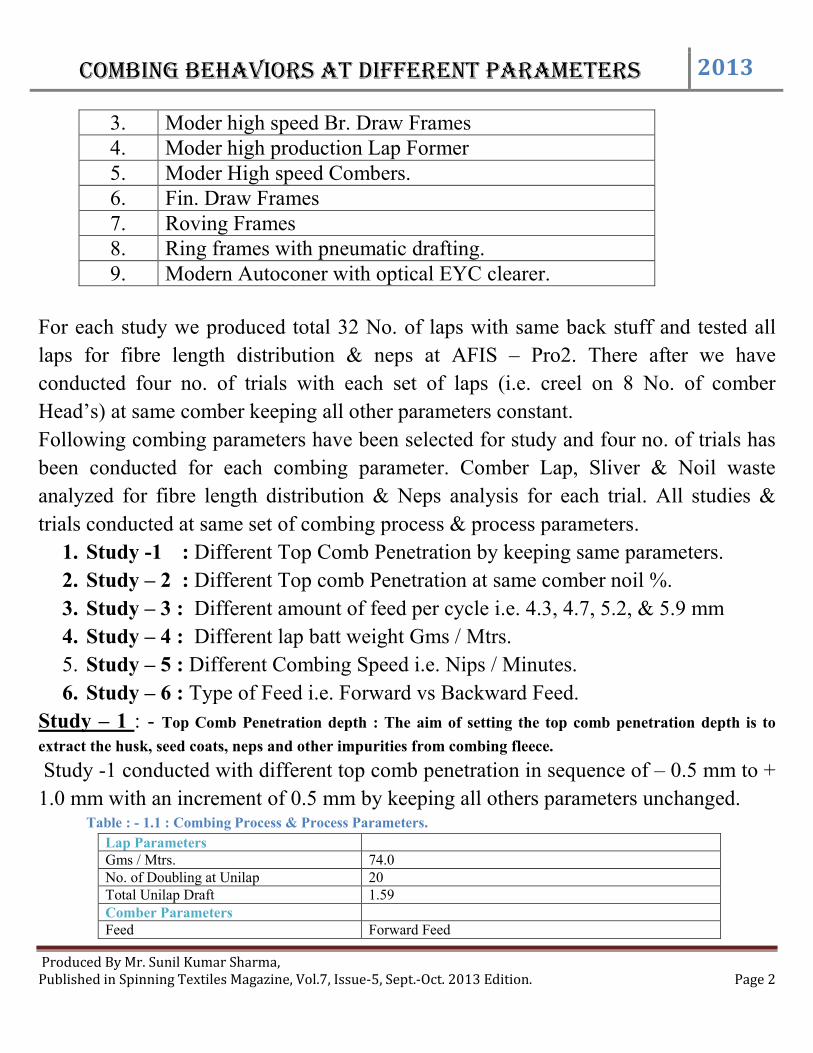
Methodology : - To study the combing action of different combing elements, we have
selected unique set of back process with constant process parameters. Following
process flow & machineries have been used for study purpose : - Table : - 1.0 : Process Flow & Machinery set up being used for Studies. Sr. No. Process Flow & Machinery Set up
1. Modern Blow Room line with automatic feeding. 2. Very High production Card’s with autoleveller.
Combing behaviors at different parameters 2013
Produced By Mr. Sunil Kumar Sharma, Published in Spinning Textiles Magazine, Vol.7, Issue-5, Sept.-Oct. 2013 Edition. Page 2
3. Moder high speed Br. Draw Frames 4. Moder high production Lap Former 5. Moder High speed Combers. 6. Fin. Draw Frames 7. Roving Frames 8. Ring frames with pneumatic drafting. 9. Modern Autoconer with optical EYC clearer.
For each study we produced total 32 No. of laps with same back stuff and tested all
laps for fibre length distribution & neps at AFIS – Pro2. There after we have
conducted four no. of trials with each set of laps (i.e. creel on 8 No. of comber
Head’s) at same comber keeping all other parameters constant.
Following combing parameters have been selected for study and four no. of trials has
been conducted for each combing parameter. Comber Lap, Sliver & Noil waste
analyzed for fibre length distribution & Neps analysis for each trial. All studies &
trials conducted at same set of combing process & process parameters.
1. Study -1 : Different Top Comb Penetration by keeping same parameters.
2. Study – 2 : Different Top comb Penetration at same comber noil %.
3. Study – 3 : Different amount of feed per cycle i.e. 4.3, 4.7, 5.2, & 5.9 mm
4. Study – 4 : Different lap batt weight Gms / Mtrs.
5. Study – 5 : Different Combing Speed i.e. Nips / Minutes.
6. Study – 6 : Type of Feed i.e. Forward vs Backward Feed.
Study – 1 : - Top Comb Penetration depth : The aim of setting the top comb penetration depth is to
extract the husk, seed coats, neps and other impurities from combing fleece.
Study -1 conducted with different top comb penetration in sequence of – 0.5 mm to +
1.0 mm with an increment of 0.5 mm by keeping all others parameters unchanged. Table : - 1.1 : Combing Process & Process Parameters.
Lap Parameters Gms / Mtrs. 74.0 No. of Doubling at Unilap 20 Total Unilap Draft 1.59 Comber Parameters Feed Forward Feed
Combing behaviors at different parameters 2013
Produced By Mr. Sunil Kumar Sharma, Published in Spinning Textiles Magazine, Vol.7, Issue-5, Sept.-Oct. 2013 Edition. Page 3
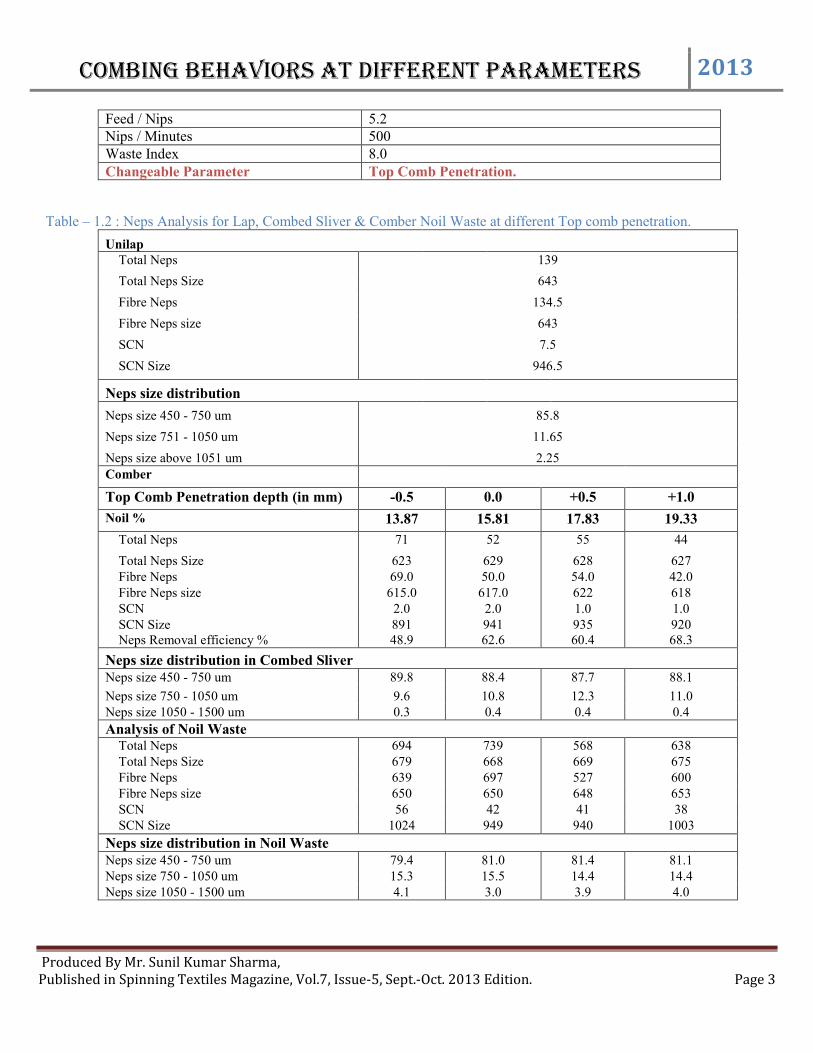
Feed / Nips 5.2 Nips / Minutes 500 Waste Index 8.0 Changeable Parameter Top Comb Penetration.
Table – 1.2 : Neps Analysis for Lap, Combed Sliver & Comber Noil Waste at different Top comb penetration.
Unilap Total Neps 139
Total Neps Size 643
Fibre Neps 134.5
Fibre Neps size 643
SCN 7.5
SCN Size 946.5
Neps size distribution
Neps size 450 - 750 um 85.8
Neps size 751 - 1050 um 11.65
Neps size above 1051 um 2.25 Comber
Top Comb Penetration depth (in mm) -0.5 0.0 +0.5 +1.0
Noil % 13.87 15.81 17.83 19.33
Total Neps 71 52 55 44
Total Neps Size 623 629 628 627 Fibre Neps 69.0 50.0 54.0 42.0 Fibre Neps size 615.0 617.0 622 618 SCN 2.0 2.0 1.0 1.0 SCN Size Neps Removal efficiency %
891 48.9
941 62.6
935 60.4
920 68.3
Neps size distribution in Combed Sliver
Neps size 450 - 750 um 89.8 88.4 87.7 88.1
Neps size 750 - 1050 um 9.6 10.8 12.3 11.0 Neps size 1050 - 1500 um 0.3 0.4 0.4 0.4
Analysis of Noil Waste Total Neps 694 739 568 638 Total Neps Size 679 668 669 675 Fibre Neps 639 697 527 600 Fibre Neps size 650 650 648 653 SCN 56 42 41 38 SCN Size 1024 949 940 1003
Neps size distribution in Noil Waste
Neps size 450 - 750 um 79.4 81.0 81.4 81.1 Neps size 750 - 1050 um 15.3 15.5 14.4 14.4 Neps size 1050 - 1500 um 4.1 3.0 3.9 4.0
Combing behaviors at different parameters
Produced By Mr. Sunil Kumar Sharma, Published in Spinning Textiles Magazine, Vol.7, Issue
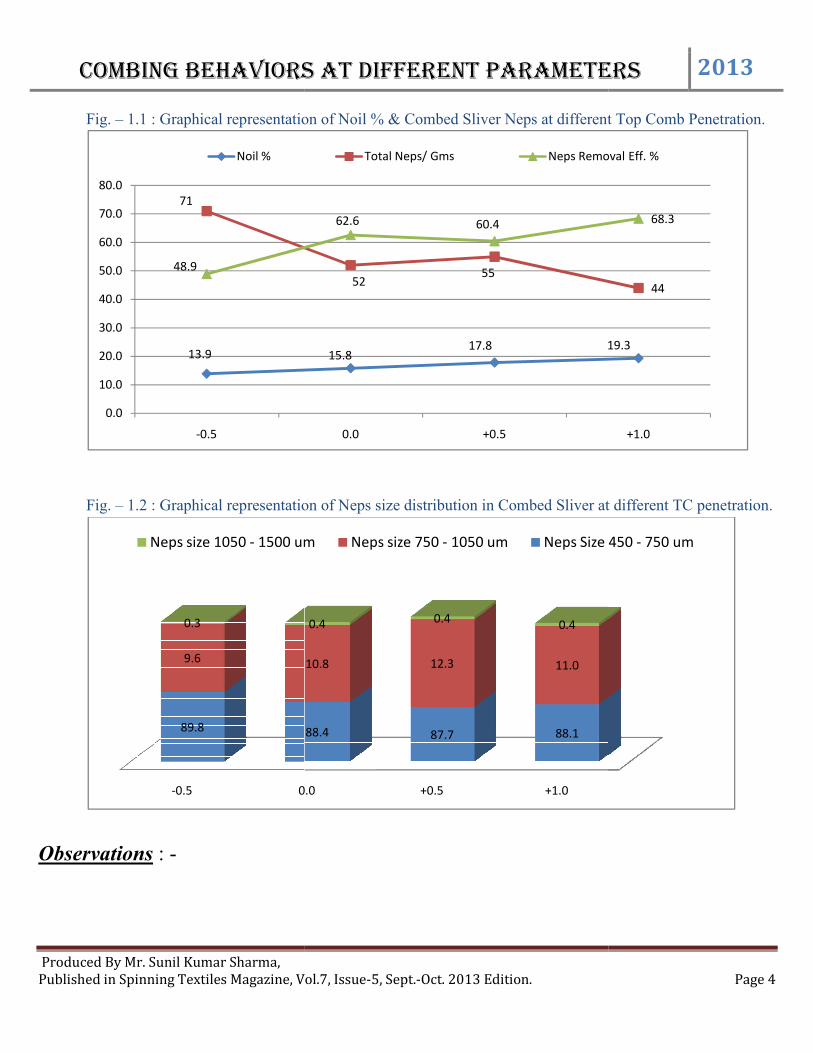
Fig. – 1.1 : Graphical representation of
Fig. – 1.2 : Graphical representation of Neps size d
Observations : -
13.9
71
48.9
0.0
10.0
20.0
30.0
40.0
50.0
60.0
70.0
80.0
-0.5
Noil %
-0.5 0.0
89.8
9.6
0.3
Neps size 1050 - 1500 um
Combing behaviors at different parameters
Vol.7, Issue-5, Sept.-Oct. 2013 Edition.
Graphical representation of Noil % & Combed Sliver Neps at different Top Comb Penetration
Graphical representation of Neps size distribution in Combed Sliver at different TC penetration
15.817.8 19.3
5255
62.6 60.4
0.0 +0.5
Total Neps/ Gms Neps Removal Eff. %
0.0 +0.5 +1.0
88.4 87.7 88.1
10.8 12.3 11.0
0.4 0.4 0.4
1500 um Neps size 750 - 1050 um Neps Size 450
Combing behaviors at different parameters 2013
Page 4
Sliver Neps at different Top Comb Penetration.
at different TC penetration.
19.3
44
68.3
+1.0
Neps Removal Eff. %
Neps Size 450 - 750 um
Combing behaviors at different parameters 2013
Produced By Mr. Sunil Kumar Sharma, Published in Spinning Textiles Magazine, Vol.7, Issue-5, Sept.-Oct. 2013 Edition. Page 5
1. Noil % increases with increase in top comb penetration depth i.e. – 0.5mm to +
1.0mm, subsequently Neps removal efficiency increases significantly. Ref. fig.
1.1
2. There is no significant change observed in neps size of combed sliver with
different TC settings, similarly there is no trend observe in fibre characteristics
of noil extracted at different TC settings. Ref. fig. 1.2
3. It is quite surprise that neps size is not much affected by top comb penetration.
Even bigger neps sizes i.e. above 1000 um were also not affected by increasing
the top com penetration. Ref. fig. 1.2
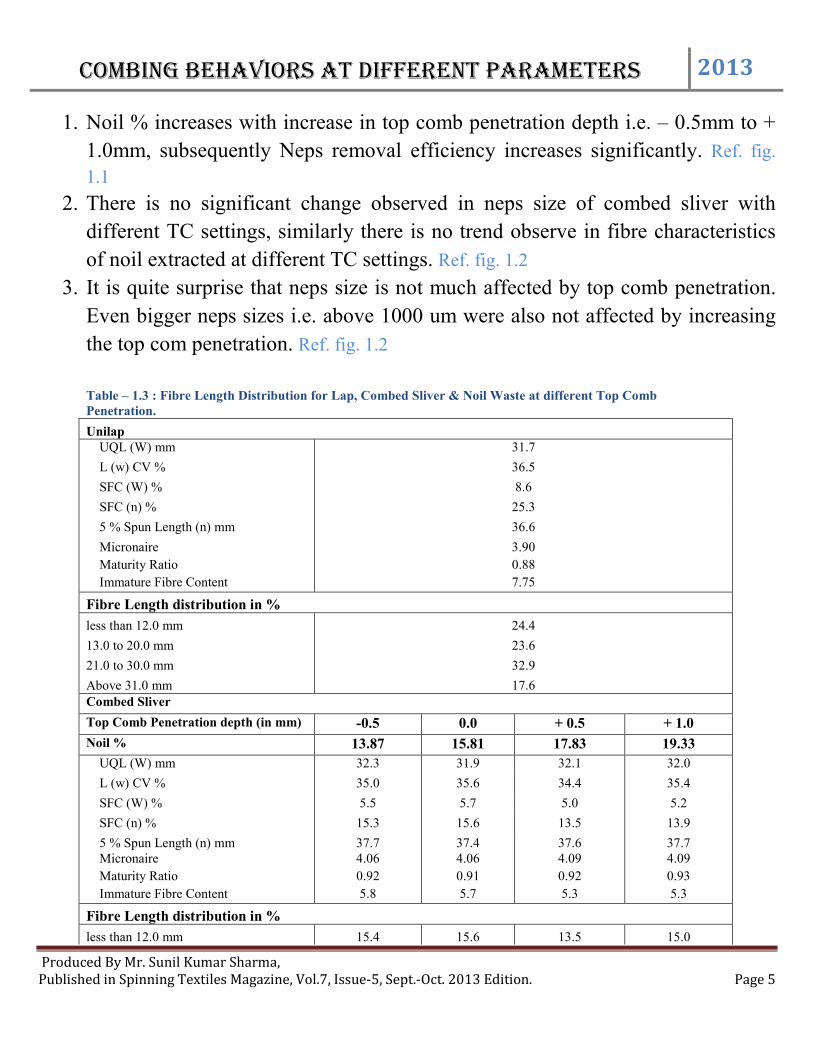
Table – 1.3 : Fibre Length Distribution for Lap, Combed Sliver & Noil Waste at different Top Comb Penetration.
Unilap UQL (W) mm 31.7
L (w) CV % 36.5
SFC (W) % 8.6
SFC (n) % 25.3
5 % Spun Length (n) mm 36.6
Micronaire
Maturity Ratio
Immature Fibre Content
3.90
0.88
7.75
Fibre Length distribution in %
less than 12.0 mm 24.4
13.0 to 20.0 mm 23.6
21.0 to 30.0 mm 32.9
Above 31.0 mm 17.6 Combed Sliver
Top Comb Penetration depth (in mm) -0.5 0.0 + 0.5 + 1.0
Noil % 13.87 15.81 17.83 19.33
UQL (W) mm 32.3 31.9 32.1 32.0
L (w) CV % 35.0 35.6 34.4 35.4
SFC (W) % 5.5 5.7 5.0 5.2
SFC (n) % 15.3 15.6 13.5 13.9
5 % Spun Length (n) mm Micronaire
Maturity Ratio
Immature Fibre Content
37.7 4.06
0.92
5.8
37.4 4.06
0.91
5.7
37.6 4.09
0.92
5.3
37.7 4.09
0.93
5.3
Fibre Length distribution in %
less than 12.0 mm 15.4 15.6 13.5 15.0
Combing behaviors at different parameters 2013
Produced By Mr. Sunil Kumar Sharma, Published in Spinning Textiles Magazine, Vol.7, Issue-5, Sept.-Oct. 2013 Edition. Page 6
13.0 to 20.0 mm 27.0 28.4 27.8 30.0
21.0 to 30.0 mm 36.1 35.9 37.4 34.9
Above 31.0 mm 19.6 17.9 19.3 13.4
Analysis of Noil Waste UQL (W) mm 16.0 15.3 15.4 16.3
SFC (W) % 57.6 59.8 59.4 55.8
SFC (n) % 79.5 80.8 80.1 78.0
5 % Spun Length (n) mm Micronaire
Maturity Ratio
Immature Fibre Content
19.7 3.40 0.68 20.3
18.9 3.43 0.67 20.8
19.2 3.40 0.68 20.1
20.3 3.43 0.68 19.2
Fibre Length distribution in %
less than 12.0 mm 79.5 80.9 80.2 77.9
13.0 to 20.0 mm 15.8 15.3 15.4 16.9
21.0 to 30.0 mm 0.3 3.5 3.6 4.4
Above 31.0 mm 0.5 0.6 0.6 0.8
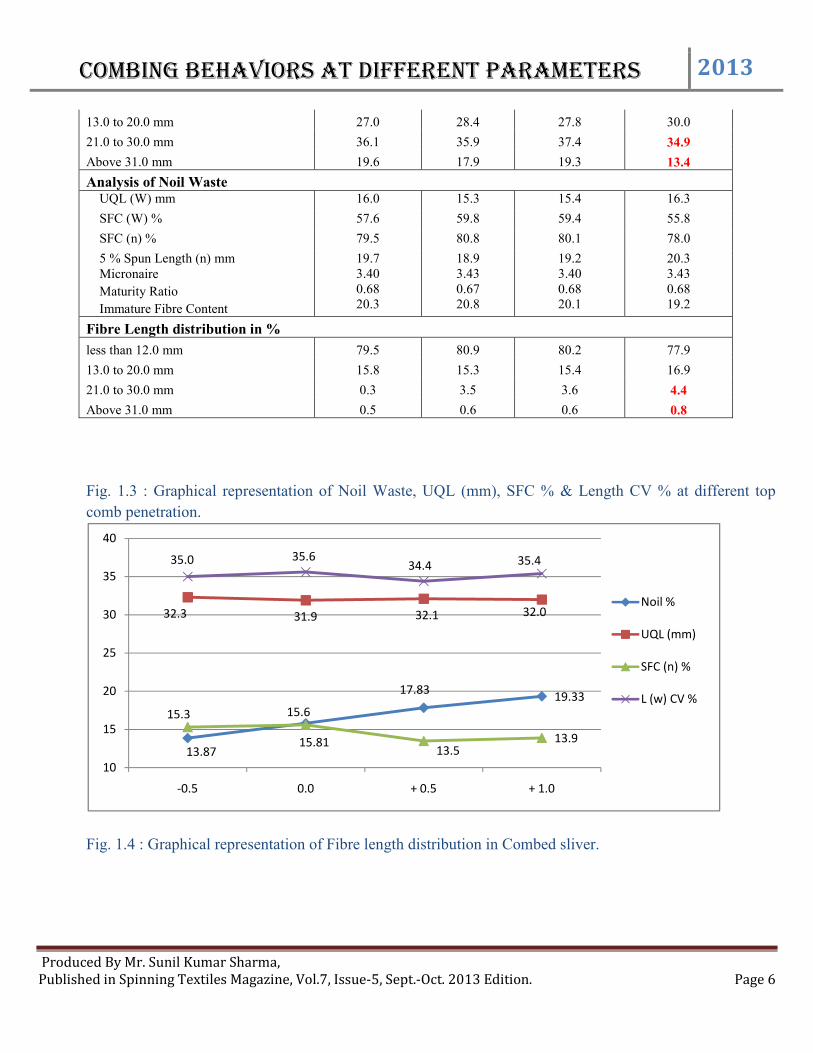
Fig. 1.3 : Graphical representation of Noil Waste, UQL (mm), SFC % & Length CV % at different top
comb penetration.
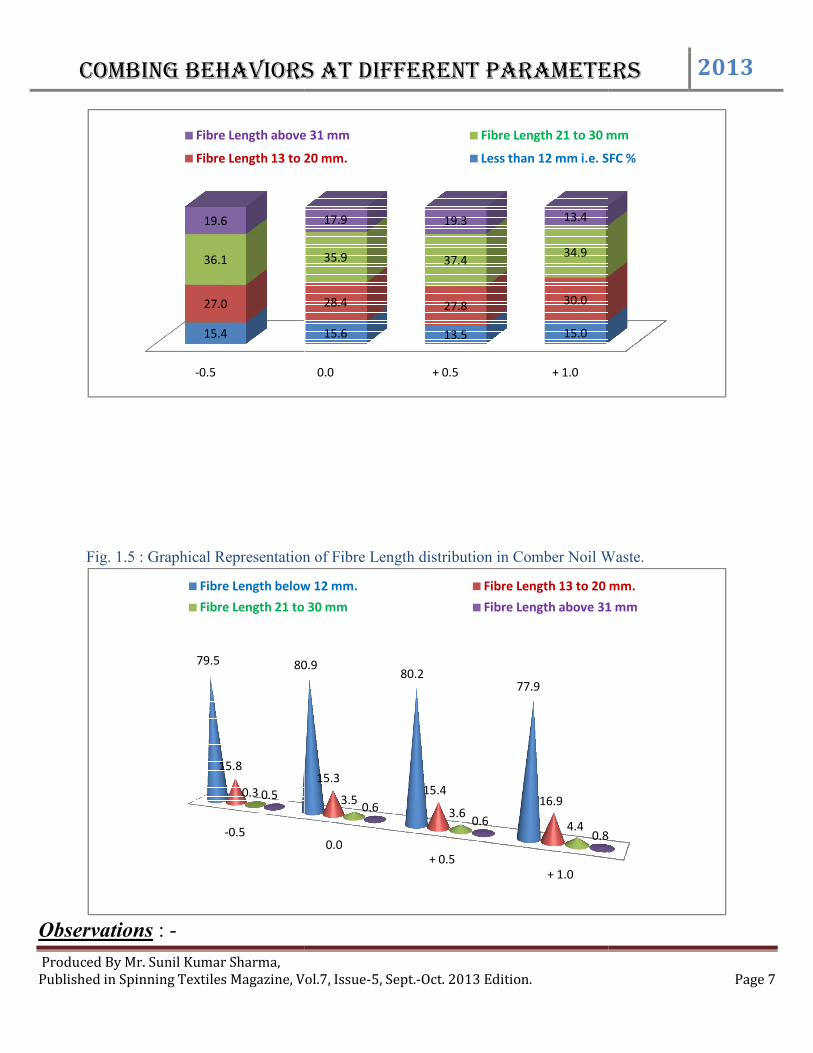
Fig. 1.4 : Graphical representation of Fibre length distribution in Combed sliver.
13.8715.81
17.8319.33
32.3 31.9 32.1 32.0
15.3 15.6
13.513.9
35.0 35.634.4 35.4
10
15
20
25
30
35
40
-0.5 0.0 + 0.5 + 1.0
Noil %
UQL (mm)
SFC (n) %
L (w) CV %
Combing behaviors at different parameters
Produced By Mr. Sunil Kumar Sharma, Published in Spinning Textiles Magazine, Vol.7, Issue
Fig. 1.5 : Graphical Representation of Fibre Length distribution in Comber Noil Waste.
Observations : -
-0.5
15.4
27.0
36.1
19.6
Fibre Length above 31 mm
Fibre Length 13 to 20 mm.
-0.5
79.5 80.9
15.8
0.3 0.5
Fibre Length below 12 mm.
Fibre Length 21 to 30 mm
Combing behaviors at different parameters
Vol.7, Issue-5, Sept.-Oct. 2013 Edition.
5 : Graphical Representation of Fibre Length distribution in Comber Noil Waste.
0.0 + 0.5 + 1.0
15.6 13.5 15.0
28.4 27.8 30.0
35.9 37.434.9
17.9 19.3 13.4
Fibre Length above 31 mm Fibre Length 21 to 30 mm
Fibre Length 13 to 20 mm. Less than 12 mm i.e. SFC %
0.0+ 0.5
+ 1.0
80.980.2
77.9
15.315.4
16.93.53.6
4.4
0.60.6
0.8
Fibre Length below 12 mm. Fibre Length 13 to 20 mm.
Fibre Length 21 to 30 mm Fibre Length above 31 mm
Combing behaviors at different parameters 2013
Page 7
5 : Graphical Representation of Fibre Length distribution in Comber Noil Waste.
Fibre Length 21 to 30 mm
Less than 12 mm i.e. SFC %
0.8
Fibre Length 13 to 20 mm.
Fibre Length above 31 mm
Combing behaviors at different parameters 2013
Produced By Mr. Sunil Kumar Sharma, Published in Spinning Textiles Magazine, Vol.7, Issue-5, Sept.-Oct. 2013 Edition. Page 8
1. There are no significant difference observed in fibre length UQL, length CV %,
SFC % & 5 % spun length at different top comb penetration even with significant
increase in comber Noil %. Refer Fig. 1.3
2. Fibre length above 21.0 mm significantly reduces in combed sliver with + 1.0 mm
top comb penetration as compared with lower TC penetration depth. Same thing
confirmed through comber Noil analysis, where fibre length more than 21.0 mm
observed high with + 1.0 mm TC penetration as compare to lower TC penetration.
This might be due to significant difference in Noil %. Refer Fig. 1.4 & 1.5
3. It has been observed that lower micronaire & immature fibres significantly
removed after combing and goes with comber noil waste. However there is no
trend observed with respect to change in top comb penetration. Table – 1.4 : Yarn Results at different Top comb penetration with different Noil %. Comber T.C. Penetration (in mm) -0.5 0.0 +0.5 +1.0
Comber Noil % 13.9 15.8 17.8 19.3
Finisher Draw Frame U % 1.85 1.81 1.75 1.68
Ring Yarn Results
U % 9.31 9.07 8.76 8.65
Thin (-50%) 0.3 0.1 0.0 0.0
Thick (+50%) 25.9 22.3 15.6 9.6
Neps (+200%) 110.5 85.3 56.7 41.9
Total 137 108 72 52
Hairiness 5.25 5.20 5.09 5.55
Sh 1.05 1.00 1.01 1.04
FD /KM 1.90 1.75 1.75 1.00
Veg/Km 1.05 1.20 1.20 0.45
RKM 17.2 17.9 17.7 17.9
RKM CV% 6.80 6.50 6.70 6.50
Elong. 4.06 3.79 4.00 3.95
Elong CV% 10.10 9.60 11.10 8.70
Classimat - Cop /100 KM Objectionable Faults - Short Class
(A4+B4+B3+C4+C3+C2+D4+D3+D2+D1) 23.0 16.0 12.0 15.0 Long faults - ( E+F+G) 8.0 12.0 7.0 7.0 Long thin faults ( I1+I2) 0.0 0.0 0.0 0.0 Thin faults ( H1+H2) 0.0 0.0 0.0 0.0 Remaining short faults (A3+B2+C1) 14.0 10.0 8.0 12.0 Raw material faults (A1+A2+B1) 68.9 72.0 77.0 94.0
Combing behaviors at different parameters 2013
Produced By Mr. Sunil Kumar Sharma, Published in Spinning Textiles Magazine, Vol.7, Issue-5, Sept.-Oct. 2013 Edition. Page 9
Total faults all classes 114 110 104 128
Clearer Cuts / 100 KM
Total Cuts 52 36 57 47
Neps Cuts 0 0 0 0
Short Cuts 16 18 31 19
Long Cuts 8 8 11 12
Thin Cuts 4 3 1 2
Foreign fibre Cuts 16 9 10 12
Off Count Cuts 1 0 0 0
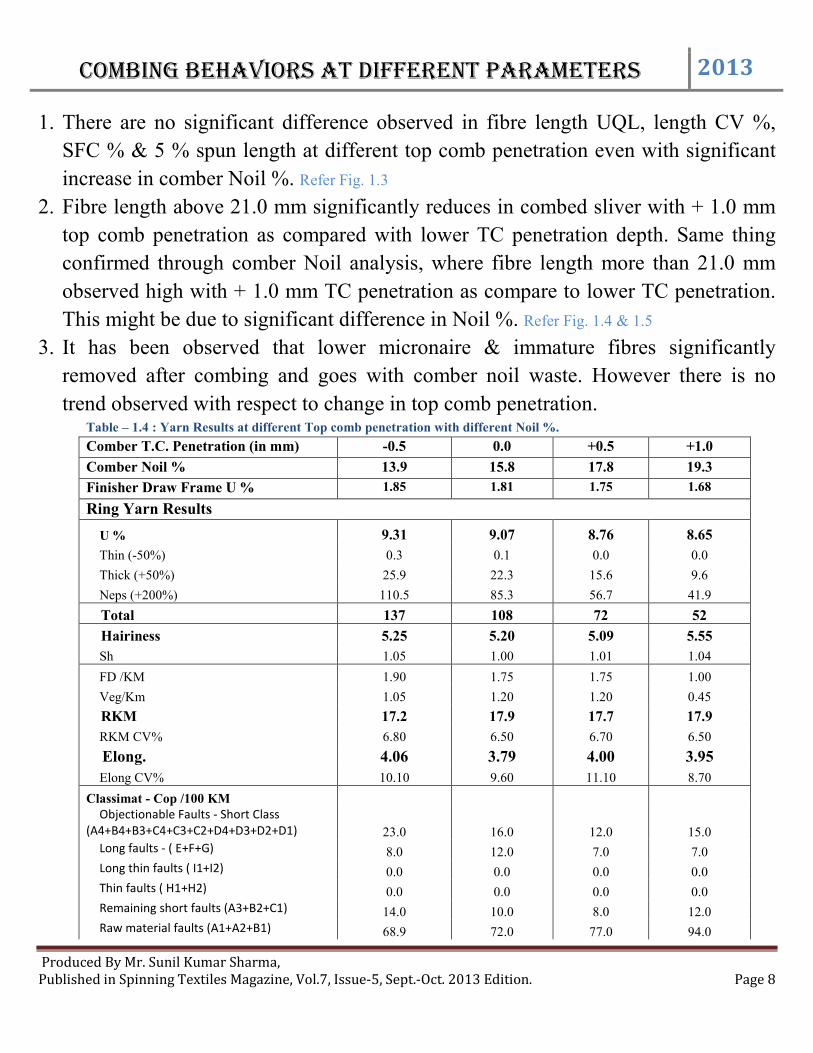
Fig. 1.6 : Graphical Representation of Total Yarn imperfection, U % & Noil % at different top comb
penetration.
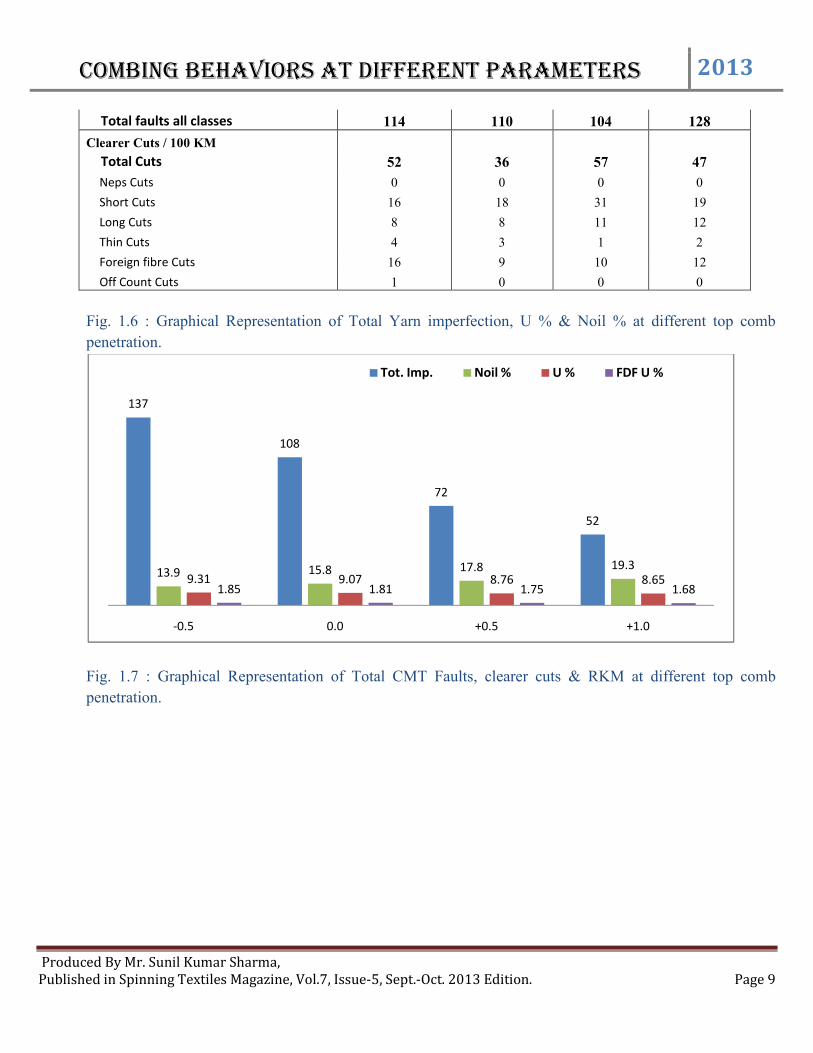
Fig. 1.7 : Graphical Representation of Total CMT Faults, clearer cuts & RKM at different top comb
penetration.
137
108
72
52
13.9 15.8 17.8 19.39.31 9.07 8.76 8.65
1.85 1.81 1.75 1.68
-0.5 0.0 +0.5 +1.0
Tot. Imp. Noil % U % FDF U %
Combing behaviors at different parameters
Produced By Mr. Sunil Kumar Sharma, Published in Spinning Textiles Magazine, Vol.7, Issue
Observations : -
1. Yarn U % & imperfection reduces significantly with increase in top comb
penetration with increase in comber
2. There is no trend observed for
deferent TC penetration. Ref. fig. 1.
Study – 2 : - Different Top comb penetration at same comber Noil %
Study -2 conducted with different top comb penetration in sequence of
1.0 mm with an increment of 0.5 mm
all others parameters unchanged. Table : - 2.1 : Combing Process & Process Parameters.
Lap Parameters Gms / Mtrs. No. of Doubling at Unilap Total Unilap Draft Comber Parameters Feed Feed / Nips Nips / Minutes Waste Index Changeable Parameter
-0.5
114 110
52
17.2
Total CMT Faults / 100 Km.
Combing behaviors at different parameters
Vol.7, Issue-5, Sept.-Oct. 2013 Edition.
Yarn U % & imperfection reduces significantly with increase in top comb
penetration with increase in comber noil %. Ref. fig. 1.6
There is no trend observed for classimat faults, clearer cuts & yarn RKM with
Ref. fig. 1.7
Different Top comb penetration at same comber Noil %
2 conducted with different top comb penetration in sequence of
1.0 mm with an increment of 0.5 mm by maintaining the same Noil % with
all others parameters unchanged. 1 : Combing Process & Process Parameters.
74.0 20 1.59 Forward Feed 5.2 500 Adjustable to set the 19.5 % Noil. Top Comb Penetration.
0.0 +0.5 +1.0
110104
128
36
57
17.9 17.7
Total CMT Faults / 100 Km. Clearer Cuts / 100 Km. RKM
Combing behaviors at different parameters 2013
Page 10
Yarn U % & imperfection reduces significantly with increase in top comb
classimat faults, clearer cuts & yarn RKM with
Different Top comb penetration at same comber Noil %
2 conducted with different top comb penetration in sequence of – 0.5 mm to +
by maintaining the same Noil % with keeping
+1.0
47
17.9
RKM
Combing behaviors at different parameters 2013
Produced By Mr. Sunil Kumar Sharma, Published in Spinning Textiles Magazine, Vol.7, Issue-5, Sept.-Oct. 2013 Edition. Page 11
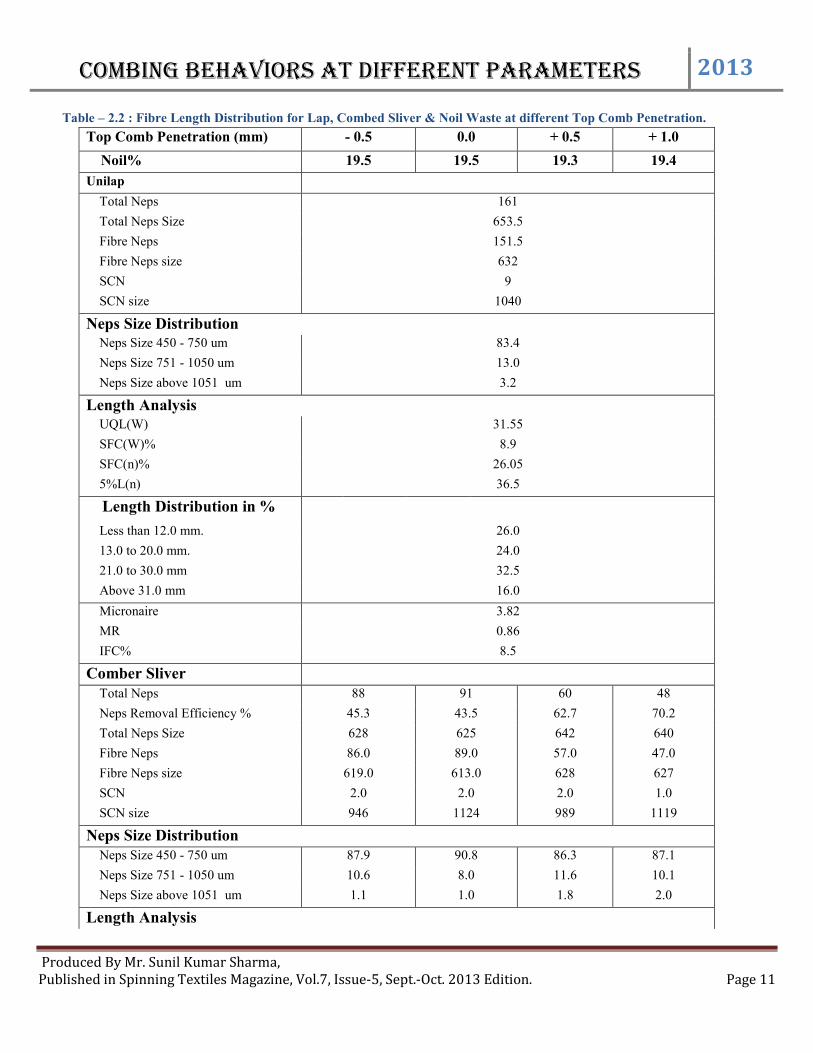
Table – 2.2 : Fibre Length Distribution for Lap, Combed Sliver & Noil Waste at different Top Comb Penetration. Top Comb Penetration (mm) - 0.5 0.0 + 0.5 + 1.0
Noil% 19.5 19.5 19.3 19.4
Unilap
Total Neps 161
Total Neps Size 653.5
Fibre Neps 151.5
Fibre Neps size 632
SCN 9
SCN size 1040
Neps Size Distribution Neps Size 450 - 750 um 83.4
Neps Size 751 - 1050 um 13.0
Neps Size above 1051 um 3.2
Length Analysis UQL(W) 31.55
SFC(W)% 8.9
SFC(n)% 26.05
5%L(n) 36.5
Length Distribution in %
Less than 12.0 mm. 26.0
13.0 to 20.0 mm. 24.0
21.0 to 30.0 mm 32.5
Above 31.0 mm 16.0
Micronaire 3.82
MR 0.86
IFC% 8.5
Comber Sliver
Total Neps 88 91 60 48
Neps Removal Efficiency % 45.3 43.5 62.7 70.2
Total Neps Size 628 625 642 640
Fibre Neps 86.0 89.0 57.0 47.0
Fibre Neps size 619.0 613.0 628 627
SCN 2.0 2.0 2.0 1.0
SCN size 946 1124 989 1119
Neps Size Distribution Neps Size 450 - 750 um 87.9 90.8 86.3 87.1
Neps Size 751 - 1050 um 10.6 8.0 11.6 10.1
Neps Size above 1051 um 1.1 1.0 1.8 2.0
Length Analysis
Combing behaviors at different parameters 2013
Produced By Mr. Sunil Kumar Sharma, Published in Spinning Textiles Magazine, Vol.7, Issue-5, Sept.-Oct. 2013 Edition. Page 12
UQL(W) 31.7 31.9 32.0 31.9
SFC(W)% 5.2 5.4 4.6 4.9
SFC(n)% 14.4 14.8 12.7 13.5
5%L(n) 37.7 37.8 37.6 37.7
Length Distribution in %
Less than 12.0 mm. 14.4 14.6 12.7 13.5
13.0 to 20.0 mm. 29.7 29.5 28.8 28.8
21.0 to 30.0 mm 36.9 36.2 37.9 37.5
Above 31.0 mm 16.7 17.0 18.3 18.0
Micronaire 4.04 4.04 4.04 4.06
MR 0.91 0.91 0.92 0.92
IFC% 6.0 6.3 5.7 5.6
Noil Waste
Total Neps 825 732 722 750
Total Neps Size 674 675 667 676
Fibre Neps 779 685 684 709
Fibre Neps size 653 653 649 654
SCN 46 46 38 41
SCN size 1032 1012 988 1061
Neps Size Distribution Neps Size 450 - 750 um 80.1 80.1 80.9 81.2
Neps Size 751 - 1050 um 15.2 15.9 15.2 13.9
Neps Size above 1051 um 3.8 3.7 3.2 4.1
Length Analysis UQL(W) 16.5 16.4 16.4 15.8
SFC(W)% 53 53.2 54.3 56.9
SFC(n)% 75.5 75.6 76.6 78.6
5%L(n) 20.3 20.5 20.3 19.4
Length Distribution in %
Less than 12.0 mm. 75.6 75.7 76.5 78.6
13.0 to 20.0 mm. 19.3 18.9 18.1 17.0
Above 21.0 mm 5.3 5.4 5.3 4.3
Micronaire 3.43 3.40 3.38 3.45
MR 0.68 0.68 0.68 0.66
IFC% 20.1 19.3 19.9 21.7
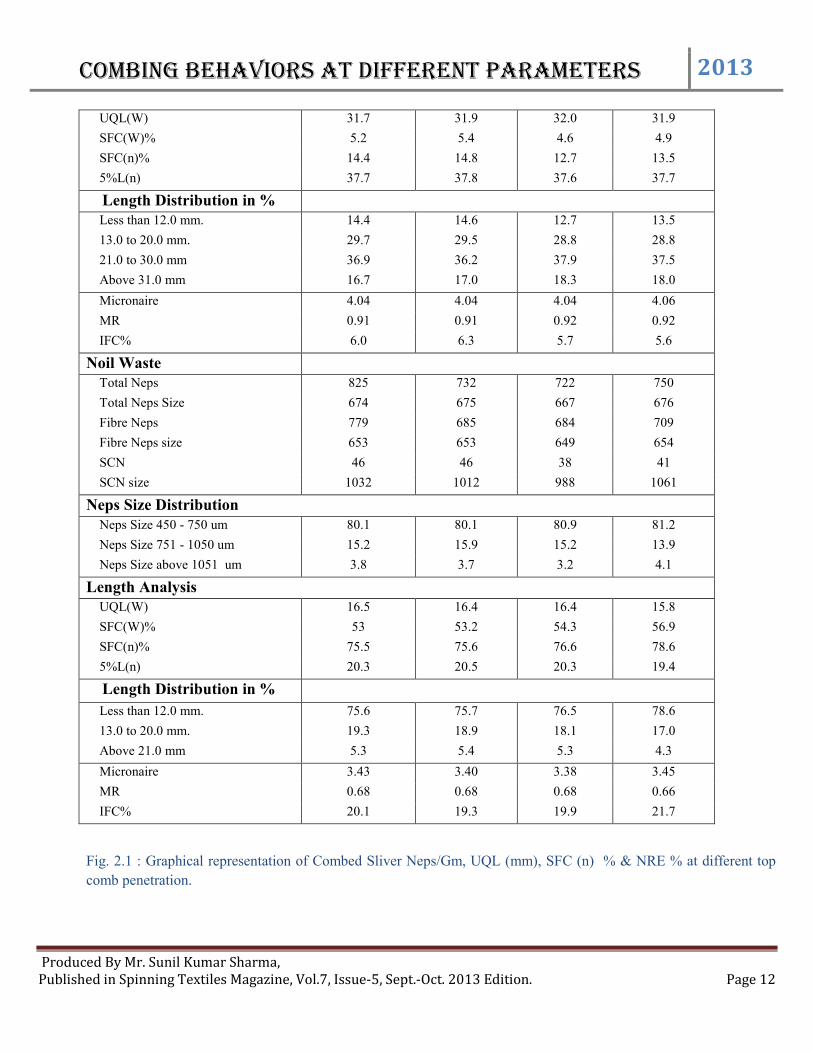
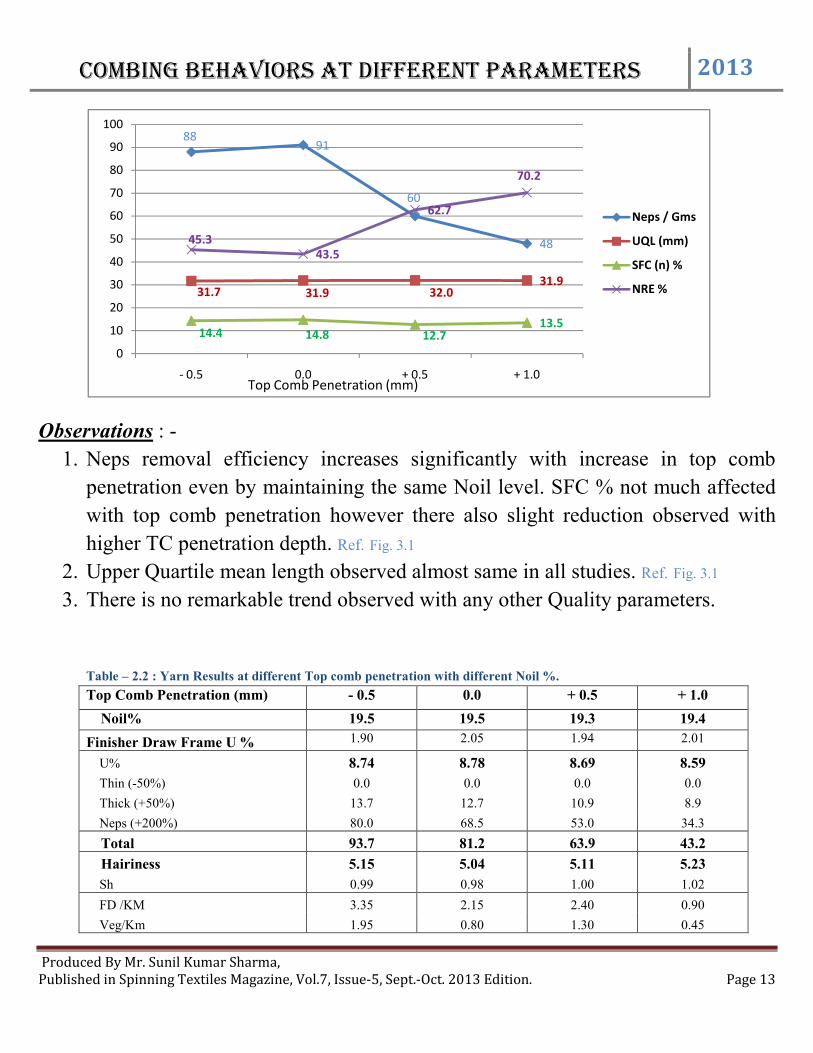
Fig. 2.1 : Graphical representation of Combed Sliver Neps/Gm, UQL (mm), SFC (n) % & NRE % at different top
comb penetration.
Combing behaviors at different parameters 2013
Produced By Mr. Sunil Kumar Sharma, Published in Spinning Textiles Magazine, Vol.7, Issue-5, Sept.-Oct. 2013 Edition. Page 13
Observations : -
1. Neps removal efficiency increases significantly with increase in top comb
penetration even by maintaining the same Noil level. SFC % not much affected
with top comb penetration however there also slight reduction observed with
higher TC penetration depth. Ref. Fig. 3.1
2. Upper Quartile mean length observed almost same in all studies. Ref. Fig. 3.1
3. There is no remarkable trend observed with any other Quality parameters.
Table – 2.2 : Yarn Results at different Top comb penetration with different Noil %.
Top Comb Penetration (mm) - 0.5 0.0 + 0.5 + 1.0
Noil% 19.5 19.5 19.3 19.4
Finisher Draw Frame U % 1.90 2.05 1.94 2.01
U% 8.74 8.78 8.69 8.59
Thin (-50%) 0.0 0.0 0.0 0.0
Thick (+50%) 13.7 12.7 10.9 8.9
Neps (+200%) 80.0 68.5 53.0 34.3
Total 93.7 81.2 63.9 43.2
Hairiness 5.15 5.04 5.11 5.23
Sh 0.99 0.98 1.00 1.02
FD /KM 3.35 2.15 2.40 0.90
Veg/Km 1.95 0.80 1.30 0.45
8891
60
48
31.7 31.9 32.031.9
14.4 14.8 12.713.5
45.343.5
62.7
70.2
0
10
20
30
40
50
60
70
80
90
100
- 0.5 0.0 + 0.5 + 1.0
Neps / Gms
UQL (mm)
SFC (n) %
NRE %
Top Comb Penetration (mm)
Combing behaviors at different parameters
Produced By Mr. Sunil Kumar Sharma, Published in Spinning Textiles Magazine, Vol.7, Issue
RKM
RKM CV%
Elong.
Elong CV%
Classimat - Cops (/100 KM) Objectionable Faults - Short Class
(A4+B4+B3+C4+C3+C2+D4+D3+D2+D1) Long faults - ( E+F+G)
Long thin faults ( I1+I2)
Thin faults ( H1+H2)
Remaining short faults (A3+B2+C1)
Raw material faults (A1+A2+B1)
Total faults
Clearer Cuts/100Km
Total Cuts
Neps Cuts
Short Cuts
Long Cuts
Thin Cuts
Foreign fibre Cuts
Off Count Cuts
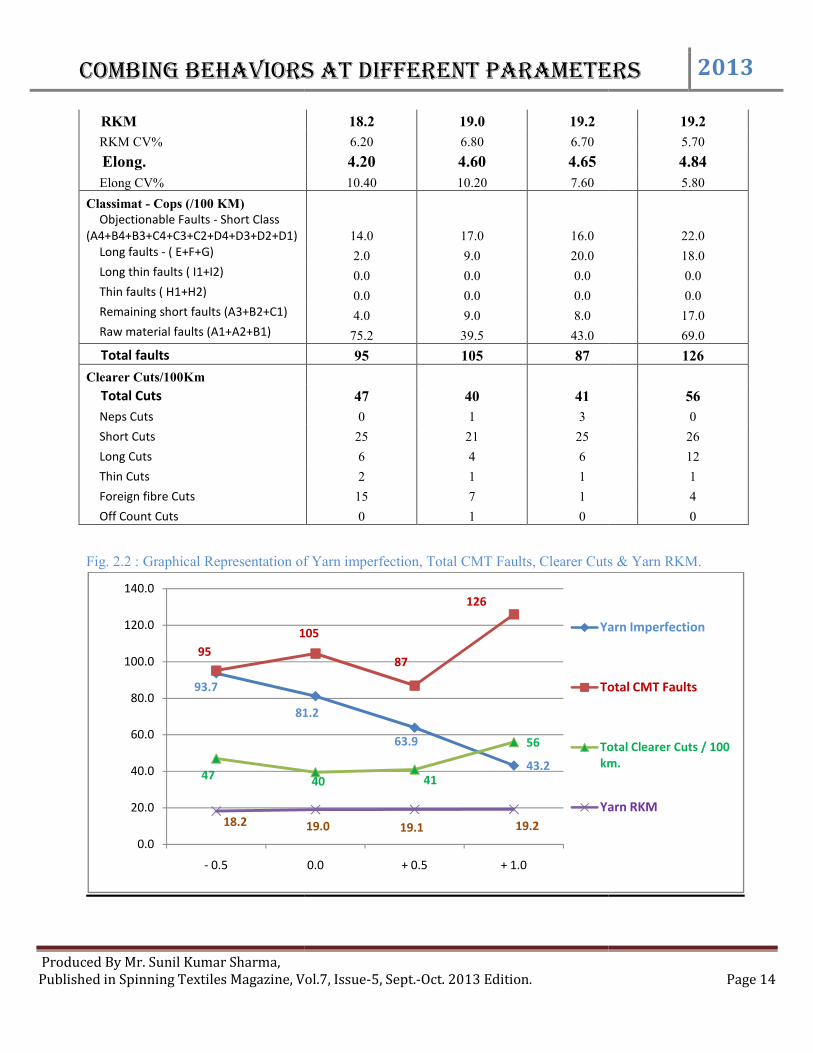
Fig. 2.2 : Graphical Representation of Yarn imperfection, Total CMT Faults,
93.7
81.2
95
105
47
18.2
0.0
20.0
40.0
60.0
80.0
100.0
120.0
140.0
- 0.5
Combing behaviors at different parameters
Vol.7, Issue-5, Sept.-Oct. 2013 Edition.
18.2 19.0 19.2
6.20 6.80 6.70
4.20 4.60 4.65
10.40 10.20 7.60
14.0 17.0 16.0
2.0 9.0 20.0
0.0 0.0 0.0
0.0 0.0 0.0
4.0 9.0 8.0
75.2 39.5 43.0
95 105 87
47 40 41
0 1 3
25 21 25
6 4 6
2 1 1
15 7 1
0 1 0
Graphical Representation of Yarn imperfection, Total CMT Faults, Clearer Cuts & Yarn RKM.
81.2
63.9
43.2
105
87
126
40 41
56
19.0 19.1 19.2
0.0 + 0.5 + 1.0
Yarn Imperfection
Total CMT Faults
Total Clearer Cuts / 100 km.
Yarn RKM
Combing behaviors at different parameters 2013
Page 14
19.2
5.70
4.84
5.80
22.0
18.0
0.0
0.0
17.0
69.0
126
56
0
26
12
1
4
0
Cuts & Yarn RKM.
Yarn Imperfection
Total CMT Faults
Total Clearer Cuts / 100 km.
Yarn RKM
Combing behaviors at different parameters 2013
Produced By Mr. Sunil Kumar Sharma, Published in Spinning Textiles Magazine, Vol.7, Issue-5, Sept.-Oct. 2013 Edition. Page 15
Observations : -
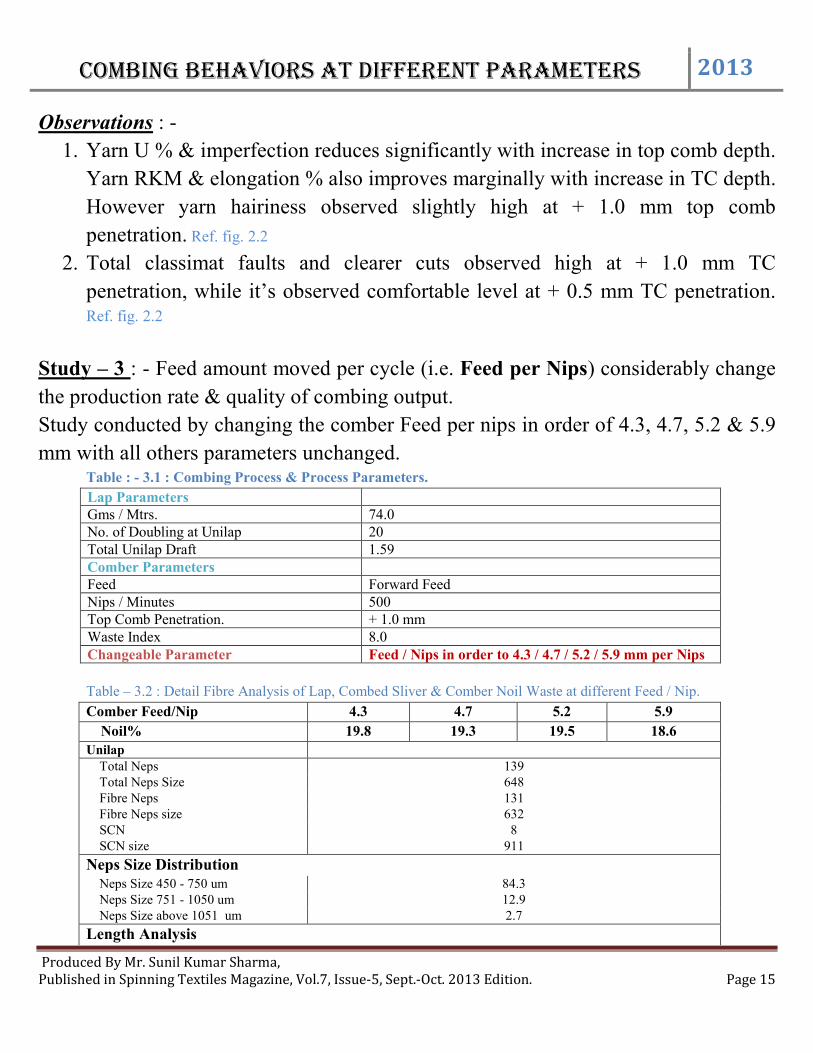
1. Yarn U % & imperfection reduces significantly with increase in top comb depth.
Yarn RKM & elongation % also improves marginally with increase in TC depth.
However yarn hairiness observed slightly high at + 1.0 mm top comb
penetration. Ref. fig. 2.2
2. Total classimat faults and clearer cuts observed high at + 1.0 mm TC
penetration, while it’s observed comfortable level at + 0.5 mm TC penetration. Ref. fig. 2.2
Study – 3 : - Feed amount moved per cycle (i.e. Feed per Nips) considerably change
the production rate & quality of combing output.
Study conducted by changing the comber Feed per nips in order of 4.3, 4.7, 5.2 & 5.9
mm with all others parameters unchanged. Table : - 3.1 : Combing Process & Process Parameters.
Lap Parameters Gms / Mtrs. 74.0 No. of Doubling at Unilap 20 Total Unilap Draft 1.59 Comber Parameters Feed Forward Feed Nips / Minutes 500 Top Comb Penetration. + 1.0 mm Waste Index 8.0 Changeable Parameter Feed / Nips in order to 4.3 / 4.7 / 5.2 / 5.9 mm per Nips
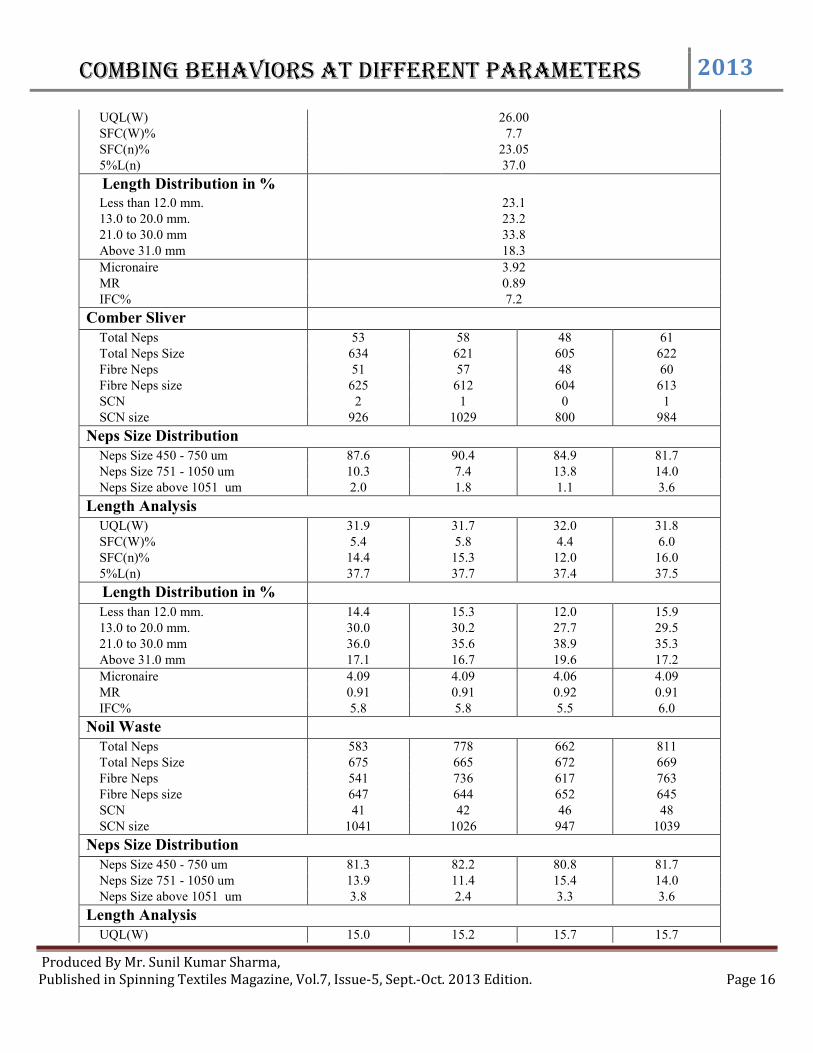
Table – 3.2 : Detail Fibre Analysis of Lap, Combed Sliver & Comber Noil Waste at different Feed / Nip. Comber Feed/Nip 4.3 4.7 5.2 5.9
Noil% 19.8 19.3 19.5 18.6
Unilap
Total Neps 139 Total Neps Size 648 Fibre Neps 131 Fibre Neps size 632 SCN 8 SCN size 911
Neps Size Distribution Neps Size 450 - 750 um 84.3 Neps Size 751 - 1050 um 12.9 Neps Size above 1051 um 2.7
Length Analysis
Combing behaviors at different parameters 2013
Produced By Mr. Sunil Kumar Sharma, Published in Spinning Textiles Magazine, Vol.7, Issue-5, Sept.-Oct. 2013 Edition. Page 16
UQL(W) 26.00 SFC(W)% 7.7 SFC(n)% 23.05 5%L(n) 37.0
Length Distribution in %
Less than 12.0 mm. 23.1 13.0 to 20.0 mm. 23.2 21.0 to 30.0 mm 33.8 Above 31.0 mm 18.3
Micronaire 3.92 MR 0.89 IFC% 7.2
Comber Sliver
Total Neps 53 58 48 61 Total Neps Size 634 621 605 622 Fibre Neps 51 57 48 60 Fibre Neps size 625 612 604 613 SCN 2 1 0 1 SCN size 926 1029 800 984
Neps Size Distribution Neps Size 450 - 750 um 87.6 90.4 84.9 81.7 Neps Size 751 - 1050 um 10.3 7.4 13.8 14.0 Neps Size above 1051 um 2.0 1.8 1.1 3.6
Length Analysis UQL(W) 31.9 31.7 32.0 31.8 SFC(W)% 5.4 5.8 4.4 6.0 SFC(n)% 14.4 15.3 12.0 16.0 5%L(n) 37.7 37.7 37.4 37.5
Length Distribution in %
Less than 12.0 mm. 14.4 15.3 12.0 15.9 13.0 to 20.0 mm. 30.0 30.2 27.7 29.5 21.0 to 30.0 mm 36.0 35.6 38.9 35.3 Above 31.0 mm 17.1 16.7 19.6 17.2
Micronaire 4.09 4.09 4.06 4.09 MR 0.91 0.91 0.92 0.91 IFC% 5.8 5.8 5.5 6.0
Noil Waste
Total Neps 583 778 662 811 Total Neps Size 675 665 672 669 Fibre Neps 541 736 617 763 Fibre Neps size 647 644 652 645 SCN 41 42 46 48 SCN size 1041 1026 947 1039
Neps Size Distribution Neps Size 450 - 750 um 81.3 82.2 80.8 81.7 Neps Size 751 - 1050 um 13.9 11.4 15.4 14.0 Neps Size above 1051 um 3.8 2.4 3.3 3.6
Length Analysis UQL(W) 15.0 15.2 15.7 15.7
Combing behaviors at different parameters 2013
Produced By Mr. Sunil Kumar Sharma, Published in Spinning Textiles Magazine, Vol.7, Issue-5, Sept.-Oct. 2013 Edition. Page 17
SFC(W)% 60.3 60.0 57.8 57.8 SFC(n)% 80.7 80.8 79.1 79.5 5%L(n) 18.7 18.9 19.6 19.4
Length Distribution in %
Less than 12.0 mm. 80.7 80.9 79.1 79.5 13.0 to 20.0 mm. 15.5 15.0 16.3 16.1 Above 21.0 mm 0.8 4.1 4.6 4.3
Micronaire 3.50 3.48 3.43 3.48 MR 0.66 0.66 0.68 0.66 IFC% 21.7 21.2 19.7 21.0
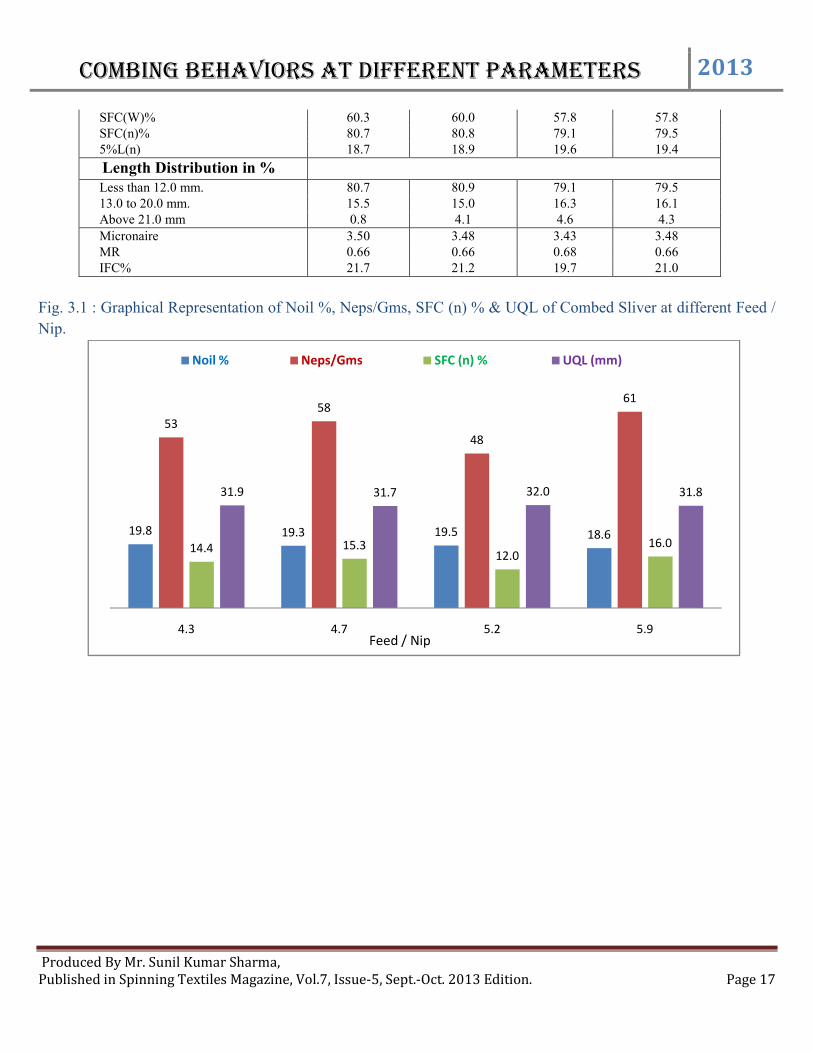
Fig. 3.1 : Graphical Representation of Noil %, Neps/Gms, SFC (n) % & UQL of Combed Sliver at different Feed /
Nip.
19.8 19.3 19.5 18.6
5358
48
61
14.4 15.312.0
16.0
31.9 31.7 32.0 31.8
4.3 4.7 5.2 5.9
Noil % Neps/Gms SFC (n) % UQL (mm)
Feed / Nip
Combing behaviors at different parameters
Produced By Mr. Sunil Kumar Sharma, Published in Spinning Textiles Magazine, Vol.7, Issue
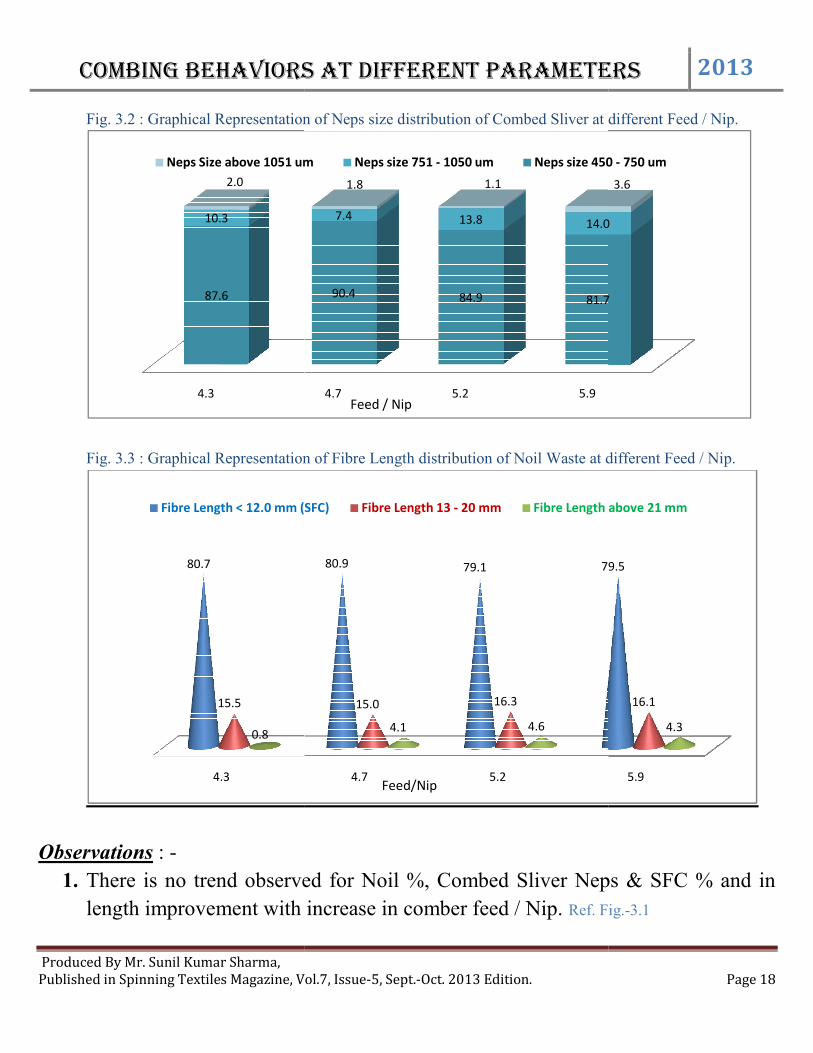
Fig. 3.2 : Graphical Representation of
Fig. 3.3 : Graphical Representation of
Observations : -
1. There is no trend observed for Noil %, Combed Sliver Neps & SFC % and in
length improvement with increase in comber feed / Nip.
4.3
87.6
10.3
2.0
Neps Size above 1051 um
4.3
80.7
15.5
0.8
Fibre Length < 12.0 mm (SFC)
Combing behaviors at different parameters
Vol.7, Issue-5, Sept.-Oct. 2013 Edition.
: Graphical Representation of Neps size distribution of Combed Sliver at different Feed / Nip.
: Graphical Representation of Fibre Length distribution of Noil Waste at different Feed / Nip.
is no trend observed for Noil %, Combed Sliver Neps & SFC % and in
length improvement with increase in comber feed / Nip. Ref. Fig.
4.7 5.2 5.9
90.4 84.9 81.7
7.4 13.8 14.0
1.8 1.1
Neps Size above 1051 um Neps size 751 - 1050 um Neps size 450
Feed / Nip
4.7 5.2
80.9 79.1 79.5
15.0 16.3
4.1 4.6
Fibre Length < 12.0 mm (SFC) Fibre Length 13 - 20 mm Fibre Length above 21 mm
Feed/Nip
Combing behaviors at different parameters 2013
Page 18
of Combed Sliver at different Feed / Nip.
at different Feed / Nip.
is no trend observed for Noil %, Combed Sliver Neps & SFC % and in
Ref. Fig.-3.1
81.7
14.0
3.6
Neps size 450 - 750 um
5.9
79.5
16.1
4.3
Fibre Length above 21 mm
Combing behaviors at different parameters 2013
Produced By Mr. Sunil Kumar Sharma, Published in Spinning Textiles Magazine, Vol.7, Issue-5, Sept.-Oct. 2013 Edition. Page 19
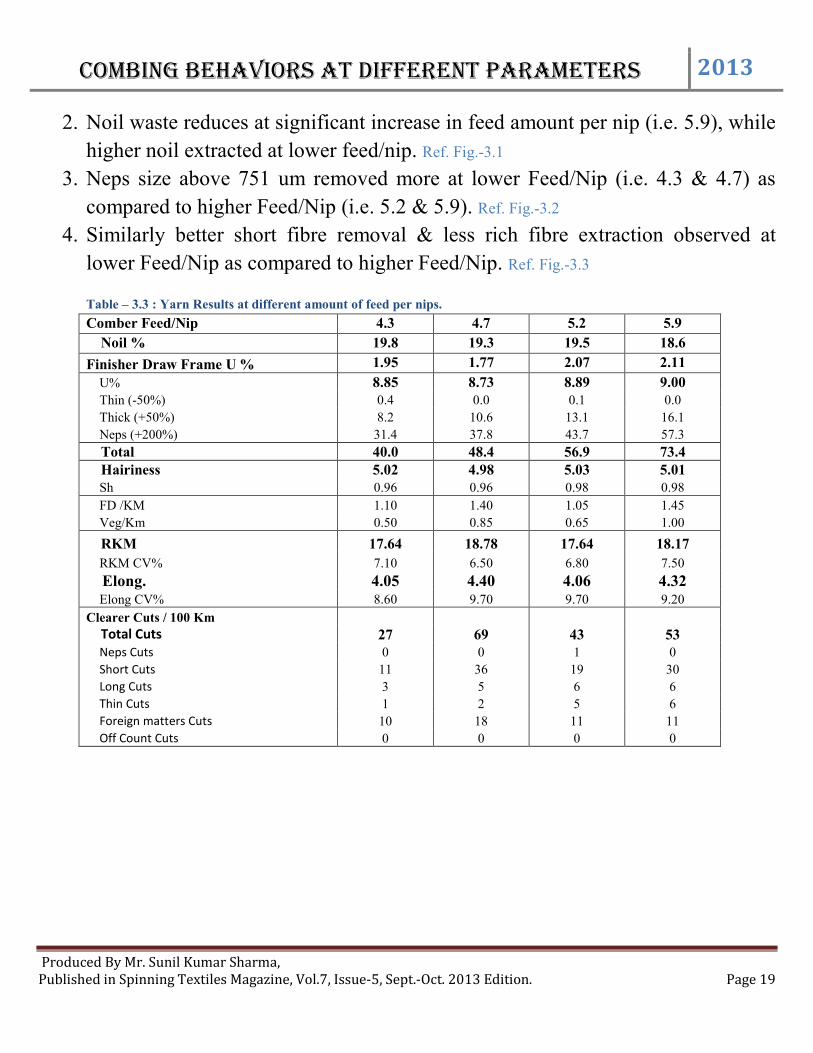
2. Noil waste reduces at significant increase in feed amount per nip (i.e. 5.9), while
higher noil extracted at lower feed/nip. Ref. Fig.-3.1
3. Neps size above 751 um removed more at lower Feed/Nip (i.e. 4.3 & 4.7) as
compared to higher Feed/Nip (i.e. 5.2 & 5.9). Ref. Fig.-3.2
4. Similarly better short fibre removal & less rich fibre extraction observed at
lower Feed/Nip as compared to higher Feed/Nip. Ref. Fig.-3.3
Table – 3.3 : Yarn Results at different amount of feed per nips. Comber Feed/Nip 4.3 4.7 5.2 5.9
Noil % 19.8 19.3 19.5 18.6
Finisher Draw Frame U % 1.95 1.77 2.07 2.11
U% 8.85 8.73 8.89 9.00 Thin (-50%) 0.4 0.0 0.1 0.0
Thick (+50%) 8.2 10.6 13.1 16.1
Neps (+200%) 31.4 37.8 43.7 57.3
Total 40.0 48.4 56.9 73.4 Hairiness 5.02 4.98 5.03 5.01 Sh 0.96 0.96 0.98 0.98
FD /KM 1.10 1.40 1.05 1.45
Veg/Km 0.50 0.85 0.65 1.00
RKM 17.64 18.78 17.64 18.17
RKM CV% 7.10 6.50 6.80 7.50
Elong. 4.05 4.40 4.06 4.32 Elong CV% 8.60 9.70 9.70 9.20
Clearer Cuts / 100 Km
Total Cuts 27 69 43 53 Neps Cuts 0 0 1 0
Short Cuts 11 36 19 30
Long Cuts 3 5 6 6
Thin Cuts 1 2 5 6
Foreign matters Cuts 10 18 11 11
Off Count Cuts 0 0 0 0
Combing behaviors at different parameters
Produced By Mr. Sunil Kumar Sharma, Published in Spinning Textiles Magazine, Vol.7, Issue
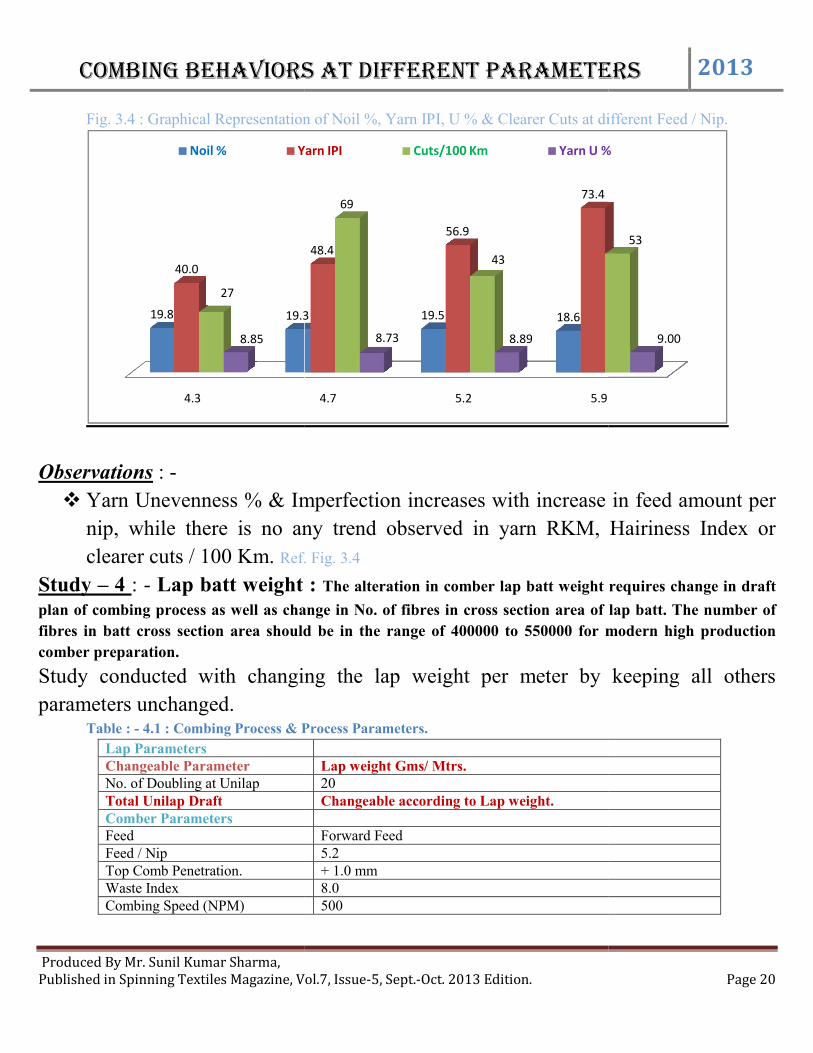
Fig. 3.4 : Graphical Representation of Noil %, Yarn IPI, U % & Clearer Cuts at different Feed / Nip.
Observations : -
Yarn Unevenness % & Imperfection incr
nip, while there is no any
clearer cuts / 100 Km. Ref. Fig. 3.4
Study – 4 : - Lap batt weight plan of combing process as well as change in No. of fibres in cross section area of lap batt.
fibres in batt cross section area should be in the range of 400000 to 550000
comber preparation.
Study conducted with changing the lap weight per meter by keeping all others
parameters unchanged. Table : - 4.1 : Combing Process & Process Parameters.
Lap Parameters Changeable Parameter No. of Doubling at Unilap Total Unilap Draft Comber Parameters Feed Feed / Nip Top Comb Penetration. Waste Index Combing Speed (NPM)
4.3
19.8 19.3
40.0
27
8.85
Noil % Yarn IPI
Combing behaviors at different parameters
Vol.7, Issue-5, Sept.-Oct. 2013 Edition.
.4 : Graphical Representation of Noil %, Yarn IPI, U % & Clearer Cuts at different Feed / Nip.
Yarn Unevenness % & Imperfection increases with increase in
, while there is no any trend observed in yarn RKM, Hairiness Index or
Ref. Fig. 3.4
weight : The alteration in comber lap batt weight require
plan of combing process as well as change in No. of fibres in cross section area of lap batt.
fibres in batt cross section area should be in the range of 400000 to 550000 for modern high production
ed with changing the lap weight per meter by keeping all others
1 : Combing Process & Process Parameters.
Lap weight Gms/ Mtrs. 20 Changeable according to Lap weight. Forward Feed 5.2 + 1.0 mm 8.0 500
4.7 5.2 5.9
19.3 19.5 18.6
48.4
56.9
73.469
43
8.73 8.89
Yarn IPI Cuts/100 Km Yarn U %
Combing behaviors at different parameters 2013
Page 20
.4 : Graphical Representation of Noil %, Yarn IPI, U % & Clearer Cuts at different Feed / Nip.
eases with increase in feed amount per
trend observed in yarn RKM, Hairiness Index or
The alteration in comber lap batt weight requires change in draft
plan of combing process as well as change in No. of fibres in cross section area of lap batt. The number of
for modern high production
ed with changing the lap weight per meter by keeping all others
53
9.00
Yarn U %
Combing behaviors at different parameters 2013
Produced By Mr. Sunil Kumar Sharma, Published in Spinning Textiles Magazine, Vol.7, Issue-5, Sept.-Oct. 2013 Edition. Page 21
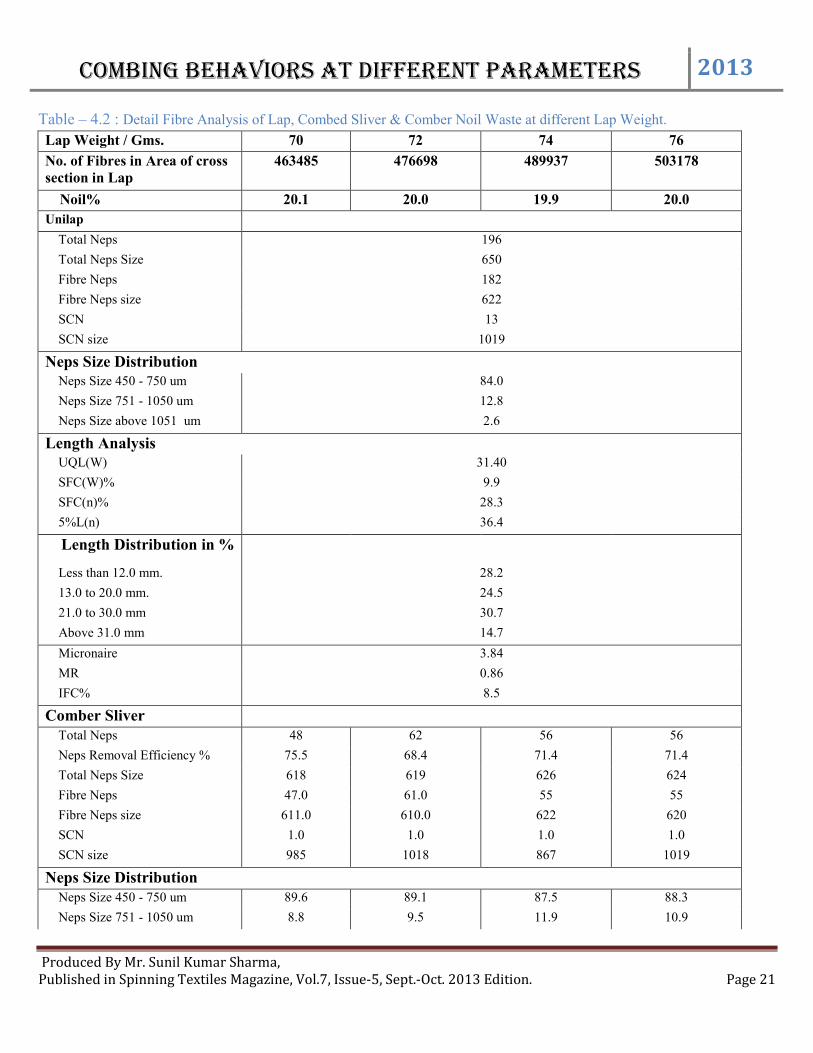
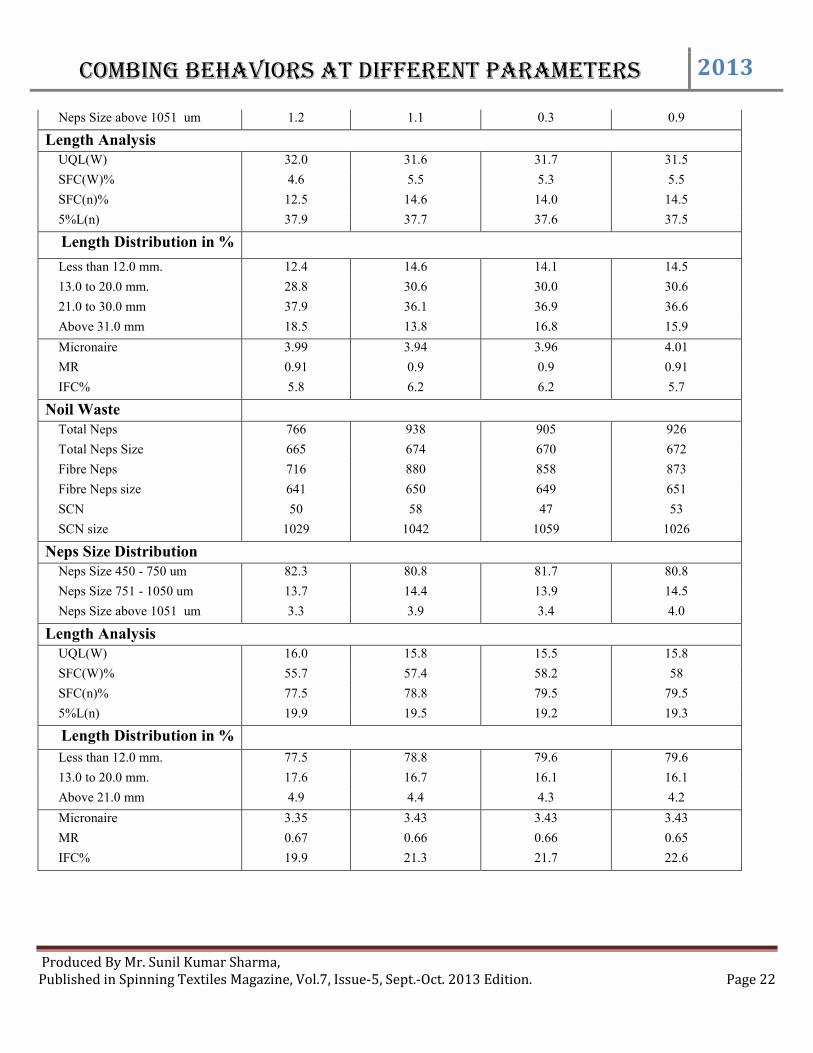
Table – 4.2 : Detail Fibre Analysis of Lap, Combed Sliver & Comber Noil Waste at different Lap Weight.
Lap Weight / Gms. 70 72 74 76
No. of Fibres in Area of cross section in Lap
463485 476698 489937 503178
Noil% 20.1 20.0 19.9 20.0
Unilap
Total Neps 196
Total Neps Size 650
Fibre Neps 182
Fibre Neps size 622
SCN 13
SCN size 1019
Neps Size Distribution Neps Size 450 - 750 um 84.0
Neps Size 751 - 1050 um 12.8
Neps Size above 1051 um 2.6
Length Analysis UQL(W) 31.40
SFC(W)% 9.9
SFC(n)% 28.3
5%L(n) 36.4
Length Distribution in %
Less than 12.0 mm. 28.2
13.0 to 20.0 mm. 24.5
21.0 to 30.0 mm 30.7
Above 31.0 mm 14.7
Micronaire 3.84
MR 0.86
IFC% 8.5
Comber Sliver
Total Neps 48 62 56 56
Neps Removal Efficiency % 75.5 68.4 71.4 71.4
Total Neps Size 618 619 626 624
Fibre Neps 47.0 61.0 55 55
Fibre Neps size 611.0 610.0 622 620
SCN 1.0 1.0 1.0 1.0
SCN size 985 1018 867 1019
Neps Size Distribution Neps Size 450 - 750 um 89.6 89.1 87.5 88.3
Neps Size 751 - 1050 um 8.8 9.5 11.9 10.9
Combing behaviors at different parameters 2013
Produced By Mr. Sunil Kumar Sharma, Published in Spinning Textiles Magazine, Vol.7, Issue-5, Sept.-Oct. 2013 Edition. Page 22
Neps Size above 1051 um 1.2 1.1 0.3 0.9
Length Analysis UQL(W) 32.0 31.6 31.7 31.5
SFC(W)% 4.6 5.5 5.3 5.5
SFC(n)% 12.5 14.6 14.0 14.5
5%L(n) 37.9 37.7 37.6 37.5
Length Distribution in %
Less than 12.0 mm. 12.4 14.6 14.1 14.5
13.0 to 20.0 mm. 28.8 30.6 30.0 30.6
21.0 to 30.0 mm 37.9 36.1 36.9 36.6
Above 31.0 mm 18.5 13.8 16.8 15.9
Micronaire 3.99 3.94 3.96 4.01
MR 0.91 0.9 0.9 0.91
IFC% 5.8 6.2 6.2 5.7
Noil Waste
Total Neps 766 938 905 926
Total Neps Size 665 674 670 672
Fibre Neps 716 880 858 873
Fibre Neps size 641 650 649 651
SCN 50 58 47 53
SCN size 1029 1042 1059 1026
Neps Size Distribution Neps Size 450 - 750 um 82.3 80.8 81.7 80.8
Neps Size 751 - 1050 um 13.7 14.4 13.9 14.5
Neps Size above 1051 um 3.3 3.9 3.4 4.0
Length Analysis UQL(W) 16.0 15.8 15.5 15.8
SFC(W)% 55.7 57.4 58.2 58
SFC(n)% 77.5 78.8 79.5 79.5
5%L(n) 19.9 19.5 19.2 19.3
Length Distribution in %
Less than 12.0 mm. 77.5 78.8 79.6 79.6
13.0 to 20.0 mm. 17.6 16.7 16.1 16.1
Above 21.0 mm 4.9 4.4 4.3 4.2
Micronaire 3.35 3.43 3.43 3.43
MR 0.67 0.66 0.66 0.65
IFC% 19.9 21.3 21.7 22.6
Combing behaviors at different parameters 2013
Produced By Mr. Sunil Kumar Sharma, Published in Spinning Textiles Magazine, Vol.7, Issue-5, Sept.-Oct. 2013 Edition. Page 23
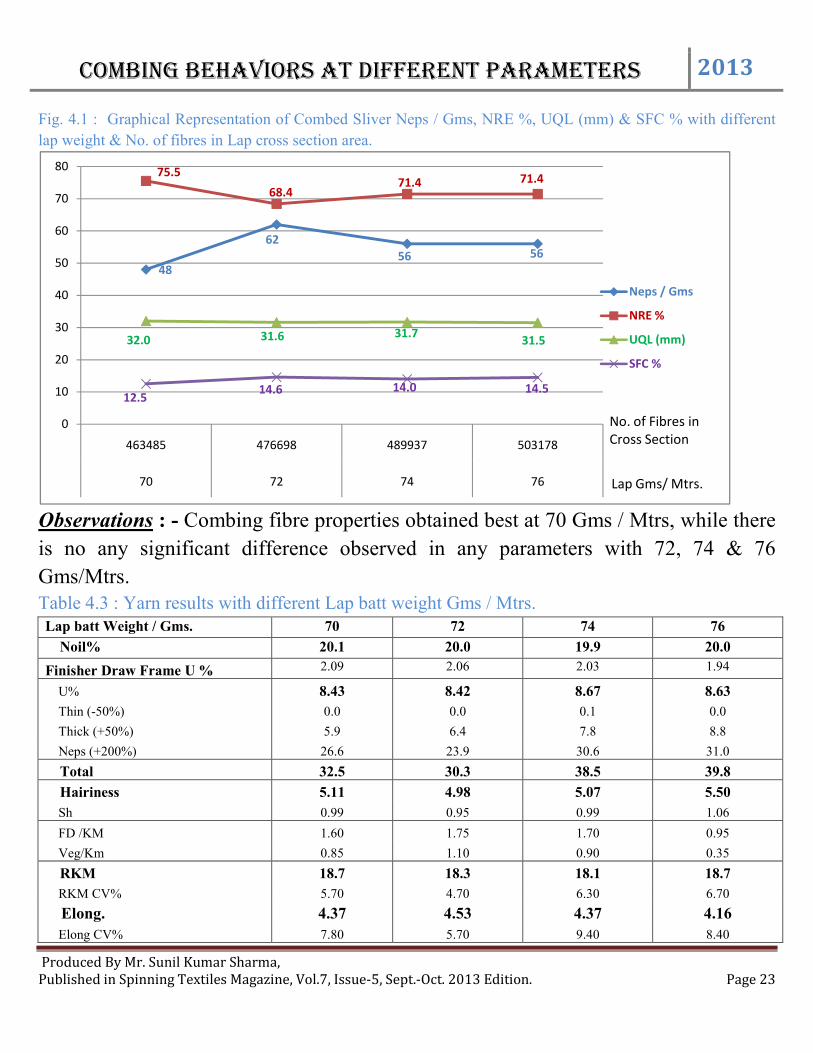
Fig. 4.1 : Graphical Representation of Combed Sliver Neps / Gms, NRE %, UQL (mm) & SFC % with different
lap weight & No. of fibres in Lap cross section area.
Observations : - Combing fibre properties obtained best at 70 Gms / Mtrs, while there
is no any significant difference observed in any parameters with 72, 74 & 76
Gms/Mtrs. Table 4.3 : Yarn results with different Lap batt weight Gms / Mtrs. Lap batt Weight / Gms. 70 72 74 76
Noil% 20.1 20.0 19.9 20.0
Finisher Draw Frame U % 2.09 2.06 2.03 1.94
U% 8.43 8.42 8.67 8.63
Thin (-50%) 0.0 0.0 0.1 0.0
Thick (+50%) 5.9 6.4 7.8 8.8
Neps (+200%) 26.6 23.9 30.6 31.0
Total 32.5 30.3 38.5 39.8
Hairiness 5.11 4.98 5.07 5.50
Sh 0.99 0.95 0.99 1.06
FD /KM 1.60 1.75 1.70 0.95
Veg/Km 0.85 1.10 0.90 0.35
RKM 18.7 18.3 18.1 18.7
RKM CV% 5.70 4.70 6.30 6.70
Elong. 4.37 4.53 4.37 4.16
Elong CV% 7.80 5.70 9.40 8.40
48
62
56 56
75.5
68.471.4 71.4
32.0 31.6 31.731.5
12.514.6 14.0 14.5
0
10
20
30
40
50
60
70
80
463485 476698 489937 503178
70 72 74 76
Neps / Gms
NRE %
UQL (mm)
SFC %
No. of Fibres in Cross Section
Lap Gms/ Mtrs.
Combing behaviors at different parameters 2013
Produced By Mr. Sunil Kumar Sharma, Published in Spinning Textiles Magazine, Vol.7, Issue-5, Sept.-Oct. 2013 Edition. Page 24
Classimat - Cop (/100 KM) Objectionable Faults - Short Class
(A4+B4+B3+C4+C3+C2+D4+D3+D2+D1) 6.0 17.0 22.0 12.0 Long faults - ( E+F+G) 5.0 13.0 12.0 22.0 Long thin faults ( I1+I2) 0.0 0.0 0.0 0.0 Thin faults ( H1+H2) 0.0 0.0 0.0 0.0 Remaining short faults (A3+B2+C1) 14.0 10.0 18.0 8.0 Raw material faults (A1+A2+B1) 72.0 38.0 82.0 57.0
Total faults 97.0 78.0 133.9 99.9
Clearer Cuts/100Km
Total Cuts 68 78 65 56
Neps Cuts 1 0 0 0
Short Cuts 47 41 44 31
Long Cuts 13 16 9 11
Thin Cuts 1 0 3 3
Foreign fibre Cuts 7 10 13 11
Off Count Cuts 0 1 0 1
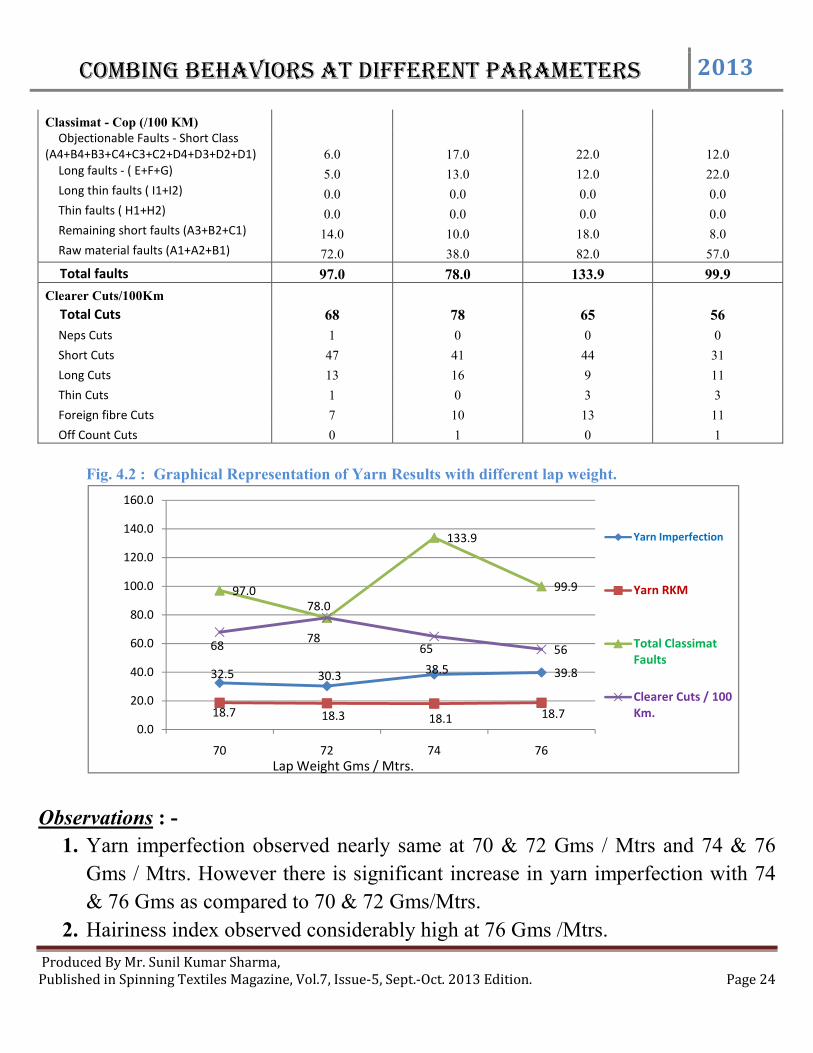
Fig. 4.2 : Graphical Representation of Yarn Results with different lap weight.
Observations : -
1. Yarn imperfection observed nearly same at 70 & 72 Gms / Mtrs and 74 & 76
Gms / Mtrs. However there is significant increase in yarn imperfection with 74
& 76 Gms as compared to 70 & 72 Gms/Mtrs.
2. Hairiness index observed considerably high at 76 Gms /Mtrs.
32.5 30.3 38.5 39.8
18.7 18.3 18.1 18.7
97.078.0
133.9
99.9
6878
65 56
0.0
20.0
40.0
60.0
80.0
100.0
120.0
140.0
160.0
70 72 74 76
Yarn Imperfection
Yarn RKM
Total Classimat Faults
Clearer Cuts / 100 Km.
Lap Weight Gms / Mtrs.
Combing behaviors at different parameters 2013
Produced By Mr. Sunil Kumar Sharma, Published in Spinning Textiles Magazine, Vol.7, Issue-5, Sept.-Oct. 2013 Edition. Page 25
3. There is no any trend observed for Yarn RKM, Classimat faults & clearer cuts
or any other Quality parameters.
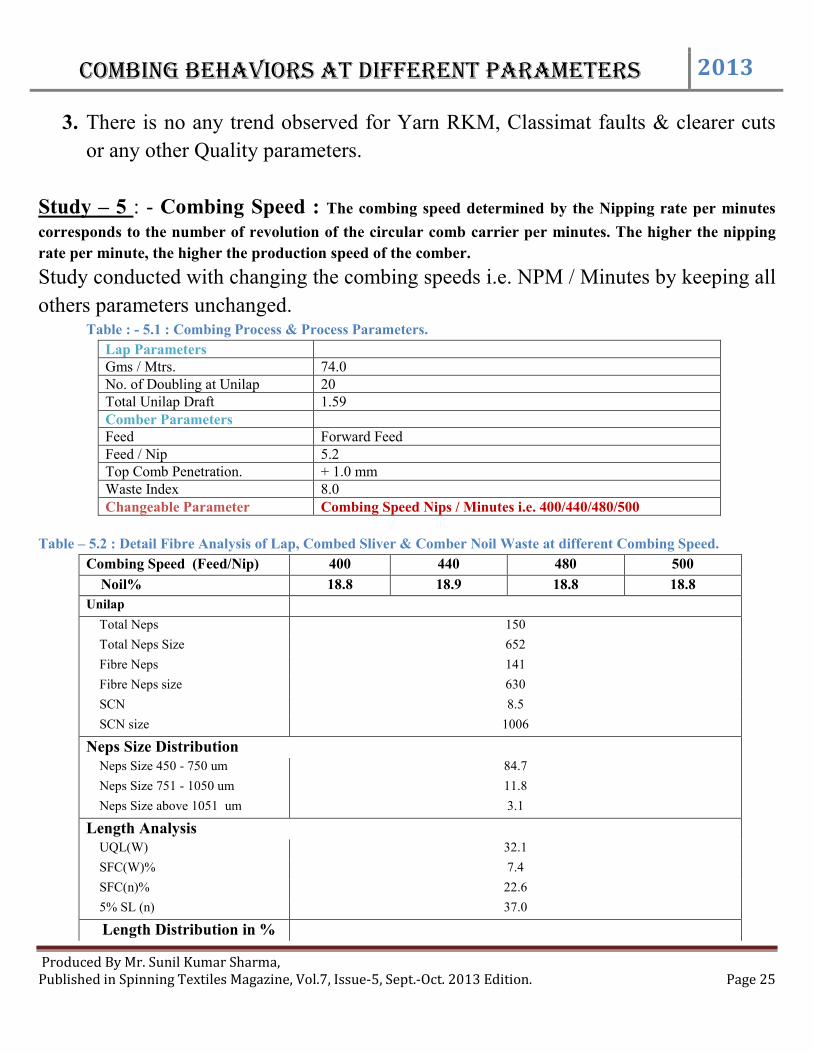
Study – 5 : - Combing Speed : The combing speed determined by the Nipping rate per minutes
corresponds to the number of revolution of the circular comb carrier per minutes. The higher the nipping
rate per minute, the higher the production speed of the comber.
Study conducted with changing the combing speeds i.e. NPM / Minutes by keeping all
others parameters unchanged. Table : - 5.1 : Combing Process & Process Parameters.
Lap Parameters Gms / Mtrs. 74.0 No. of Doubling at Unilap 20 Total Unilap Draft 1.59 Comber Parameters Feed Forward Feed Feed / Nip 5.2 Top Comb Penetration. + 1.0 mm Waste Index 8.0 Changeable Parameter Combing Speed Nips / Minutes i.e. 400/440/480/500
Table – 5.2 : Detail Fibre Analysis of Lap, Combed Sliver & Comber Noil Waste at different Combing Speed.
Combing Speed (Feed/Nip) 400 440 480 500
Noil% 18.8 18.9 18.8 18.8
Unilap
Total Neps 150
Total Neps Size 652
Fibre Neps 141
Fibre Neps size 630
SCN 8.5
SCN size 1006
Neps Size Distribution Neps Size 450 - 750 um 84.7
Neps Size 751 - 1050 um 11.8
Neps Size above 1051 um 3.1
Length Analysis UQL(W) 32.1
SFC(W)% 7.4
SFC(n)% 22.6
5% SL (n) 37.0
Length Distribution in %
Combing behaviors at different parameters 2013
Produced By Mr. Sunil Kumar Sharma, Published in Spinning Textiles Magazine, Vol.7, Issue-5, Sept.-Oct. 2013 Edition. Page 26
Less than 12.0 mm. 22.6
13.0 to 20.0 mm. 22.6
21.0 to 30.0 mm 34.5
Above 31.0 mm 18.8
Micronaire 3.91
MR 0.89
IFC% 7.5
Comber Sliver
Total Neps 46 54 41 53
Total Neps Size 615 628 625 615
Fibre Neps 45 53 40 52
Fibre Neps size 608 623 620 610
SCN 1 1 1 1
SCN size 1033 881 875 883
Neps Size Distribution Neps Size 450 - 750 um 91.1 88.9 87.8 89.2
Neps Size 751 - 1050 um 7.0 10.4 11.7 10.1
Neps Size above 1051 um 1.7 0.8 0.4 0.7
Length Analysis UQL(W) 32.3 32.4 32.3 32.5
SFC(W)% 4.1 4.3 4.4 4.6
SFC(n)% 11.3 11.7 12.3 12.7
5%L(n) 37.9 38.0 37.8 38.1
Length Distribution in %
Less than 12.0 mm. 11.4 11.7 12.3 12.7
13.0 to 20.0 mm. 27.6 27.1 27.2 27.3
21.0 to 30.0 mm 38.6 38.8 38.3 37.9
Above 31.0 mm 19.9 20.3 20.1 19.8
Micronaire 4.11 4.09 4.09 4.00
MR 0.93 0.92 0.93 0.92
IFC% 5.4 5.4 5.3 5.7
Noil Waste
Total Neps 640 626 586 594
Total Neps Size 672 672 674 674
Fibre Neps 602 589 544 556
Fibre Neps size 650 648 648 652
SCN 38 37 42 39
SCN size 1025 1067 1000 995
Neps Size Distribution Neps Size 450 - 750 um 81.1 81.4 80.2 80.4
Neps Size 751 - 1050 um 14.1 14.1 15.7 15.6
Combing behaviors at different parameters 2013
Produced By Mr. Sunil Kumar Sharma, Published in Spinning Textiles Magazine, Vol.7, Issue-5, Sept.-Oct. 2013 Edition. Page 27
Neps Size above 1051 um 4.2 3.5 3.8 3.4
Length Analysis UQL(W) 16.2 15.7 16.0 16.3
SFC(W)% 55.6 57.2 56.7 55.1
SFC(n)% 77.6 78.8 78.3 77.3
5%L(n) 20.2 19.7 20.0 20.3
Length Distribution in %
Less than 12.0 mm. 77.6 78.8 78.2 77.2
13.0 to 20.0 mm. 17.3 16.6 16.6 17.4
Above 21.0 mm 5.0 4.5 5.1 5.3
Micronaire 3.45 3.45 3.45 3.48
MR 0.68 0.68 0.69 0.68
IFC% 19.6 20.0 19.3 19.8
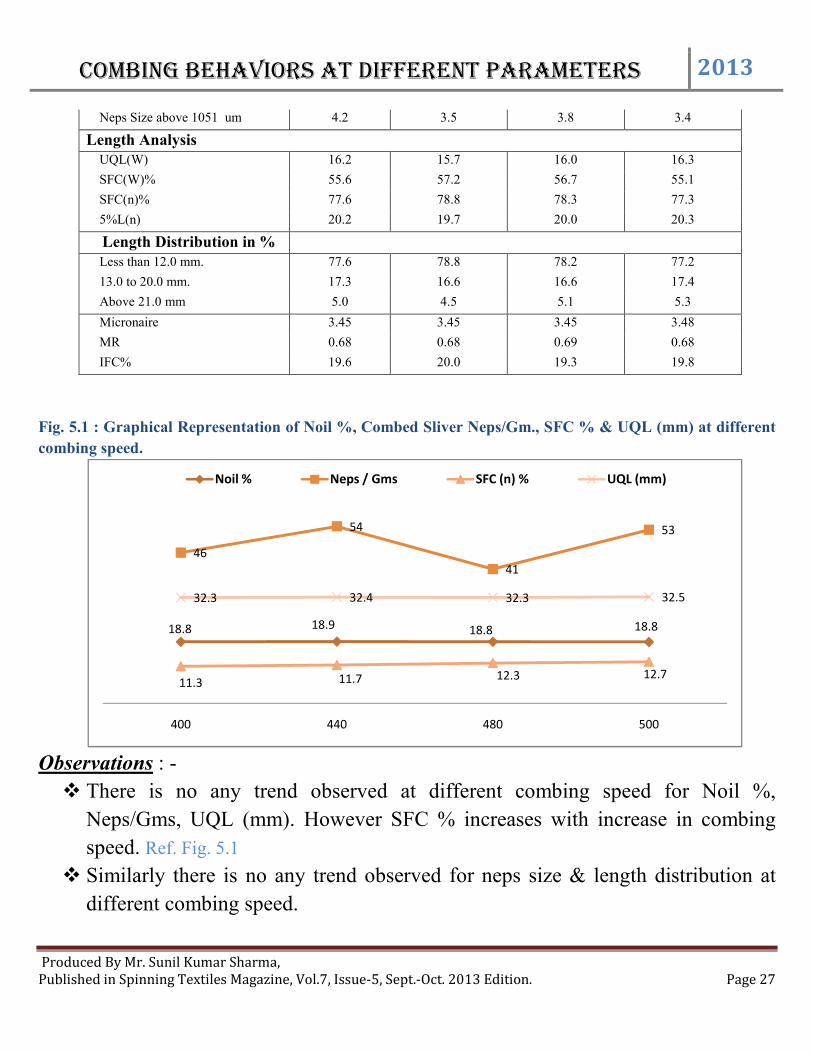
Fig. 5.1 : Graphical Representation of Noil %, Combed Sliver Neps/Gm., SFC % & UQL (mm) at different
combing speed.
Observations : -
There is no any trend observed at different combing speed for Noil %,
Neps/Gms, UQL (mm). However SFC % increases with increase in combing
speed. Ref. Fig. 5.1
Similarly there is no any trend observed for neps size & length distribution at
different combing speed.
18.8 18.9 18.8 18.8
46
54
41
53
11.3 11.7 12.3 12.7
32.3 32.4 32.3 32.5
400 440 480 500
Noil % Neps / Gms SFC (n) % UQL (mm)
Combing behaviors at different parameters 2013
Produced By Mr. Sunil Kumar Sharma, Published in Spinning Textiles Magazine, Vol.7, Issue-5, Sept.-Oct. 2013 Edition. Page 28
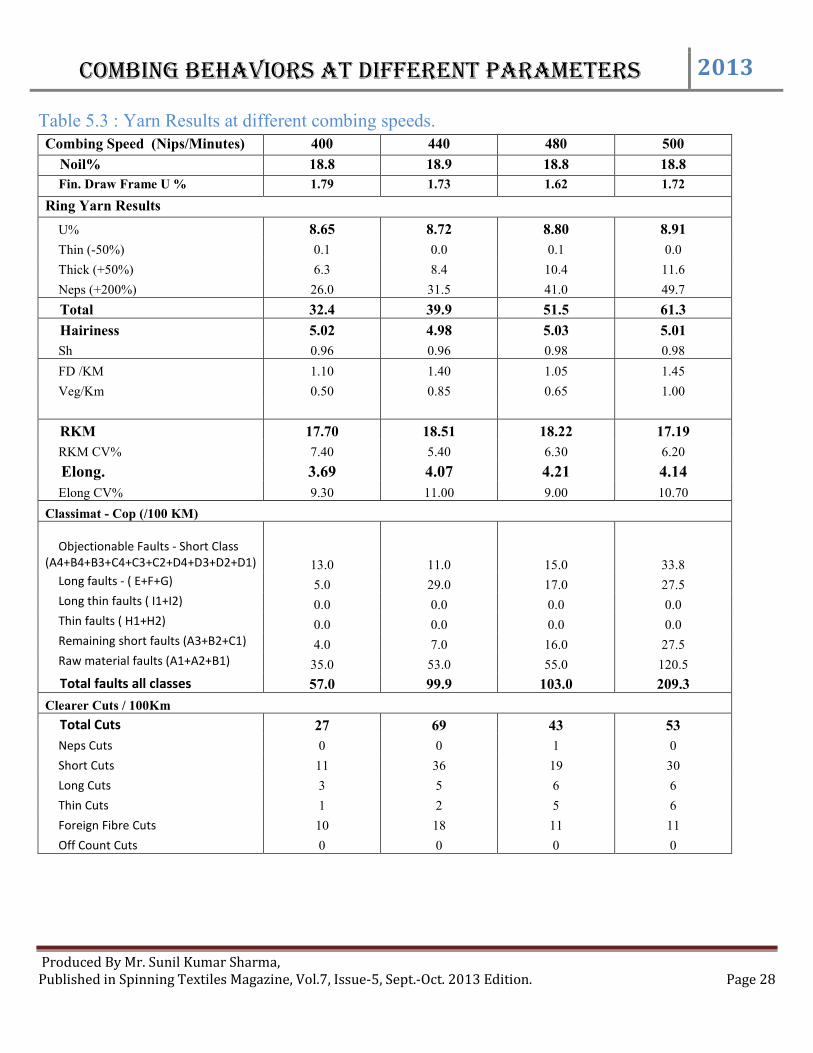
Table 5.3 : Yarn Results at different combing speeds. Combing Speed (Nips/Minutes) 400 440 480 500
Noil% 18.8 18.9 18.8 18.8
Fin. Draw Frame U % 1.79 1.73 1.62 1.72
Ring Yarn Results
U% 8.65 8.72 8.80 8.91
Thin (-50%) 0.1 0.0 0.1 0.0
Thick (+50%) 6.3 8.4 10.4 11.6
Neps (+200%) 26.0 31.5 41.0 49.7
Total 32.4 39.9 51.5 61.3
Hairiness 5.02 4.98 5.03 5.01
Sh 0.96 0.96 0.98 0.98
FD /KM 1.10 1.40 1.05 1.45
Veg/Km 0.50 0.85 0.65 1.00
RKM 17.70 18.51 18.22 17.19
RKM CV% 7.40 5.40 6.30 6.20
Elong. 3.69 4.07 4.21 4.14
Elong CV% 9.30 11.00 9.00 10.70
Classimat - Cop (/100 KM)
Objectionable Faults - Short Class (A4+B4+B3+C4+C3+C2+D4+D3+D2+D1) 13.0 11.0 15.0 33.8
Long faults - ( E+F+G) 5.0 29.0 17.0 27.5 Long thin faults ( I1+I2) 0.0 0.0 0.0 0.0 Thin faults ( H1+H2) 0.0 0.0 0.0 0.0 Remaining short faults (A3+B2+C1) 4.0 7.0 16.0 27.5 Raw material faults (A1+A2+B1) 35.0 53.0 55.0 120.5
Total faults all classes 57.0 99.9 103.0 209.3
Clearer Cuts / 100Km
Total Cuts 27 69 43 53
Neps Cuts 0 0 1 0
Short Cuts 11 36 19 30
Long Cuts 3 5 6 6
Thin Cuts 1 2 5 6
Foreign Fibre Cuts 10 18 11 11
Off Count Cuts 0 0 0 0
Combing behaviors at different parameters 2013
Produced By Mr. Sunil Kumar Sharma, Published in Spinning Textiles Magazine, Vol.7, Issue-5, Sept.-Oct. 2013 Edition. Page 29
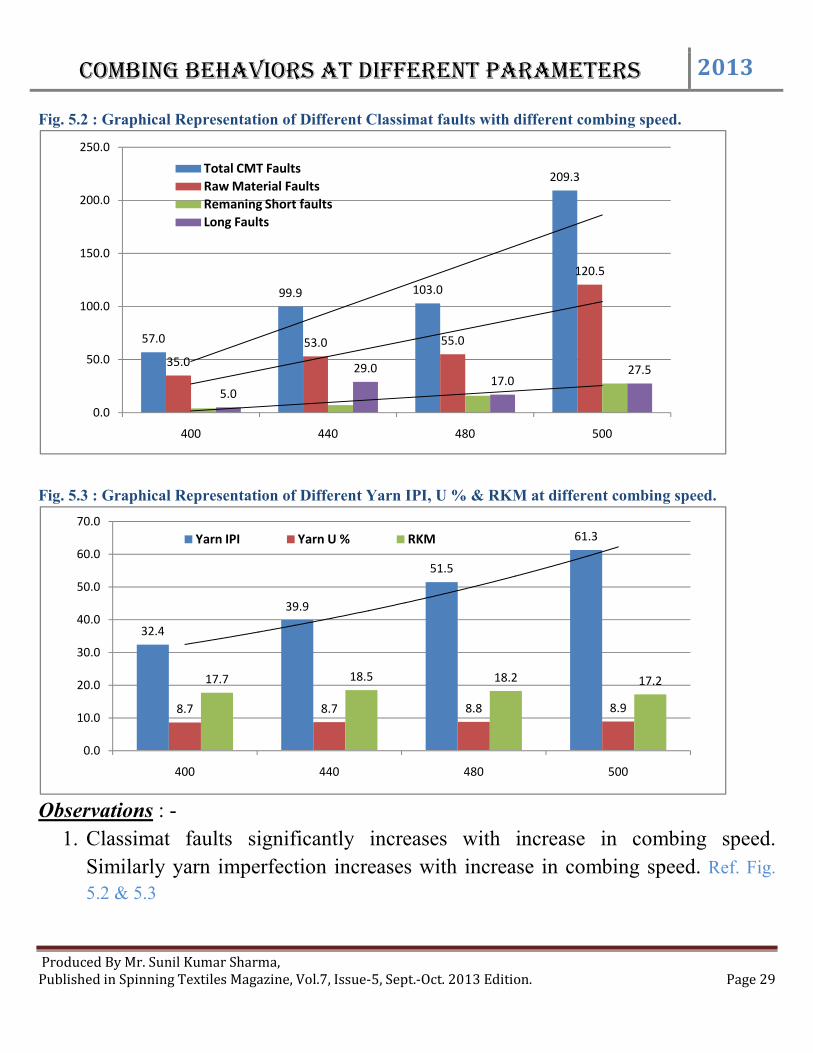
Fig. 5.2 : Graphical Representation of Different Classimat faults with different combing speed.
Fig. 5.3 : Graphical Representation of Different Yarn IPI, U % & RKM at different combing speed.
Observations : -
1. Classimat faults significantly increases with increase in combing speed.
Similarly yarn imperfection increases with increase in combing speed. Ref. Fig.
5.2 & 5.3
57.0
99.9 103.0
209.3
35.0
53.0 55.0
120.5
5.0
29.017.0
27.5
0.0
50.0
100.0
150.0
200.0
250.0
400 440 480 500
Total CMT Faults
Raw Material Faults
Remaning Short faults
Long Faults
32.4
39.9
51.5
61.3
8.7 8.7 8.8 8.9
17.7 18.5 18.2 17.2
0.0
10.0
20.0
30.0
40.0
50.0
60.0
70.0
400 440 480 500
Yarn IPI Yarn U % RKM
Combing behaviors at different parameters 2013
Produced By Mr. Sunil Kumar Sharma, Published in Spinning Textiles Magazine, Vol.7, Issue-5, Sept.-Oct. 2013 Edition. Page 30
2. There is no significant difference or any trend observed for any others quality
parameters by changing the combing speed.
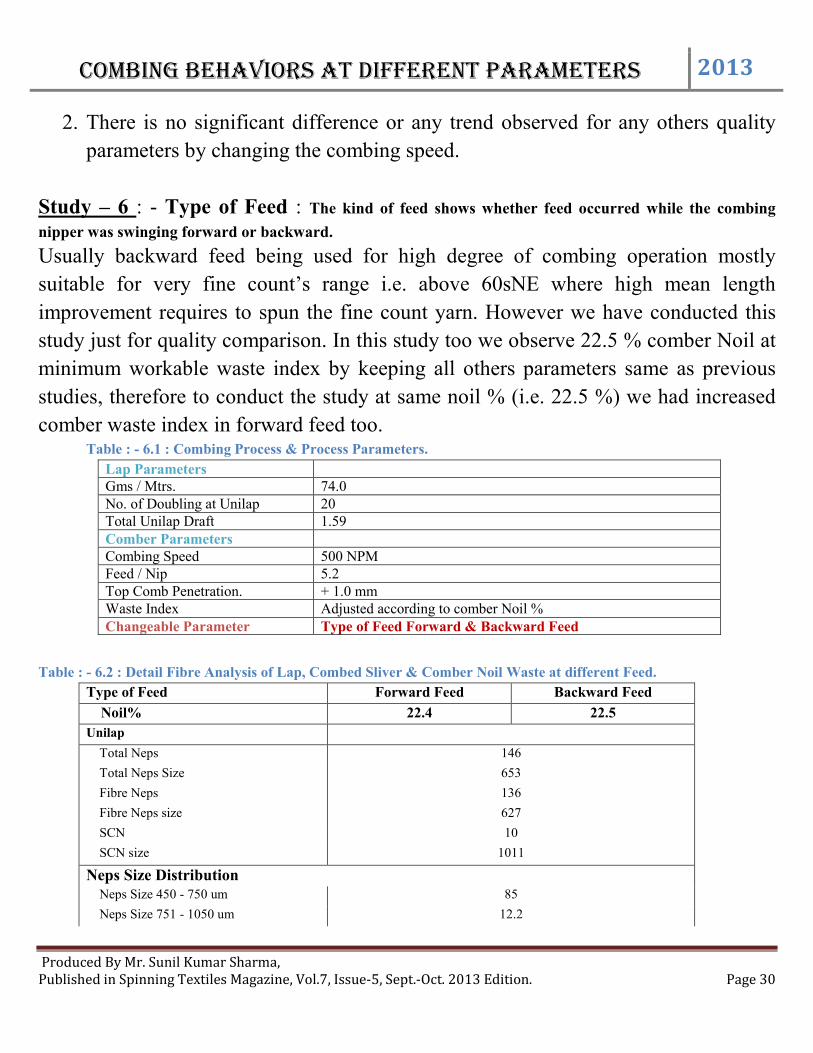
Study – 6 : - Type of Feed : The kind of feed shows whether feed occurred while the combing
nipper was swinging forward or backward.
Usually backward feed being used for high degree of combing operation mostly
suitable for very fine count’s range i.e. above 60sNE where high mean length
improvement requires to spun the fine count yarn. However we have conducted this
study just for quality comparison. In this study too we observe 22.5 % comber Noil at
minimum workable waste index by keeping all others parameters same as previous
studies, therefore to conduct the study at same noil % (i.e. 22.5 %) we had increased
comber waste index in forward feed too. Table : - 6.1 : Combing Process & Process Parameters.
Lap Parameters Gms / Mtrs. 74.0 No. of Doubling at Unilap 20 Total Unilap Draft 1.59 Comber Parameters Combing Speed 500 NPM Feed / Nip 5.2 Top Comb Penetration. + 1.0 mm Waste Index Adjusted according to comber Noil % Changeable Parameter Type of Feed Forward & Backward Feed
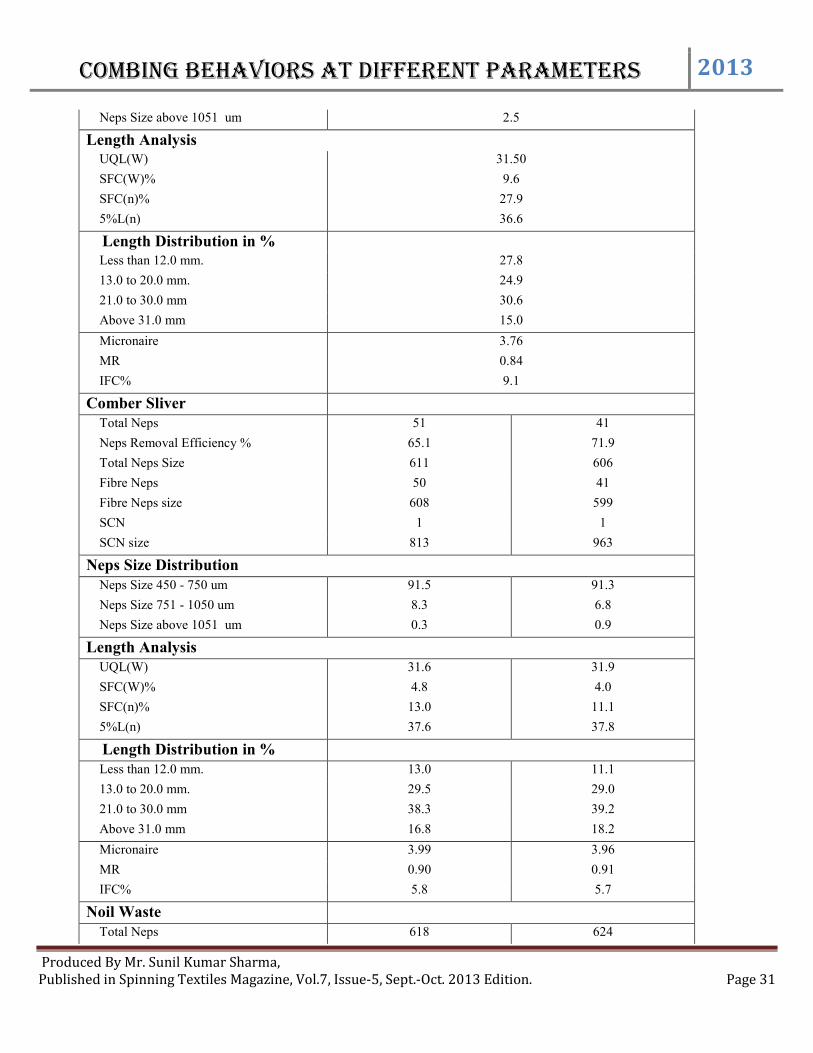
Table : - 6.2 : Detail Fibre Analysis of Lap, Combed Sliver & Comber Noil Waste at different Feed.
Type of Feed Forward Feed Backward Feed
Noil% 22.4 22.5
Unilap
Total Neps 146
Total Neps Size 653
Fibre Neps 136
Fibre Neps size 627
SCN 10
SCN size 1011
Neps Size Distribution Neps Size 450 - 750 um 85
Neps Size 751 - 1050 um 12.2
Combing behaviors at different parameters 2013
Produced By Mr. Sunil Kumar Sharma, Published in Spinning Textiles Magazine, Vol.7, Issue-5, Sept.-Oct. 2013 Edition. Page 31
Neps Size above 1051 um 2.5
Length Analysis UQL(W) 31.50
SFC(W)% 9.6
SFC(n)% 27.9
5%L(n) 36.6
Length Distribution in %
Less than 12.0 mm. 27.8
13.0 to 20.0 mm. 24.9
21.0 to 30.0 mm 30.6
Above 31.0 mm 15.0
Micronaire 3.76
MR 0.84
IFC% 9.1
Comber Sliver
Total Neps 51 41
Neps Removal Efficiency % 65.1 71.9
Total Neps Size 611 606
Fibre Neps 50 41
Fibre Neps size 608 599
SCN 1 1
SCN size 813 963
Neps Size Distribution Neps Size 450 - 750 um 91.5 91.3
Neps Size 751 - 1050 um 8.3 6.8
Neps Size above 1051 um 0.3 0.9
Length Analysis UQL(W) 31.6 31.9
SFC(W)% 4.8 4.0
SFC(n)% 13.0 11.1
5%L(n) 37.6 37.8
Length Distribution in %
Less than 12.0 mm. 13.0 11.1
13.0 to 20.0 mm. 29.5 29.0
21.0 to 30.0 mm 38.3 39.2
Above 31.0 mm 16.8 18.2
Micronaire 3.99 3.96
MR 0.90 0.91
IFC% 5.8 5.7
Noil Waste
Total Neps 618 624
Combing behaviors at different parameters 2013
Produced By Mr. Sunil Kumar Sharma, Published in Spinning Textiles Magazine, Vol.7, Issue-5, Sept.-Oct. 2013 Edition. Page 32
Total Neps Size 665 673
Fibre Neps 578 574
Fibre Neps size 639 644
SCN 40 50
SCN size 1031 994
Neps Size Distribution Neps Size 450 - 750 um 82.8 81.8
Neps Size 751 - 1050 um 12.9 13.5
Neps Size above 1051 um 3.6 4.2
Length Analysis UQL(W) 16.2 16.0
SFC(W)% 54.6 55
SFC(n)% 76.7 76.9
5%L(n) 19.9 19.9
Length Distribution in %
Less than 12.0 mm. 76.8 76.8
13.0 to 20.0 mm. 18.3 18.2
Above 21.0 mm 0.8 0.9
Micronaire 136 132
MR 0.67 0.67
IFC% 20.9 20.5
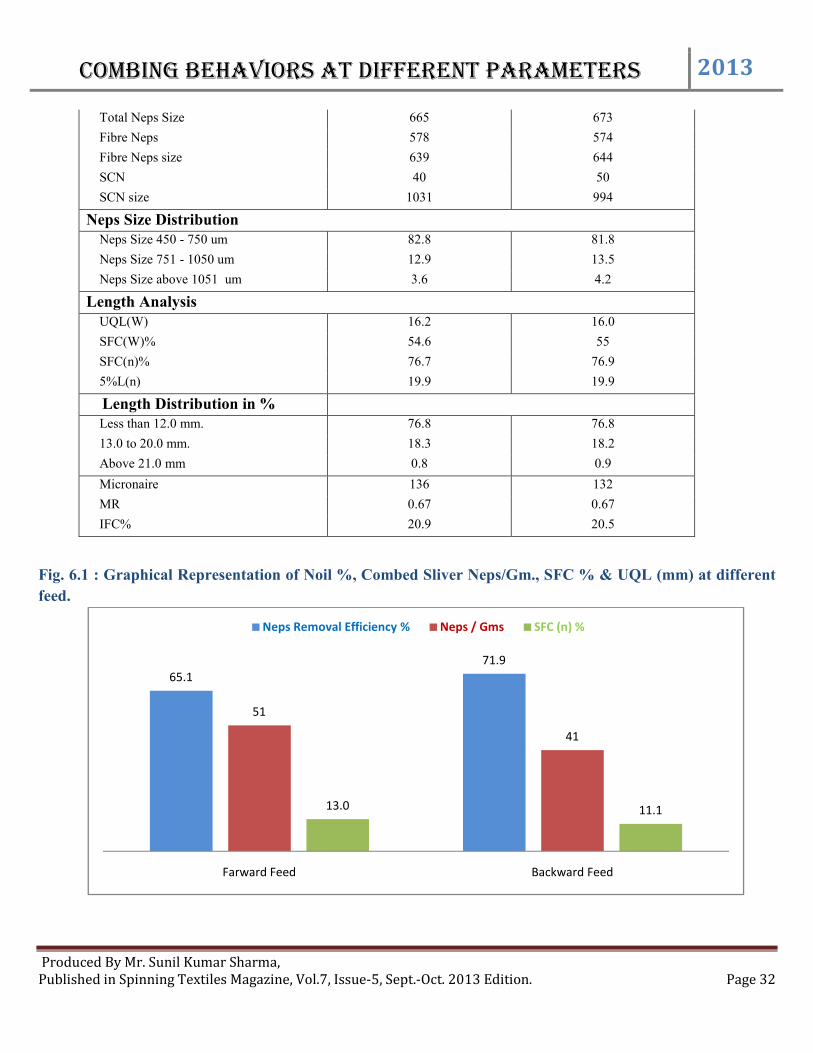
Fig. 6.1 : Graphical Representation of Noil %, Combed Sliver Neps/Gm., SFC % & UQL (mm) at different
feed.
65.1
71.9
51
41
13.0 11.1
Farward Feed Backward Feed
Neps Removal Efficiency % Neps / Gms SFC (n) %
Combing behaviors at different parameters
Produced By Mr. Sunil Kumar Sharma, Published in Spinning Textiles Magazine, Vol.7, Issue
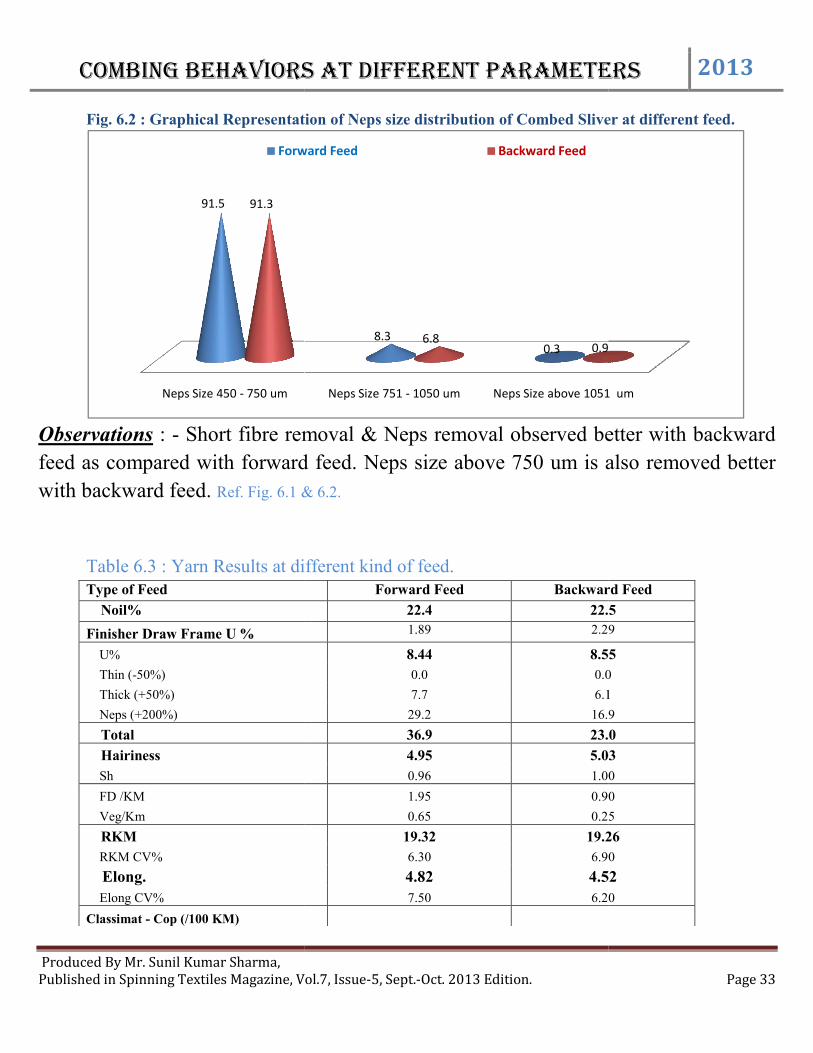
Fig. 6.2 : Graphical Representation of
Observations : - Short fibre removal & Neps removal observed better with backward
feed as compared with forward feed.
with backward feed. Ref. Fig. 6.1 & 6.2.
Table 6.3 : Yarn Results at different Type of Feed
Noil%
Finisher Draw Frame U %
U%
Thin (-50%)
Thick (+50%)
Neps (+200%)
Total
Hairiness
Sh
FD /KM
Veg/Km
RKM
RKM CV%
Elong.
Elong CV%
Classimat - Cop (/100 KM)
Neps Size 450 - 750 um
91.5 91.3
Forward Feed
Combing behaviors at different parameters
Vol.7, Issue-5, Sept.-Oct. 2013 Edition.
: Graphical Representation of Neps size distribution of Combed Sliver at different feed.
Short fibre removal & Neps removal observed better with backward
feed as compared with forward feed. Neps size above 750 um is also
Ref. Fig. 6.1 & 6.2.
Table 6.3 : Yarn Results at different kind of feed. Forward Feed Backward Feed
22.4 22.5
1.89 2.29
8.44 8.55
0.0 0.0
7.7 6.1
29.2 16.9
36.9 23.0
4.95 5.03
0.96 1.00
1.95 0.90
0.65 0.25
19.32 19.26
6.30 6.90
4.82 4.52
7.50 6.20
Neps Size 751 - 1050 um Neps Size above 1051 um
8.30.3
6.80.9
Forward Feed Backward Feed
Combing behaviors at different parameters 2013
Page 33
Combed Sliver at different feed.
Short fibre removal & Neps removal observed better with backward
above 750 um is also removed better
Backward Feed
22.5
2.29
8.55
0.0
6.1
16.9
23.0
5.03
1.00
0.90
0.25
19.26
6.90
4.52
6.20
Neps Size above 1051 um
0.9
Combing behaviors at different parameters 2013
Produced By Mr. Sunil Kumar Sharma, Published in Spinning Textiles Magazine, Vol.7, Issue-5, Sept.-Oct. 2013 Edition. Page 34
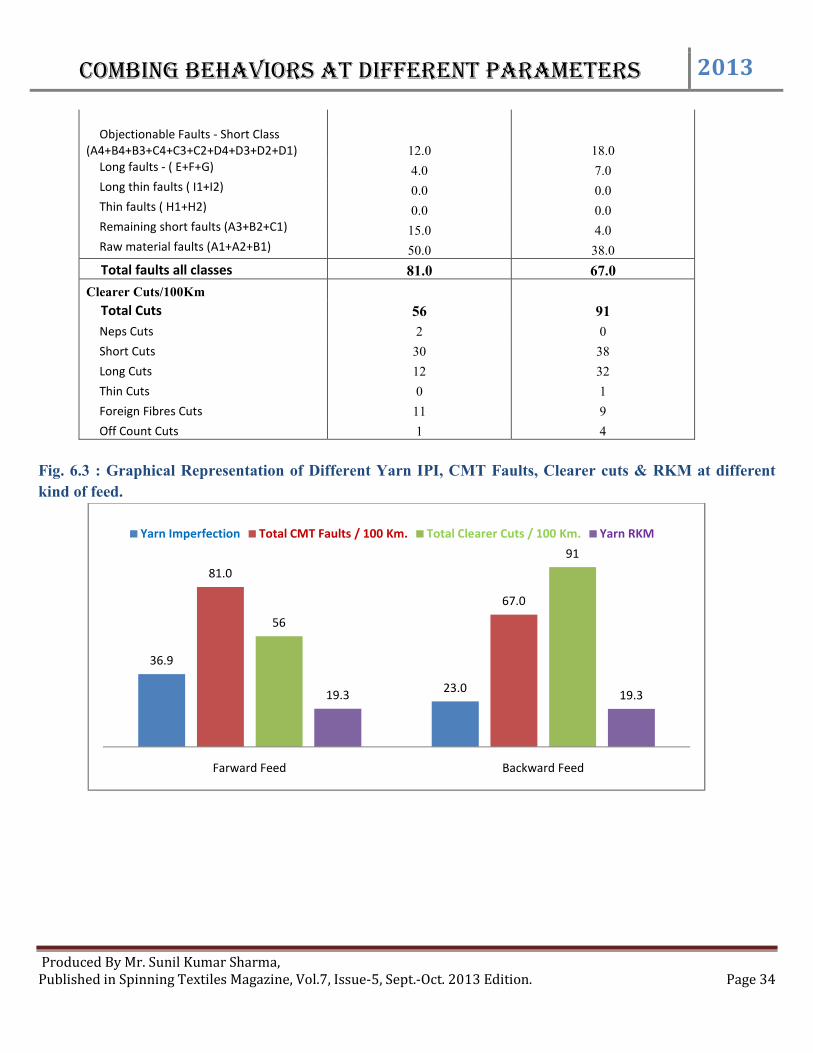
Objectionable Faults - Short Class
(A4+B4+B3+C4+C3+C2+D4+D3+D2+D1) 12.0 18.0 Long faults - ( E+F+G) 4.0 7.0 Long thin faults ( I1+I2) 0.0 0.0 Thin faults ( H1+H2) 0.0 0.0 Remaining short faults (A3+B2+C1) 15.0 4.0 Raw material faults (A1+A2+B1) 50.0 38.0
Total faults all classes 81.0 67.0
Clearer Cuts/100Km
Total Cuts 56 91
Neps Cuts 2 0
Short Cuts 30 38
Long Cuts 12 32
Thin Cuts 0 1
Foreign Fibres Cuts 11 9
Off Count Cuts 1 4
Fig. 6.3 : Graphical Representation of Different Yarn IPI, CMT Faults, Clearer cuts & RKM at different
kind of feed.
36.9
23.0
81.0
67.0
56
91
19.3 19.3
Farward Feed Backward Feed
Yarn Imperfection Total CMT Faults / 100 Km. Total Clearer Cuts / 100 Km. Yarn RKM
Combing behaviors at different parameters 2013
Produced By Mr. Sunil Kumar Sharma, Published in Spinning Textiles Magazine, Vol.7, Issue-5, Sept.-Oct. 2013 Edition. Page 35
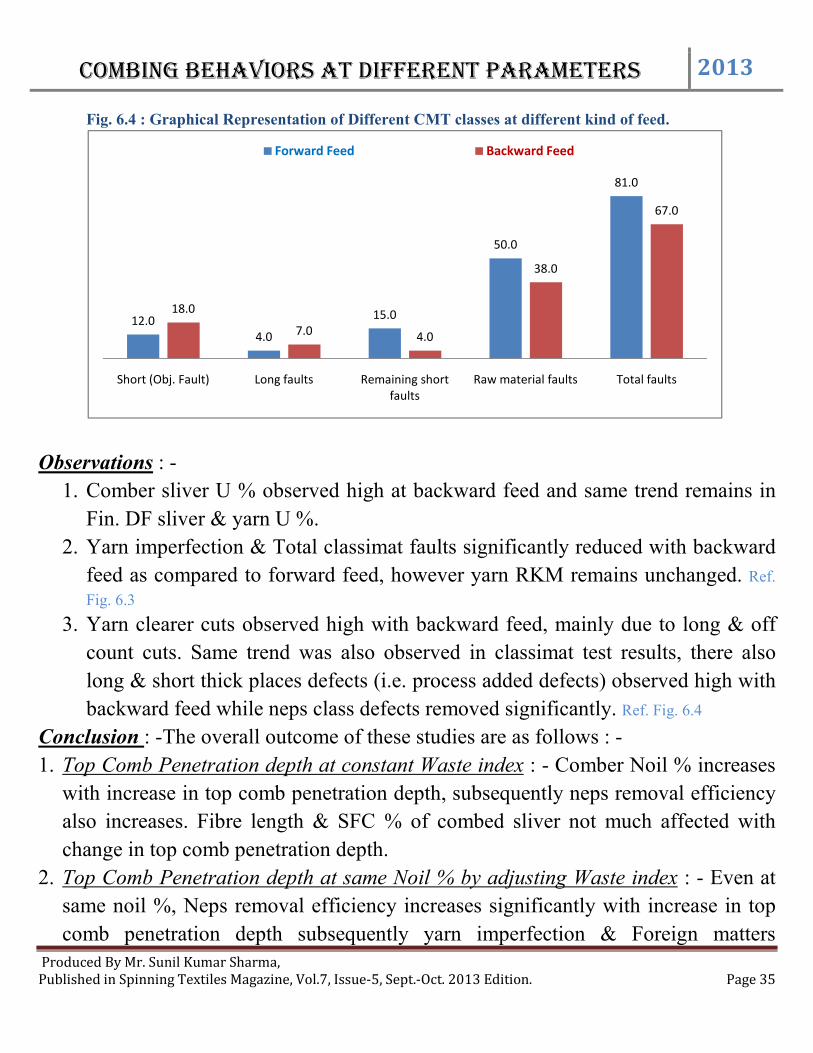
Fig. 6.4 : Graphical Representation of Different CMT classes at different kind of feed.
Observations : -
1. Comber sliver U % observed high at backward feed and same trend remains in
Fin. DF sliver & yarn U %.
2. Yarn imperfection & Total classimat faults significantly reduced with backward
feed as compared to forward feed, however yarn RKM remains unchanged. Ref.
Fig. 6.3 3. Yarn clearer cuts observed high with backward feed, mainly due to long & off
count cuts. Same trend was also observed in classimat test results, there also
long & short thick places defects (i.e. process added defects) observed high with
backward feed while neps class defects removed significantly. Ref. Fig. 6.4
Conclusion : -The overall outcome of these studies are as follows : -
1. Top Comb Penetration depth at constant Waste index : - Comber Noil % increases
with increase in top comb penetration depth, subsequently neps removal efficiency
also increases. Fibre length & SFC % of combed sliver not much affected with
change in top comb penetration depth.
2. Top Comb Penetration depth at same Noil % by adjusting Waste index : - Even at
same noil %, Neps removal efficiency increases significantly with increase in top
comb penetration depth subsequently yarn imperfection & Foreign matters
12.04.0
15.0
50.0
81.0
18.0
7.0 4.0
38.0
67.0
Short (Obj. Fault) Long faults Remaining short faults
Raw material faults Total faults
Forward Feed Backward Feed
Combing behaviors at different parameters 2013
Produced By Mr. Sunil Kumar Sharma, Published in Spinning Textiles Magazine, Vol.7, Issue-5, Sept.-Oct. 2013 Edition. Page 36
significantly reduced, however fibre length, SFC % & other fibre properties are not
much affected. Classimat faults & clearer cuts doesn’t show any relation with TC
penetration, however yarn hairiness increases with increase in TC penetration
depth.
3. Feed amount per cycle : - Fibre characteristics, Neps removal efficiency etc. & noil
extraction % is not much affected with small change in feed per cycle. It has been
observed that better combing took place at lower feed amount (i.e. 4.3 & 4.7) as
compared to higher feed amount (i.e. 5.2 & 5.9). Yarn imperfections having
increasing trend with increase in feed amount while others quality parameter
doesn’t show any trend.
4. Lap batt weight : - Fibre characteristics doesn’t much affected with change in lap
batt weight, however better combing operation took place at lower batt weight.
Yarn quality not much affected with minor change in lap batt weight. Yarn
imperfection & Hairiness Index increased with higher lap batt weight. While others
quality parameters not much affected.
5. Combing Speed : - Again fibre characteristics & comber noil % not much affected
by change in combing speed, however yarn imperfection and classimat faults
increases with increase in combing speed, means uniform combing perform at
lower rate of combing speed.
6. Kind of Feed : - Higher noil extracted at backward feed with superb combing
performance compare to forward feed. Yarn Quality improves significantly with
backward feed combing.
In totality it can be concluded that yarn imperfection reduced when we reduce comber
production with respect to lap batt weight, feed amount per cycle and by combing
speed. Higher top comb penetration depth by maintaining same noil % produces the
better quality without affecting production rate. Backward feed also provide better
yarn quality without affecting production rate but high amount of noil extracted at this
kind of feed, hence this can be only utilized for fine count qualities. For better
Combing behaviors at different parameters 2013
Produced By Mr. Sunil Kumar Sharma, Published in Spinning Textiles Magazine, Vol.7, Issue-5, Sept.-Oct. 2013 Edition. Page 37
classimat results along with lower yarn imperfection lower combing speed &
backward feed may be tried.
Recommendation : It is very clear from above studies that according to yarn count
pattern following combination may apply for best results : -
For Coarse Count Range : - Forward feed, high amount of feed with optimum
lap batt weight and with require combing speed & Noil % as per Quality &
Productivity requirement.
For Medium Count Range : - Forward feed, medium amount of feed with
optimum lap batt weight, medium combing speed & with adequate Noil % set
with maximum top comb penetration depths require as per Quality &
Productivity requirement.
For Fine Count Range : - Backward feed, low amount of feed with lower batt
weight & lower combing speed, maximum top comb penetration depth with
adequate Noil % require as per Quality requirement.
Disclaimer : - These studies conducted at state of art modern high speed spinning plant by utilizing maximum
production capacity with medium long staple cotton fibres. Different results may obtain with different spinning set
up, production rate and much depends upon cotton fibres quality. Hence users are advised to refer these studies as
a guideline and should reconfirm with their own process set up’s.
Produced By : -
Mr. Sunil Kumar Sharma – Dy. General Manager
&
Mr. Mahesh Upadhyay – Dy. Manager QAD,
Loknayak Jayprakash Narayan Shetkari Sahakari Soot Girni Ltd.
Shahada, Dist. : - Nandurbar (MS)
: Mr. Sunil Kumar Sharma, Manager – QAD,
Mobile No. : – 09552596742, 09921417107
E_mail : - [email protected]