Embed Size (px)
Citation preview

Effectively Monitoring Client-Side Performance
MobileTea, Rome | @AndrewRota

1. Client-Side Performance 2. Collect + Monitor 3. Effectively

Andrew RotaSoftware Engineer, .
@AndrewRota .
Boston, MA

Web Performance

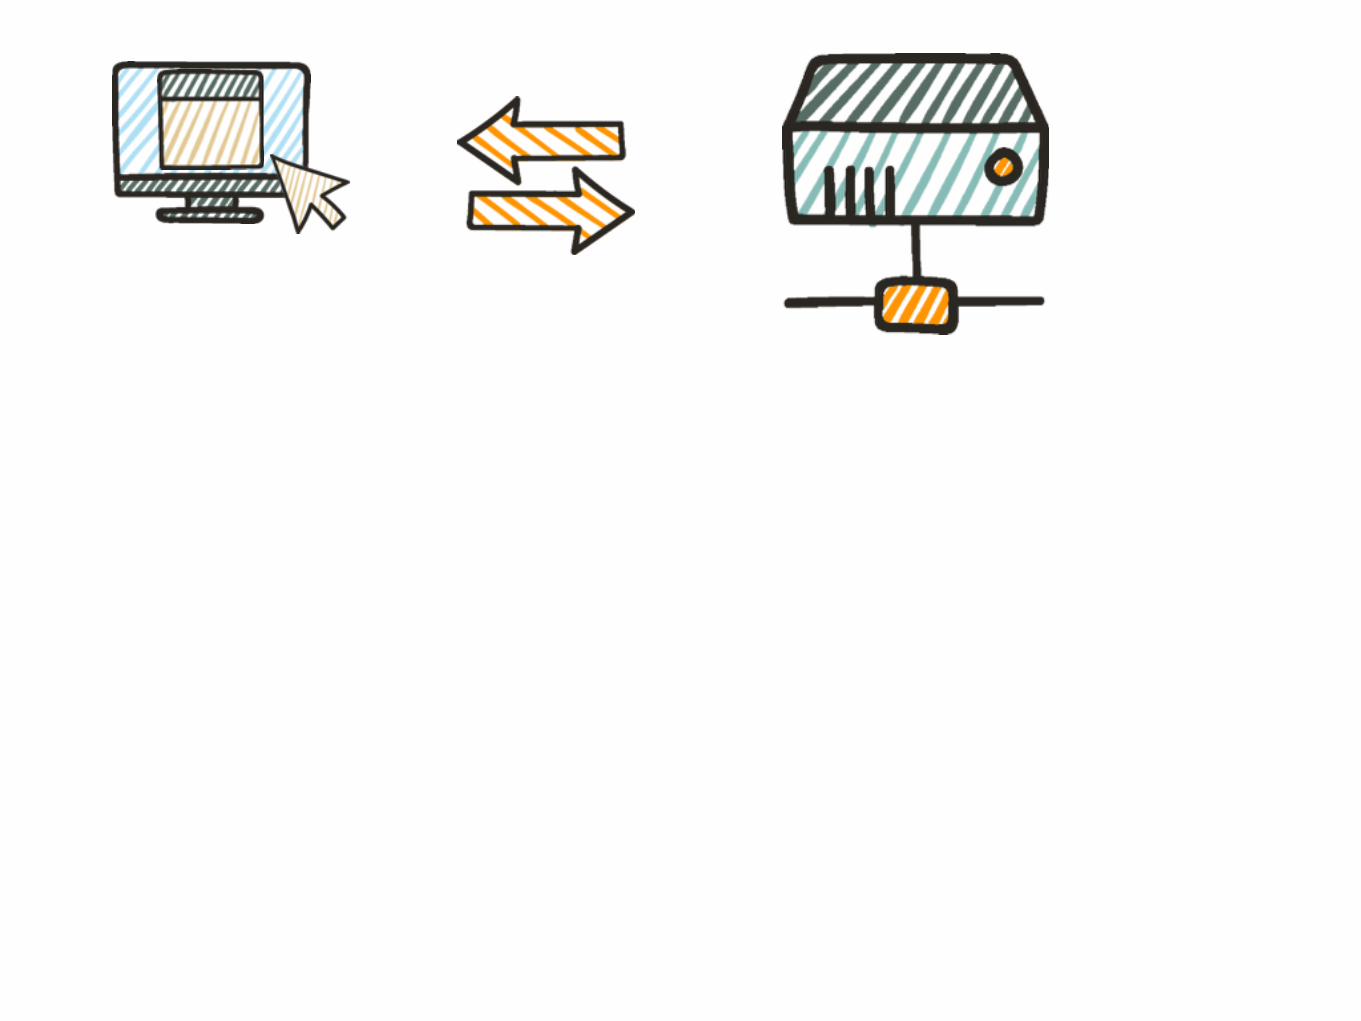


Client-Side Web Performance

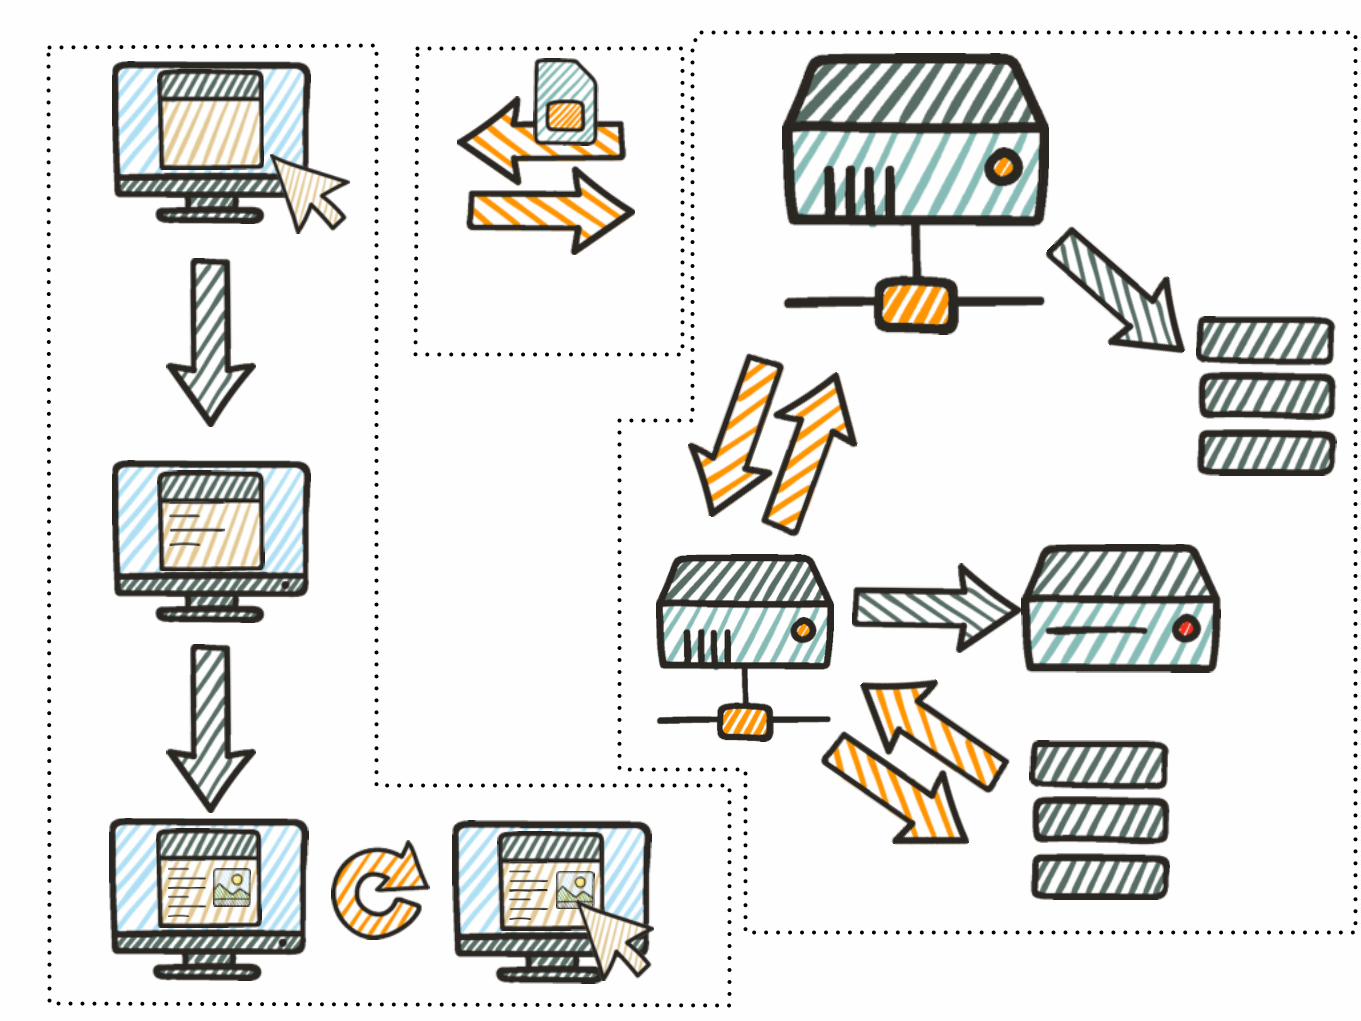
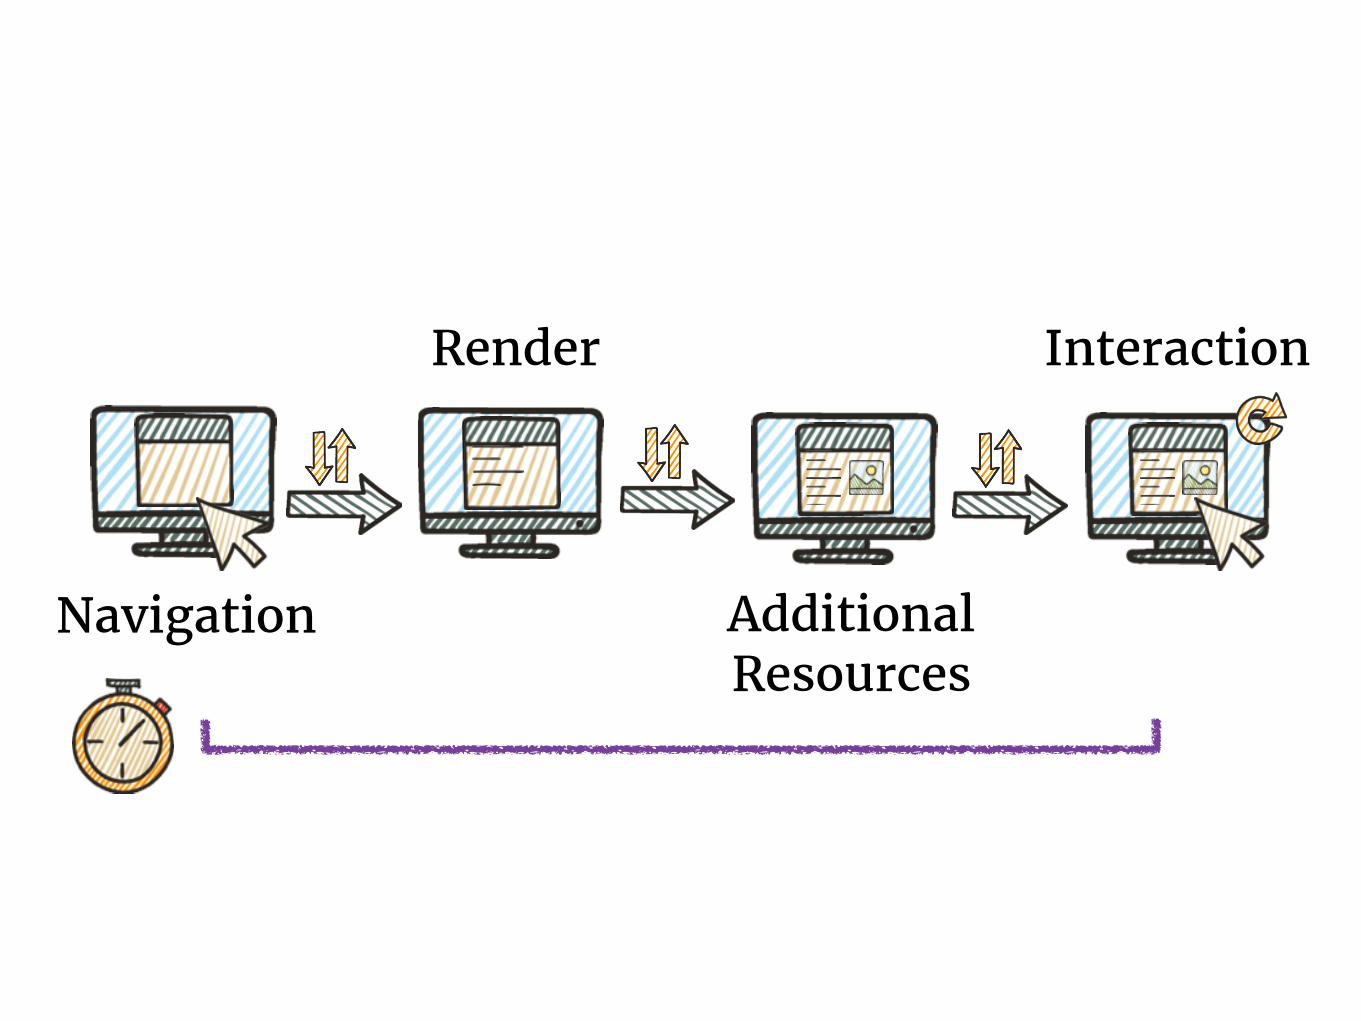
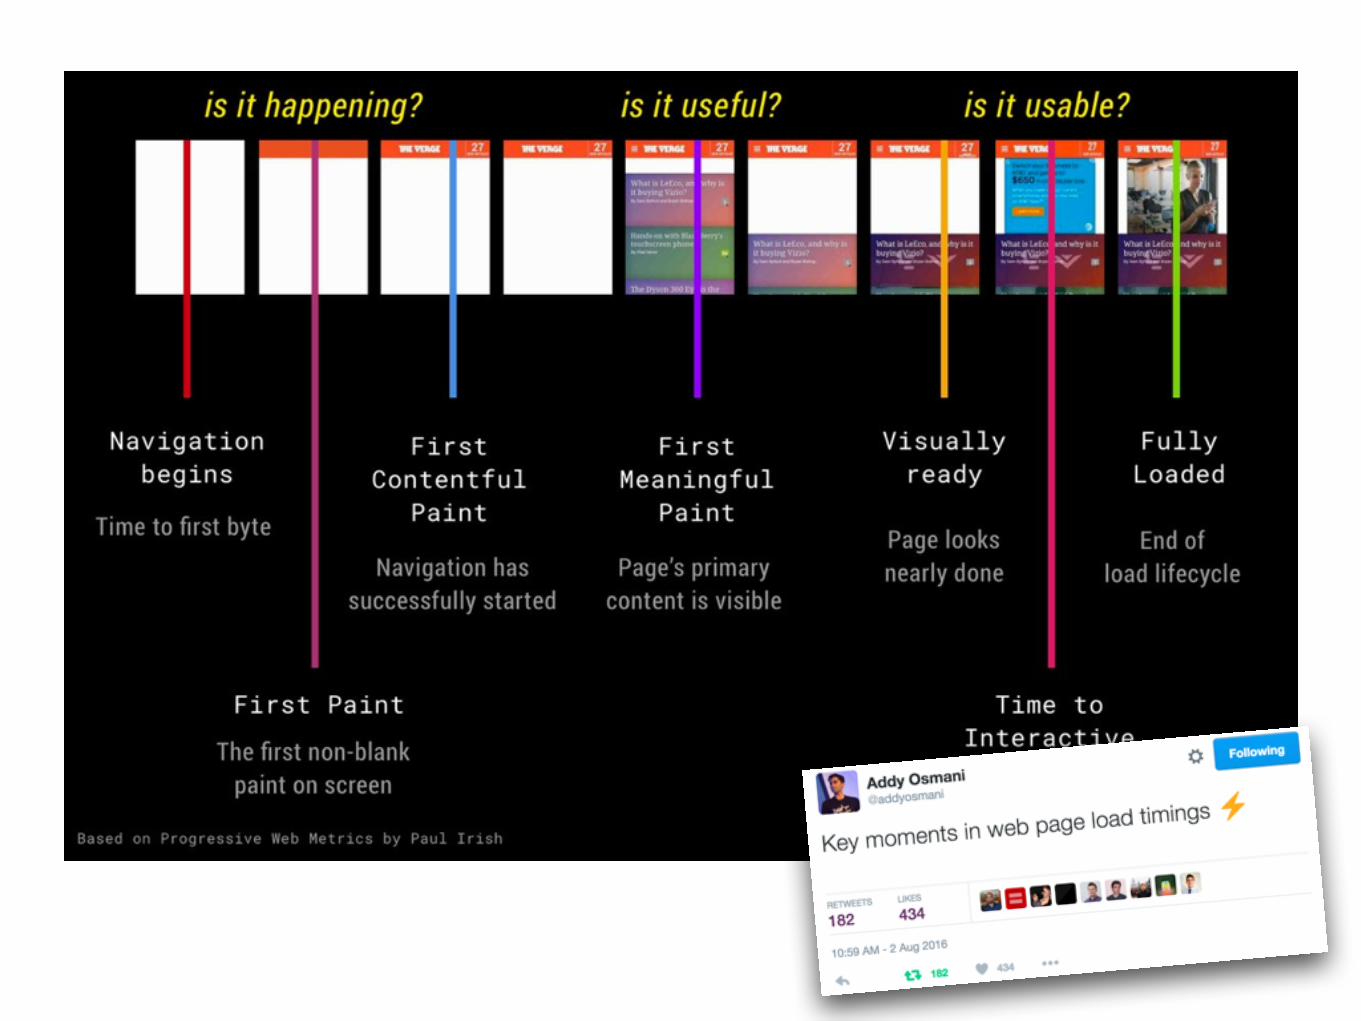
Measuring Performance

Navigation
Render
Additional Resources
Interaction
Navigation
Render
Additional Resources
Interaction

Navigation
Render
Additional Resources
Interaction

Navigation
Render
Additional Resources
Interaction

There’s no single metric for measuring web
performance
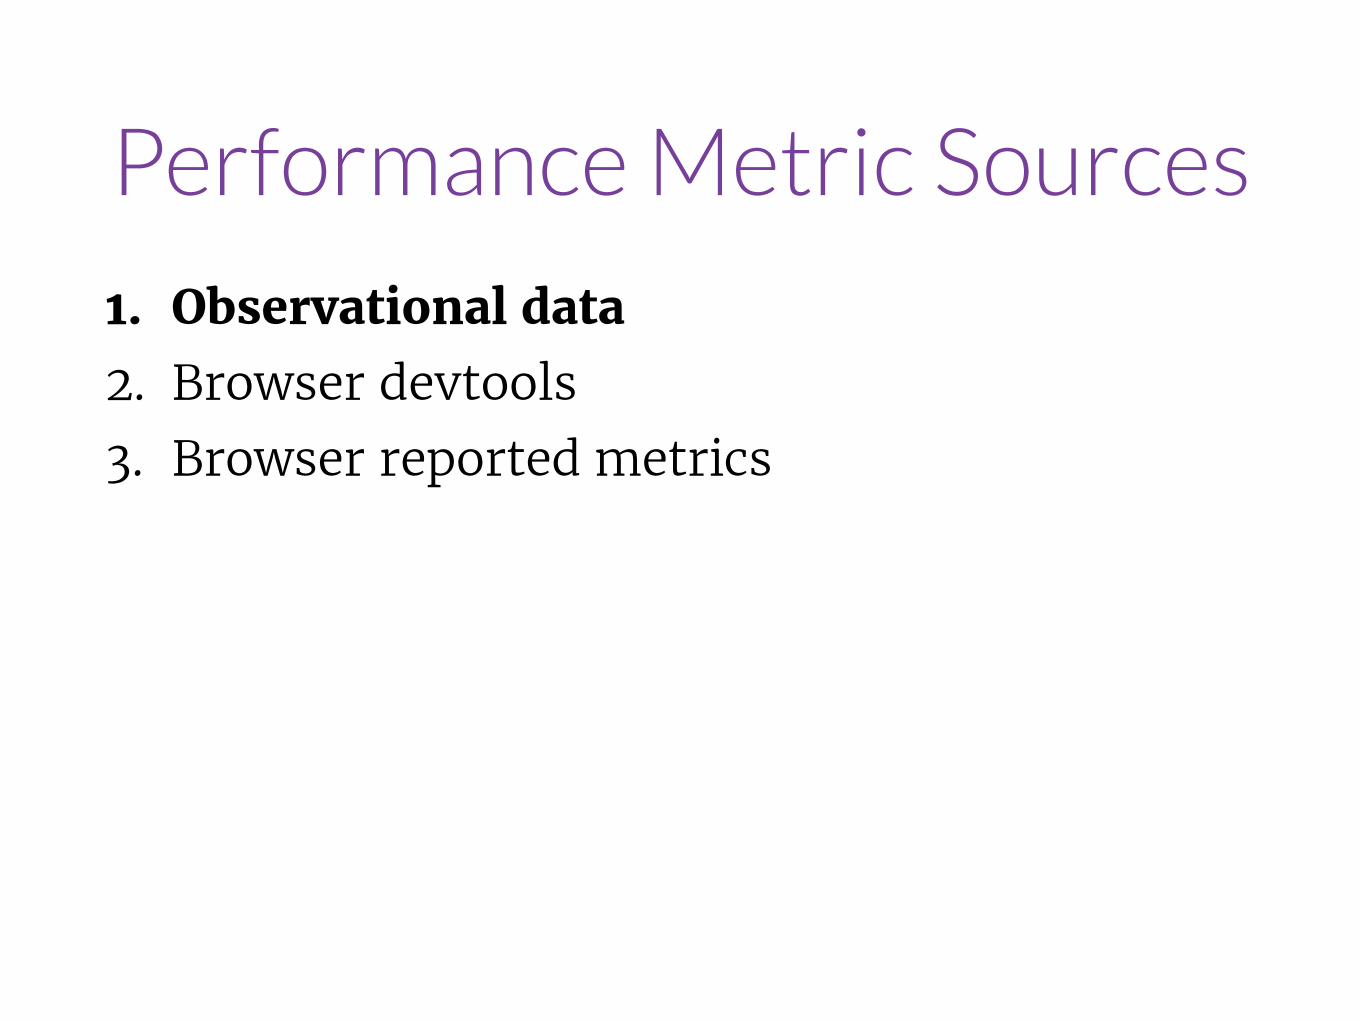
Performance Metric Sources
1. Observational data 2. Browser devtools 3. Browser reported metrics

Observational Data

Performance Metric Sources
1. Observational data 2. Browser devtools 3. Browser reported metrics
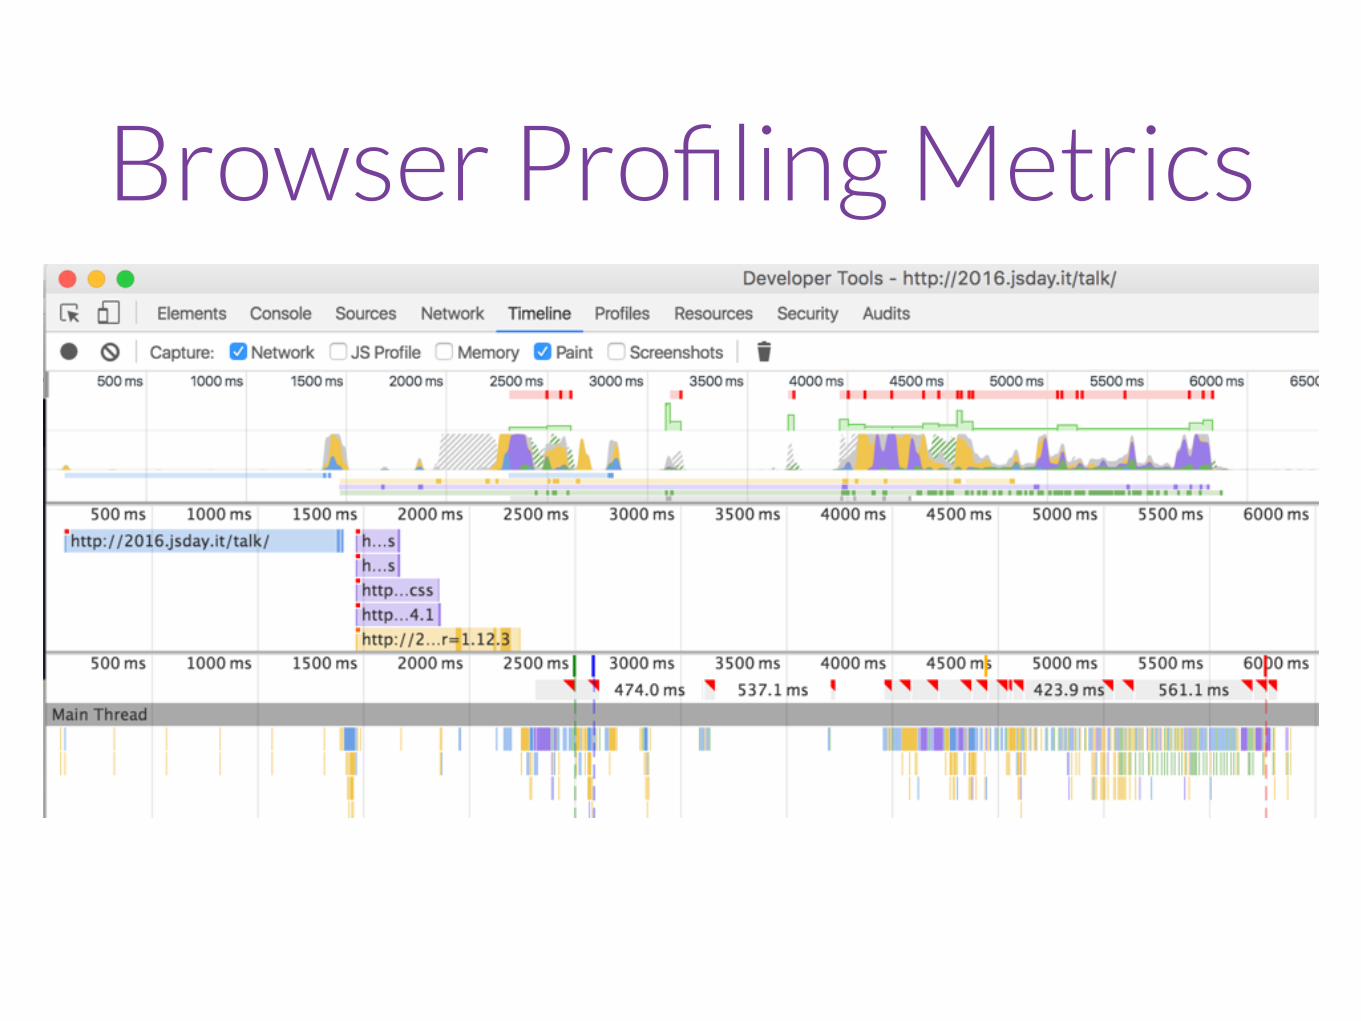
Browser Profiling Metrics

Performance Metric Sources
1. Observational data 2. Browser devtools 3. Browser reported metrics

Performance Metric Sources
1. Observational data 2. Browser devtools 3. Browser reported metrics
• Navigation Timing API • Paint metrics • Custom Metrics

Navigation Timing API

navigationStart
responseStartresponseEnd
domInteractive
domContentLoaded
domComplete

Paint Metrics
window.performance.timing.msFirstPaint
window.chrome.loadTimes().firstPaintTime
Internet Explorer
Chrome

firstPaint

Custom Metricswindow.performance.now()

Custom Metricswindow.performance.mark(‘mainImageLoaded’)
window.performance .getEntriesByName(‘mainImageLoaded’)[0] .startTime

mainImageLoaded
tableSorted

Making Metrics Meaningful

Traditional Site Visit Lifecycle

Page 1
Page 2
Page 3
Page 4

But what about single page applications (SPAs)?

Page 1
Page 2
Page 3
Page 4
SPAs can improve performance, but complicate
performance metrics
With SPAs, 1) instrument router actions, and 2) know that metrics won’t be 1:1.

Determine meaningful abstract metrics on top of low-level browser/app metrics

Can we automate, collect, and monitor these metrics?

1. Client-Side Performance 2. Collect + Monitor 3. Effectively

1. Real User Monitoring (RUM)
2. Synthetic
Collecting Performance Metrics

RUM Performance Metrics
Users Collect Metrics

Sources for RUM Metrics1. Observational data 2. Browser devtools 3. Browser reported metrics
• Navigation Timing API • Paint metrics • Custom Metrics

Tools for RUM Metrics

Browser reported metrics Collect Metrics
Send Metrics (XHR)

Tools for RUM Metrics
• Custom JavaScript • Open source JS libraries
• github.com/lognormal/boomerang • Third party monitoring services

Synthetic Performance Metrics
Automated Test Collect Metrics
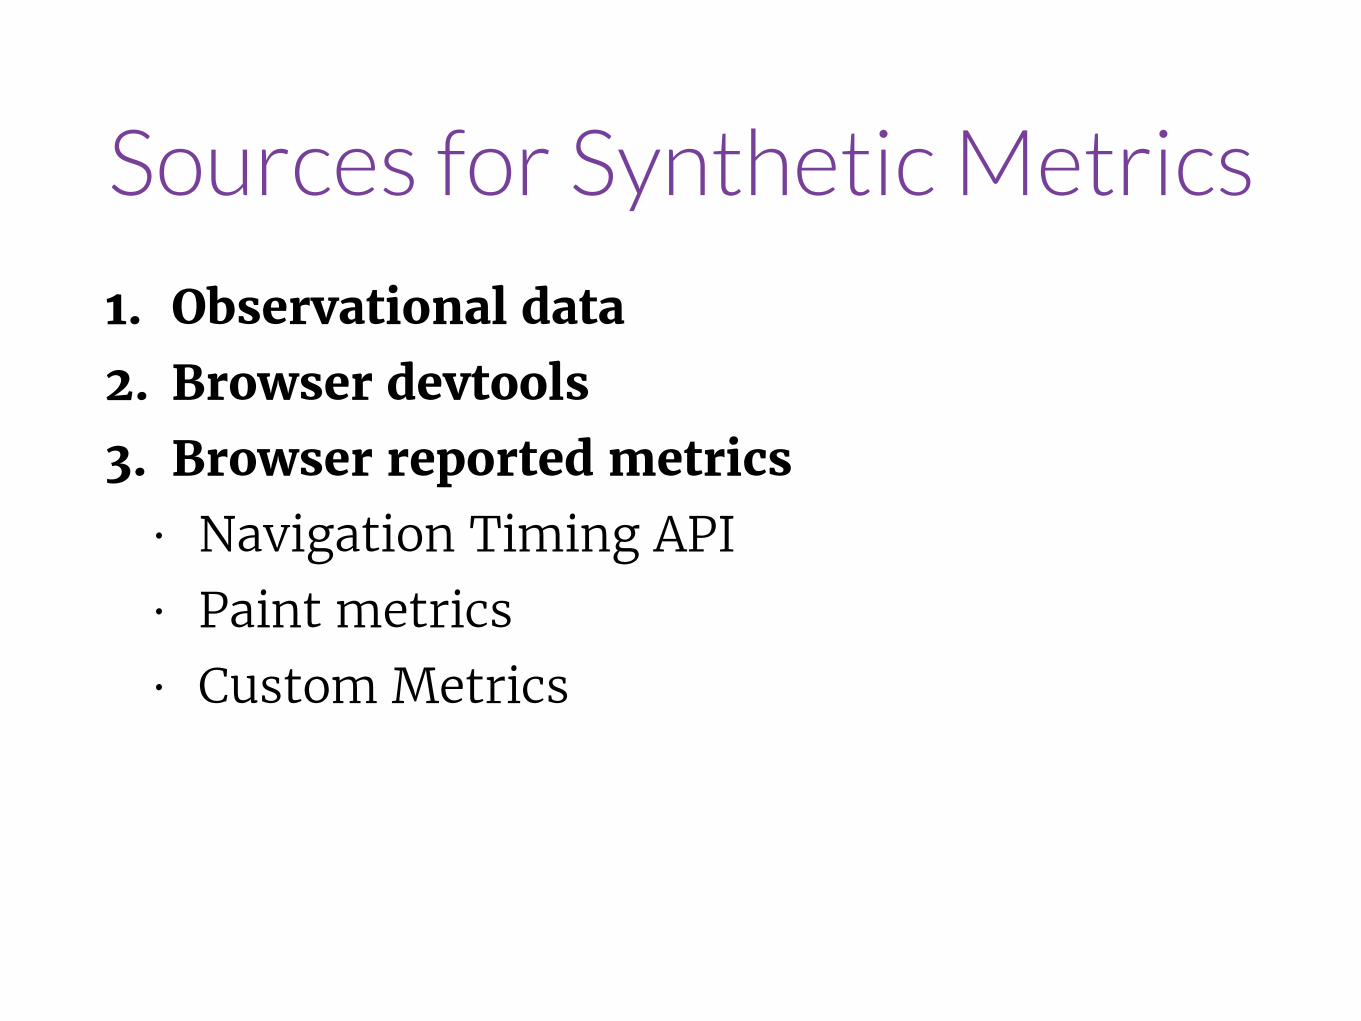
Sources for Synthetic Metrics
1. Observational data 2. Browser devtools 3. Browser reported metrics
• Navigation Timing API • Paint metrics • Custom Metrics

Tools for Synthetic Performance Metrics
Scheduler Browser + Test Runner

Schedulers
• Cron
> 0 * * * * /path/to/script.sh

Schedulers
• Cron
• Continuous integration server • Jenkins
> 0 * * * * /path/to/script.sh

Synthetic test runners• Phantomas • Browser-Perf • WebPagetest • Lighthouse

Phantomas
Headless Browsers

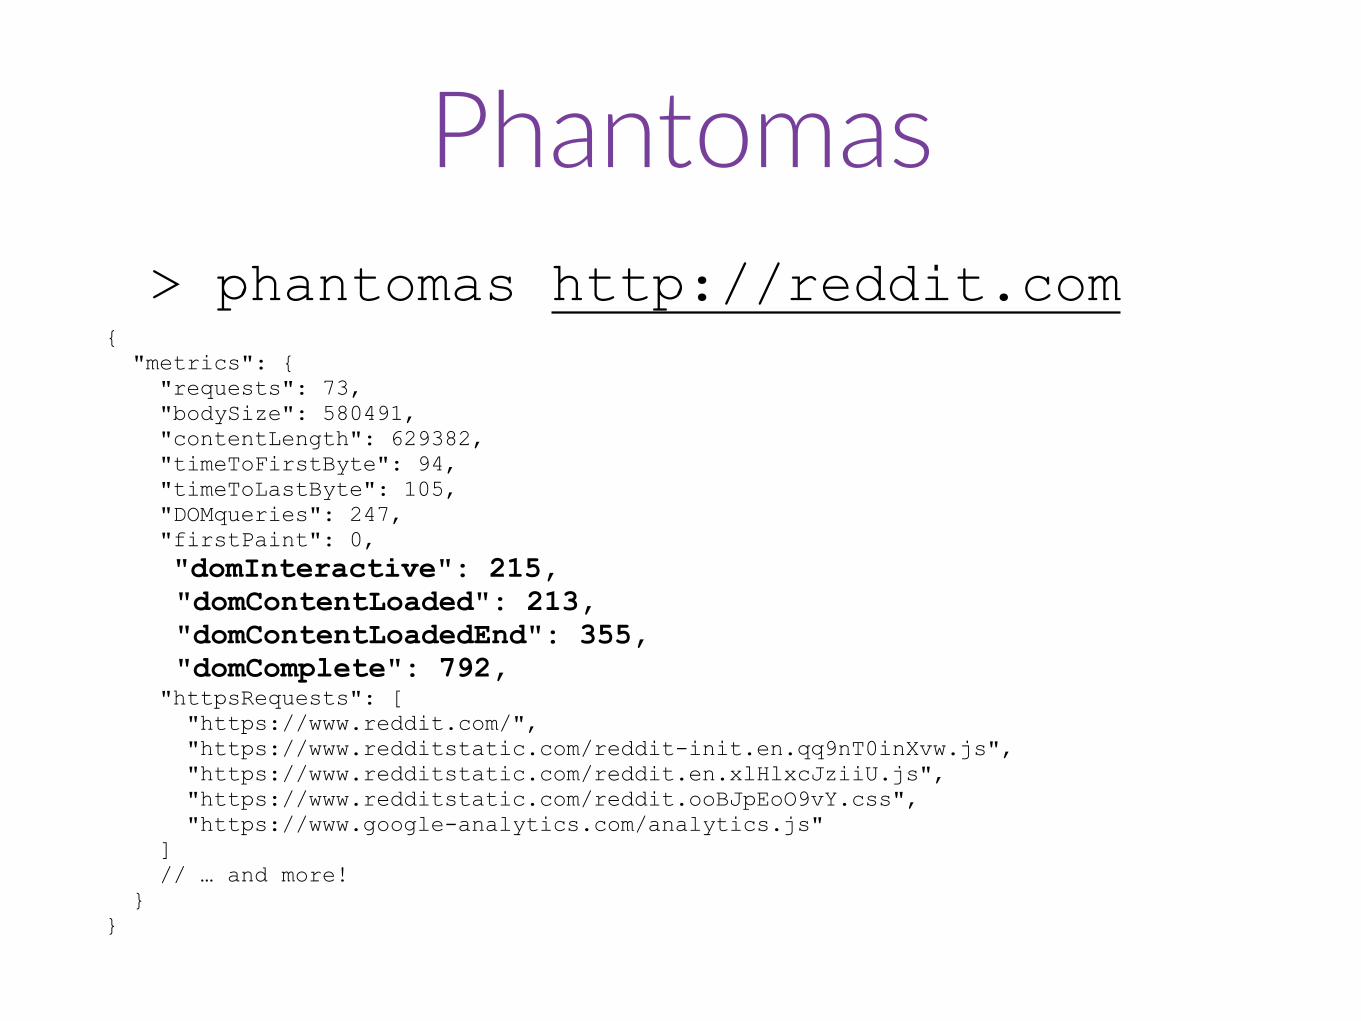
Phantomas> phantomas http://reddit.com
{ "metrics": { "requests": 73, "bodySize": 580491, "contentLength": 629382, "timeToFirstByte": 94, "timeToLastByte": 105, "DOMqueries": 247, "firstPaint": 0, "domInteractive": 215, "domContentLoaded": 213, "domContentLoadedEnd": 355, "domComplete": 792, "httpsRequests": [ "https://www.reddit.com/", "https://www.redditstatic.com/reddit-init.en.qq9nT0inXvw.js", "https://www.redditstatic.com/reddit.en.xlHlxcJziiU.js", "https://www.redditstatic.com/reddit.ooBJpEoO9vY.css", "https://www.google-analytics.com/analytics.js" ] // … and more! } }

Browser-Perf

Browser-Perf> browser-perf http://reddit.com --selenium=selenium.example.com

Browser-Perf> browser-perf http://reddit.com --selenium=selenium.example.com

Browser-Perf> browser-perf http://reddit.com --selenium=selenium.example.com

Browser-Perf> browser-perf http://reddit.com --selenium=selenium.example.com

WebPagetesthttp://www.webpagetest.org/

WebPagetesthttp://www.webpagetest.org/

WebPagetest
Can run on mobile devices

WPT: Speed IndexPaint Time of “Above the Fold” Content
( )
Source: WebPagetest

Calculating Speed Index
1. Take the duration until the page is visually complete, above the fold
2. Separate it into 100ms intervals 3. For each interval, assign it a “percent
visually complete” 4. Invert that percentage so it’s “percent
incomplete” or “percent remaining” 5. Multiply that by the interval length (100ms) 6. Sum all of the intervals. Speed Index!
Mobile viewport size will affect this metric!

Lighthouse


Lighthouse

Lighthouse + WPT?!
https://github.com/WPO-Foundation/webpagetest/pull/825

Storage and Monitoring
• Aggregation • Data storage + queries • Visualization • Alerts + Notification
Storing and Monitoring

Aggregation via StatsD

Storage + Queries with Graphite
mySite.homepage.phantomas.domComplete
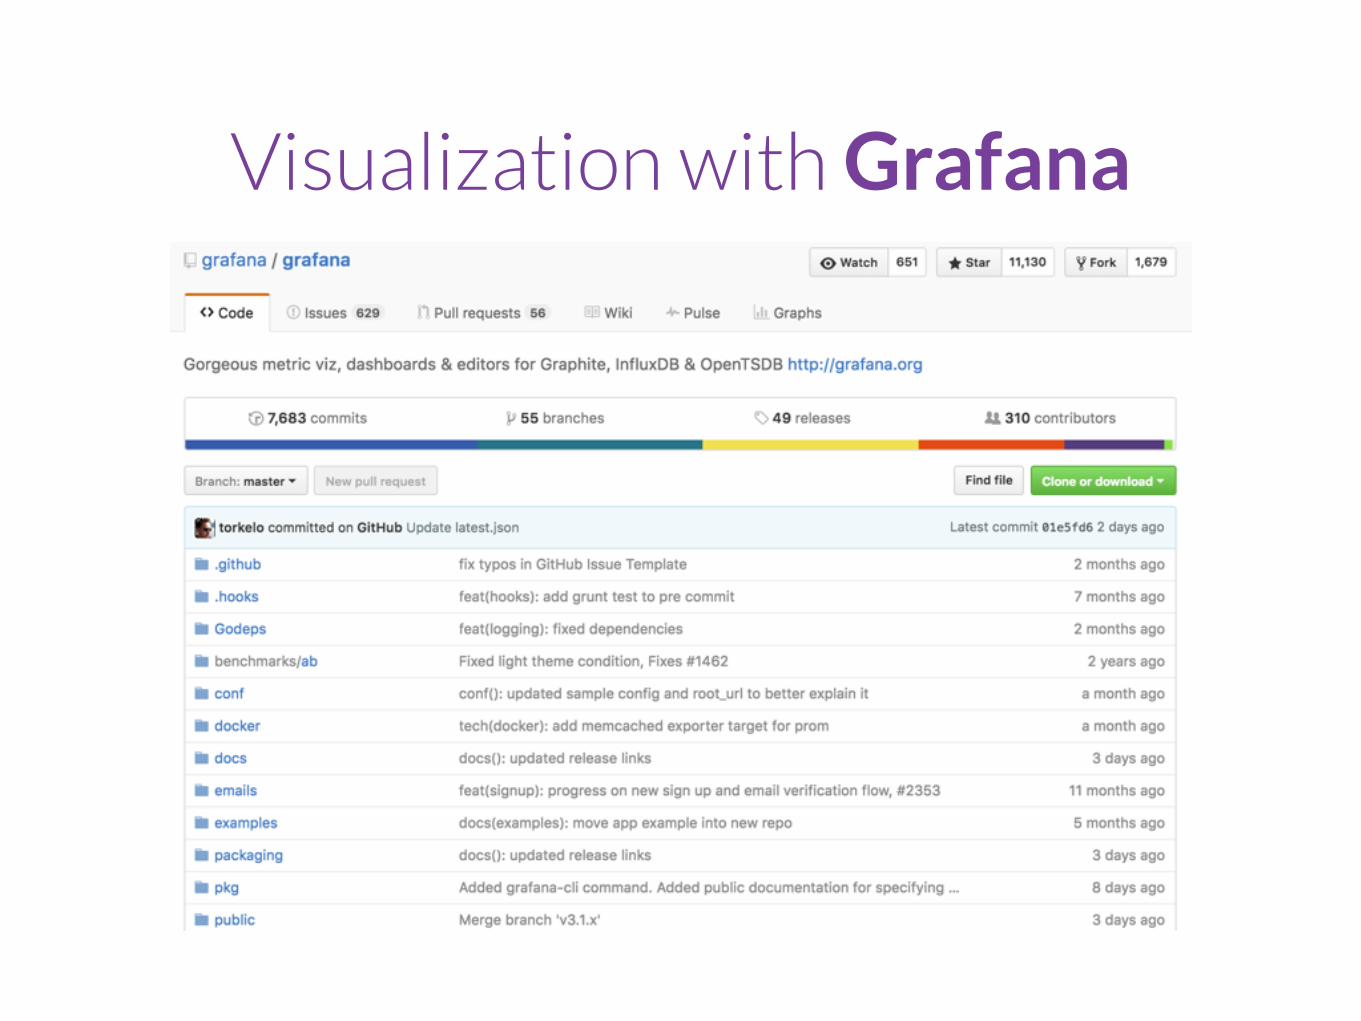
Visualization with Grafana
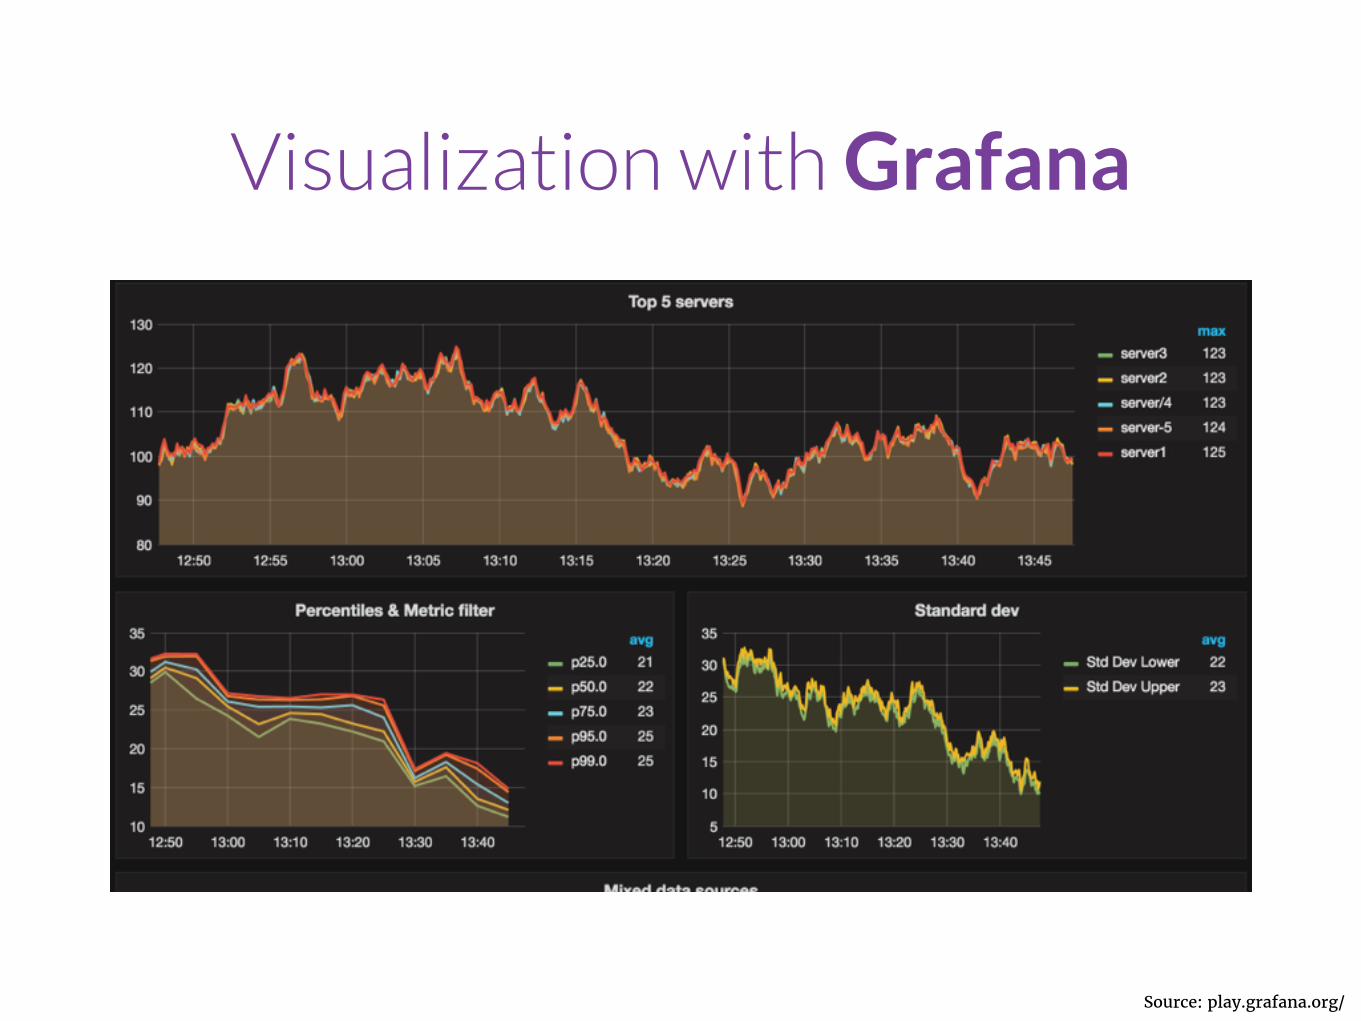
Visualization with Grafana
Source: play.grafana.org/
1. Client-Side Performance 2. Collect + Monitor 3. Effectively

Effective Monitoring
• Reduce noise • Be aware of environment differences • Beware skewed data • Make data actionable • Utilize data

Reduce Noise
• Isolate third party scripts and external services
• Control conditional code paths (A/B tests, etc.)

Be aware of environment differences
• Especially in mobile
• Bandwidth differences • CPU/memory differences

Pyramid of Environment Parity
Mock user agent
Throttle network connection, CPU
Device simulator
Real device

Pyramid of Environment Parity
Mock user agent
Throttle network connection, CPU
Device simulator
Real device
Acc
urac
yEase / Speed

Beware Skewed Data
• Observer effect
• Noisy neighbors

Make Data Actionable
Know what changes will affect each of your metrics

Do something with this data!

Utilize Data
• Agree on performance metrics • Agree on performance goals • Allocate time and resources
to achieving these goals

Performance is a means to an end:
Remember

Performance is a means to an end:
user experience
Remember

Andrew Rota, .
@AndrewRota .
Thanks!Recommend Resources
• bit.ly/google_rails • bit.ly/webpagetest_docs • bit.ly/browser_perf • bit.ly/statsdcc • bit.ly/phantomas_js • graphite.readthedocs.io