Embed Size (px)
Citation preview

© 2011 Cisco and/or its affiliates. All rights reserved. 1
Cisco UCS Business Decision Maker TCO Competitive OverviewCisco SystemsData Center and VirtualizationUnified Computing System
April 2012

© 2011 Cisco and/or its affiliates. All rights reserved. 3
SERVER-RELATED SPEND (CAPEX+OPEX)WW Spending on Servers, Power & Cooling, Mgmt. / AdministrationOVERALL SPEND DISTRIBUTION
29%
22%12%
11%
10%
7%
7% 2%
People Software Energy / Facilities Servers
Networking Storage Disaster Recovery Overhead
Source: Gartner—Cisco IT, “Data Center Cost Portfolio” Source: IDC, “New Economic Model for the Datacenter”
Data Center Economics
1996
1997
1998
1999
2000
2001
2002
2003
2004
2005
2006
2007
2008
2009
2010
2011
2012
2013
$0
$50
$100
$150
$200
$250
$300
Power & Cooling ExpenseMgmt. & Administration—Virtual ServersMgmt. & Administration—Standalone ServersServer Spending
80%OpEx
IDC, 2011
Cus
tom
er S
pend
ing
($B
)

© 2011 Cisco and/or its affiliates. All rights reserved. 4
BusinessAgility
BusinessScalability
BusinessResiliency
OperationalEfficiency
Technology Innovation Benefit
Network Storage Virtualization Mgmt.Compute Security
Cisco Architectural Advantage
Reduce TCO
ManageRisk
Manage Growth
ExpandBusinessOpportunities
Technologies
Bus
ine
ss A
dva
nta
ge
Cisco Unified Computing System (UCS)The Architectural Advantage

© 2011 Cisco and/or its affiliates. All rights reserved. 5
Customers Have Spoken
UCS momentum is fueled by game-changing innovation; Cisco is quickly passing established players 1
11,000+ UCS Customers WW
$1.3B annualized revenue run rate for CY11Q4
x86 Blade servers are growing over twice as fast as the overall x86 computing market 2
Source: 1 IDC Worldwide Quarterly Server Tracker, Q4 2012, February, 2012, Revenue Share 2 IDC Q3 CY11 Server Forecaster, Based on Blade Revenue
UCS #3 with 12.3%
UCS #2 with 19.1%
WW
US
UCS momentum is fueled by game-changing innovation; Cisco is quickly passing established players 1
UCS FY12Q2 growth of 91% Y/Y
UCS After Two Short Years
X86
Ser
ver
Bla
de M
arke
t Sha
re, Q
4 C
Y12
1
© 2011 Cisco and/or its affiliates. All rights reserved. 6
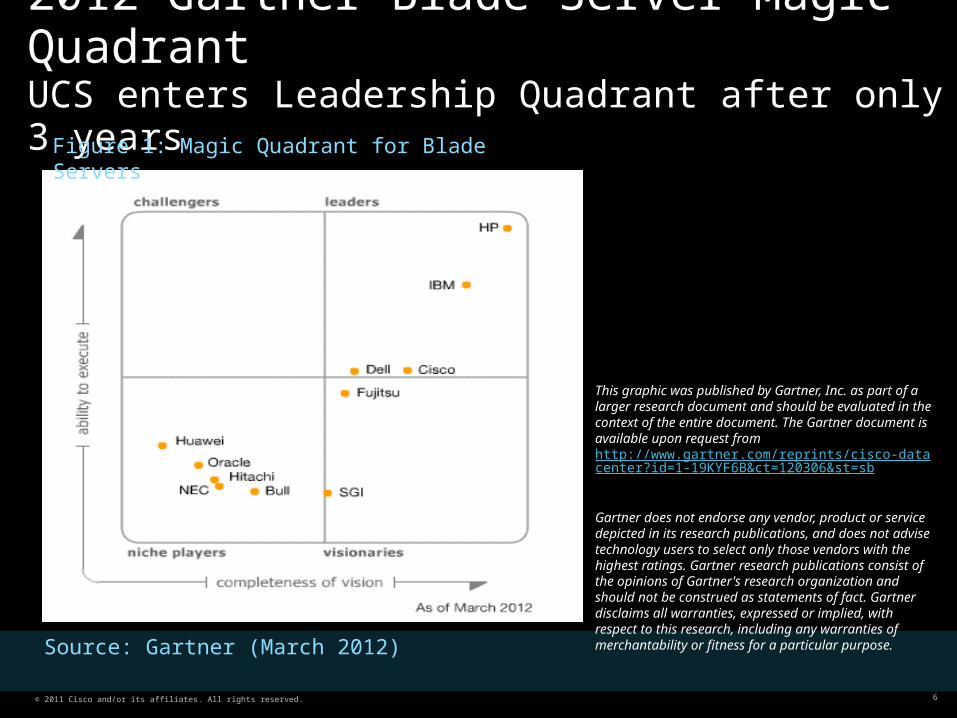
2012 Gartner Blade Server Magic QuadrantUCS enters Leadership Quadrant after only 3 years
Figure 1: Magic Quadrant for Blade Servers
Source: Gartner (March 2012)
This graphic was published by Gartner, Inc. as part of a larger research document and should be evaluated in the context of the entire document. The Gartner document is available upon request from http://www.gartner.com/reprints/cisco-datacenter?id=1-19KYF6B&ct=120306&st=sb
Gartner does not endorse any vendor, product or service depicted in its research publications, and does not advise technology users to select only those vendors with the highest ratings. Gartner research publications consist of the opinions of Gartner's research organization and should not be construed as statements of fact. Gartner disclaims all warranties, expressed or implied, with respect to this research, including any warranties of merchantability or fitness for a particular purpose.

© 2011 Cisco and/or its affiliates. All rights reserved. 7
Cisco Unified Computing SystemA Differentiated / Revolutionary Approach
Higher PerformanceBrings out the best of Intel Xeon ProcessorsOptimized Resource Utilization for Compute, Networking and Management
No CompromisesNo Trade-offs for FunctionEnhanced Design CapabilityDesigned for the Future, TodayBetter TCO / ROI
Simpler ArchitectureNetworking with fewer componentsLower cost and easier scalingFewer Management Touch Points
Faster, More Flexible Automated Deployment / ProvisioningUnification leads to reduced ComplexityManagement via a single interface
Cisco UCS—Unified Infrastructure, Scalability and Management Automation

© 2011 Cisco and/or its affiliates. All rights reserved. 8
Cisco Unified Computing SystemA Differentiated / Revolutionary Approach
Cisco UCS—Unified Infrastructure, Scalability and Management Automation
Higher PerformanceBrings out the best of Intel Xeon ProcessorsOptimized Resource Utilization for Compute, Networking and Management
No CompromisesNo Trade-offs for FunctionEnhanced Design CapabilityDesigned for the Future, TodayBetter TCO / ROI
Faster, More Flexible Automated Deployment / ProvisioningUnification leads to reduced ComplexityManagement via a single interface
Simpler ArchitectureNetworking with fewer components
Lower cost and easier scalingFewer Management Touch Points

© 2011 Cisco and/or its affiliates. All rights reserved. 9
Simpler ArchitectureScale without Complexity
HP UCS
Growing Capacity Requires Infrastructure Change
Scale Requires Large Server Increments (16)Larger Embedded Cost, Larger Footprint
(10U)
$57,641 – Cost of 17th Server Capacity (server not included)
12 Server ID Presets
Constant Infrastructure With Growth
Scale In Smaller Server Increments (8),Lower Cost, Smaller Footprint (6U)
$11,556 - Cost of 17th Server Capacity (server not included)
127+ Server ID SettingsCompletely Automated Including
Firmware and I/O Devices

© 2011 Cisco and/or its affiliates. All rights reserved. 10
Simpler ArchitectureDynamic Scaling
Cisco UCS• Compute added in smaller increments
• Networking with fewer components
• Management via a single interface
HP c7000• Large hardware blocks to add compute capacity
• Multiple networking components
• Multiple touch points
• Multiple management points for servers and networking
Mgmt switch
LAN
SAN A
SAN B
LANMgmt switch
64 blades shown here 80 blades shown here
Mgmt switch
LAN LANSAN A SAN B
Mgmt switch

© 2011 Cisco and/or its affiliates. All rights reserved. 11
Simpler ArchitectureFewer Management Touch Points
32 blades – 4 x Cisco UCSFabric Interconnects 2
Intra Chassis Switches 0
Chassis Mgmt Module 0
Total Mgmt Points 1
32 blades – 2 x HP c7000Fabric Interconnects 0
Intra Chassis Switches 4
Chassis Mgmt Module 4
Total Mgmt Points 8
© 2011 Cisco and/or its affiliates. All rights reserved. 12
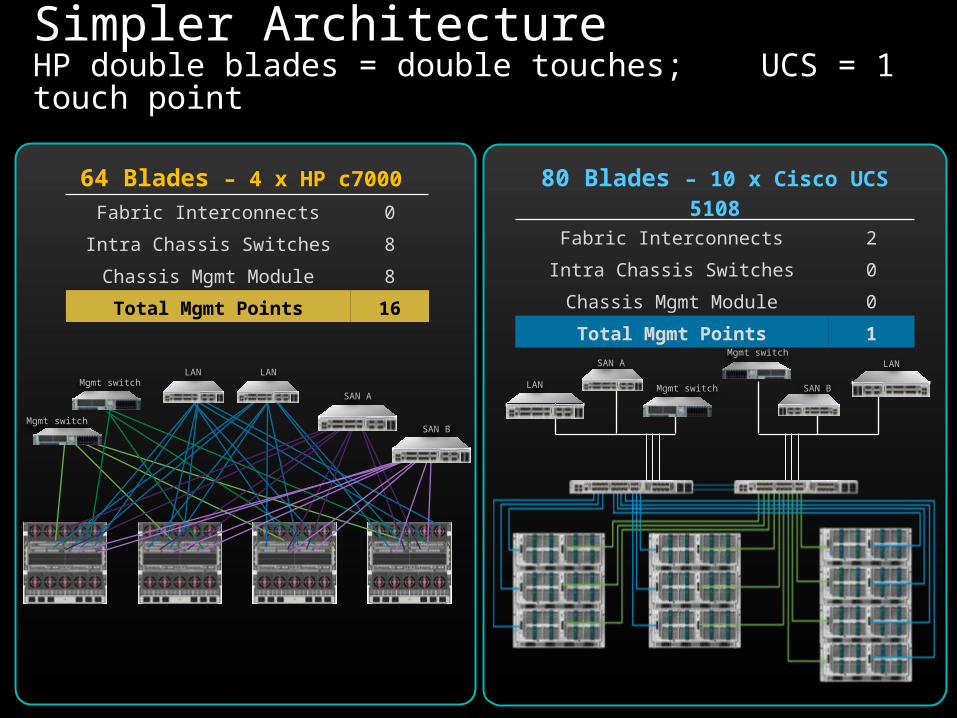
Simpler ArchitectureHP double blades = double touches; UCS = 1 touch point
64 Blades – 4 x HP c7000
Fabric Interconnects 0
Intra Chassis Switches 8
Chassis Mgmt Module 8
Total Mgmt Points 16
80 Blades – 10 x Cisco UCS 5108
Fabric Interconnects 2
Intra Chassis Switches 0
Chassis Mgmt Module 0
Total Mgmt Points 1
Mgmt switchLAN
LANSAN A
SAN B
Mgmt switch
Mgmt switch
LAN
SAN A
SAN B
LANMgmt switch

© 2011 Cisco and/or its affiliates. All rights reserved. 13
Simpler ArchitectureLower Cost
HP UCS
Back of each blade chassis has a “rack’s worth of infrastructure”
Blade and Rack servers require separate management
Back of each chassis is a profit center
Adding chassis adds a “rack’s worth of infrastructure” burden
One infrastructure for multiple blade chassis and racks
One Management interface for multiple blade chassis AND rack servers
Low cost FEX integrates Management and I/O (Enet, FC and Mgmt) - FCoE
Scaling is a plug and play operation

© 2011 Cisco and/or its affiliates. All rights reserved. 14
Simpler Architecture No Infrastructure Penalty to Scale
HP pricing publically available on April 16, 2012. Cisco UCS pricing MSRP on April 16, 2012.Pricing is for blade chassis and networking only. Servers are not included.
16 17 24 32 40 48 56 64 72 80 88 96$0
$50,000
$100,000
$150,000
$200,000
$250,000
$300,000
$350,000
$400,000
$63,854 $75,410
$86,966 $98,522
$110,078 $127,551
$145,025 $162,498
$179,971 $197,445
$214,918
$52,645
$115,282
$172,923
$230,564
$288,205
$345,846
Total Number of Chassis Blade Server Slots
Cisco UCS
HP c7000
Cha
ssis
and
I/O
Cos
t
BLADE CHASSIS SAVINGS AT SCALE—BLADE SLOT SOLUTIONUCS 5108 with pair of UCS 6248UP Fl (two 10 Gbps uplinks per 2204 FEX) vs.
HP c7000 with one pair of VC Flex Fabric, and HP IC. Price includes HP VCEM for slot counts >16 (2 chassis and up)
Blade Chassis Infrastructure cost to support servers is critical.
The Chassis and I/O.
HP is $39,872 more to get ready to add a 17th server.
Cisco UCS is 34% less than HP

© 2011 Cisco and/or its affiliates. All rights reserved. 15
Cisco Unified Computing SystemA Differentiated / Revolutionary Approach
Cisco UCS—Unified Infrastructure, Scalability and Management Automation
Higher PerformanceBrings out the best of Intel Xeon ProcessorsOptimized Resource Utilization for Compute, Networking and Management
No CompromisesNo Trade-offs for FunctionEnhanced Design CapabilityDesigned for the Future, TodayBetter TCO / ROI
Simpler ArchitectureNetworking with fewer componentsLower cost and easier scalingFewer Management Touch Points
Faster, More Flexible Automated Deployment / Provisioning
Unification leads to reduced ComplexityManagement via a single interface

© 2011 Cisco and/or its affiliates. All rights reserved. 16
Faster, More FlexibleUnification Reduces Complexity
HP UCS
Blade server and Rack servers managed separately
Deploying servers very manual and time consuming
Growing capacity increases complexity
Scale requires large increments
Blade and Rack servers managed via a single interface
47% faster and 67% less steps.UCS Automated Deployment / Provisioning
Unification yields constant, leveraged infrastructure.
Scale in smaller increments

© 2011 Cisco and/or its affiliates. All rights reserved. 17
Converging Legacy Infrastructure
• Infrastructure not designed for easy integration
• Layers of Management software holding the system together
Complexity Drives Up Management Costs
• Rigid models to upgrade and maintain system-level designs
• Multiple tools and points of configuration
Legacy Infrastructure and Management
THINK BEYOND CONVERGENCE
Converged Infrastructure = Management Software Layers

© 2011 Cisco and/or its affiliates. All rights reserved. 18
UCS—More Flexible, Less Complexity
HP iLO Advanced for BladeSystem
Virtual Connect Manager
Onboard Administrator
HP Server Hardware Management
Multiple Layers of Software Required
16 blade servers0 rack servers
Separate management – every chassis, all softwareSeparate Enet & Fibre Channel I/O leaving the
chassis
UCS Manager 1 Console
No Added CostRack and Blade Together
16 blade servers6 rack servers
Unified Management Unified Networking
HP Insight Control
HP System Insight Manager(SIM)
Virtual Connect Enterprise Manager
HP c7000 Cisco UCS
16 blade servers0 rack servers

© 2011 Cisco and/or its affiliates. All rights reserved. 19
Virtual Connect Enterprise ManagerVirtual Connect Enterprise Manager
HP System Insight Manager(SIM)
HP Insight Control
UCS—More Flexible, Less Complexity
HP Server Hardware Management
Multiple Layers of Software Required
HP c7000
64 blade servers0 rack servers
UCS Manager 1 Console
No Added CostRack and Blade Together
Cisco UCS
HP iLO Advanced for BladeSystem
Virtual Connect Manager
Onboard Administrator
HP iLO Advanced for BladeSystem
Virtual Connect Manager
Onboard Administrator
HP iLO Advanced for BladeSystem
Virtual Connect Manager
Onboard Administrator
HP iLO Advanced for BladeSystem
Virtual Connect Manager
Onboard Administrator
HP iLO Advanced for BladeSystem
Virtual Connect Manager
Onboard Administrator
Separate Management - Every Chassis, All SoftwareSeparate Enet & Fibre Channel I/O leaving the chassis
80 blade servers0 rack servers
Up to 160 serversBlade or Rack mount
Unified Compute Unified Management Unified Networking
32 blade servers0 rack servers
Virtual Connect Enterprise Manager
HP Insight Control
HP System Insight Manager(SIM)
16 blade servers0 rack servers

© 2011 Cisco and/or its affiliates. All rights reserved. 20
Cisco Unified Computing SystemA Differentiated / Revolutionary Approach
Cisco UCS—Unified Infrastructure, Scalability and Management Automation
No CompromisesNo Trade-offs for FunctionEnhanced Design CapabilityDesigned for the Future, TodayBetter TCO / ROI
Simpler ArchitectureNetworking with fewer componentsLower cost and easier scalingFewer Management Touch Points
Faster, More Flexible Automated Deployment / ProvisioningUnification leads to reduced ComplexityManagement via a single interface
Higher PerformanceBrings out the best of Intel Xeon ProcessorsOptimized Resource Utilization for Compute,
Networking and Management

© 2011 Cisco and/or its affiliates. All rights reserved. 21
Higher Performance
HP UCS
Updating requires multiple touches
Indeterminate latency
60 Gbps / blade, expensive
16 DIMMs in the BL460 Gen8
Cisco single touch updates / deploys faster
Identical latency between blade servers
80 Gbps per blade, for much less.
24 DIMMs in the B200 M3

© 2011 Cisco and/or its affiliates. All rights reserved. 22
Faster, More FlexibleUCS Automated Deployment
20 20
27
38
0
10
20
30
40
50
1-blade scenario 2-blade scenario
Min
ute
s
Cisco UCS solution
HP solution
The Cisco UCS Solution Reduces Time
10 14
24
42
0
10
20
30
40
50
1-blade scenario 2-blade scenario
Ste
ps
Cisco UCS solution
HP solution
The Cisco UCS Solution Reduces Complexity
Cisco UCS - Model-based management speeds deployment Fewer touch points reduces errors
http://www.youtube.com/watch?v=nijWlNzSgCQ

© 2011 Cisco and/or its affiliates. All rights reserved. 23
Higher PerformanceIncreasingly Higher I/O Capacity
• Bringing out the best of Intel Xeon E5 Processors
• Optimized Resource Utilization for Compute, Networking and Management
• New innovations in the Cisco Unified Computing System™ (Cisco UCS™) mark the third generation of fabric computing and extend the exceptional capabilities of the industry’s first truly unified data center platform.
• Highest scale, low latency networking: Cisco UCS 6296UP Fabric Interconnect and Cisco UCS 2204XP Fabric Extender
• 4X Bandwidth—2 Tbps
• 40% decrease in latency—sub 2 uS
• 48 10Gbps Unified Ports per RU
• Industry’s first 40 Gbps-to-the-blade, integrated modular LOM solution with up to 80Gbps bandwidth via an I/O expander in the optional mezzanine slot
• 50X vNICs—over 100 per server
• Higher VM consolidation—100s per server
• Virtual I/O using vSwitch leads to 30% reduction in CPU utilization
• B230 has the greatest memory density of any comparable blade server
Investment Protection: Cisco Is Delivering Server Generational Support, Without the Need for New Chassis

© 2011 Cisco and/or its affiliates. All rights reserved. 24© 2010 Cisco and/or its affiliates. All rights reserved. 2424© 2010 Cisco and/or its affiliates. All rights reserved.
VC Domain #2
Chassis #Primary Enclosure 1
FlexFabric FlexFabric
VC Domain #1
Chassis #Primary Enclosure 1
Primary Enclosure 2
Primary Enclosure 3
Primary Enclosure 4
C1
C2
C3
C4
Databases are very latency dependent, needing predictable, not variable latency.
Variable Latency
There are up to 3 different latencies shown here. There can be more depending on I/O path (switch) being used by origin and destination blade servers.
Compare latencies in VC Domain #1:
Within a single chassis: One hop (C1 blade / switch/C1 blade)
Between blades in chassis #1 & 2: Two hops (C1 blade / switch / switch / C2 blade)
Between blades in chassis #4 & 3: Three hops (C1 blade / switch / ToR switch / VC Domain 2 – C1 switch / blade)
C1 = Chassis 1; C2 = Chassis 2; etc
Net: 1, 2, or 3 hops. Very variable.
A
B
C
One Pair Flex Fabric per Chassis Using HP Virtual Connect (VC)
FlexFabric FlexFabric
FlexFabric FlexFabric
FlexFabric FlexFabric
FlexFabric FlexFabric
C1
C2
C3
C4
Latency between domains is also 3 hops.
Variable Latency with HP Design
C
A
B
C
A
B

© 2011 Cisco and/or its affiliates. All rights reserved. 25
With UCS, databases get the defined latency they require for optimal performance, with full redundancy.
Consistent Latency
With Cisco UCS you identical latencies
Going from one blade to another blade in the same chassis, is 1 hop, blade to FI to blade.
Going from one blade to another blade in a different chassis, is 1 hop, blade to FI to blade.
Going from one blade to another blade in a different chassis, in a different rack, is still just 1 hop, blade to FI to blade.
This “1 hop” delivery between any blade, for a single fabric in the domain, is due to Cisco’s architectural innovation. A single UCS Domain can scale up to 20 chassis and 160 blades.
Net:
1 hop, 1 hop, 1 hop. No more.
This architecture meets the consistent latency requirements required by data centers.
A
B
C
I/O for all blades is dual path, active/active,
from both sides of every chassis.
The Fabric Interconnects (FI) are clustered, supplying redundant I/O for every blade and every chassis.
C
Single Latency with UCS Architecture
B
A
A
B

© 2011 Cisco and/or its affiliates. All rights reserved. 26
Higher PerformanceBrings out the best of Intel Xeon ProcessorsOptimized Resource Utilization for Compute, Networking and Management
Simpler ArchitectureNetworking with fewer componentsLower cost and easier scalingFewer Management Touch Points
Faster, More Flexible Automated Deployment / ProvisioningUnification leads to reduced ComplexityManagement via a single interface
Cisco Unified Computing SystemA Differentiated / Revolutionary Approach
Cisco UCS—Unified Infrastructure, Scalability and Management Automation
No CompromisesNo Trade-offs for Function
Enhanced Design CapabilityDesigned for the Future, Today
Better TCO / ROI

© 2011 Cisco and/or its affiliates. All rights reserved. 27
No Compromises
HP UCS
Costly to add more I/O to each chassis
HP “accidental mini-rack” chassis design has high cost burden to scale
Through-put trade off for features
HP has already announced a new chassis coming in about two years
Efficient and Effective, low cost I/O additions
UCS delivers lower TCO by design with easy, lower cost scaling
No sacrifice of function for features
UCS chassis has the future built in today

© 2011 Cisco and/or its affiliates. All rights reserved. 28
No CompromiseCisco Solution TCO advantage increases at scale
$0
$200,000
$400,000
$600,000
$800,000
$1,000,000
$1,200,000
3 Year Hardware Warranty
3 Year Power Costs
Hardware Management
Server Deployment
Cabling
TOR Switches
Chassis & Interconnects
Server Hardware
CiscoHP
8 16 32 48 64 80# of Servers
CiscoHP CiscoHP CiscoHP CiscoHP CiscoHP
HP retail and Cisco MSRP pricing on 3/30/2012
HP Trend Line
Cisco Trend Line
ServersHP: BL460 Gen8Cisco: B200 M3
All chassis fully populated with servers (starting at qty 16).
Each server has two E5-2620 Intel Xeon processors with 16GB memory (two 8GB DIMMs) 16GB
© 2011 Cisco and/or its affiliates. All rights reserved. 29
Cisco UCSHP
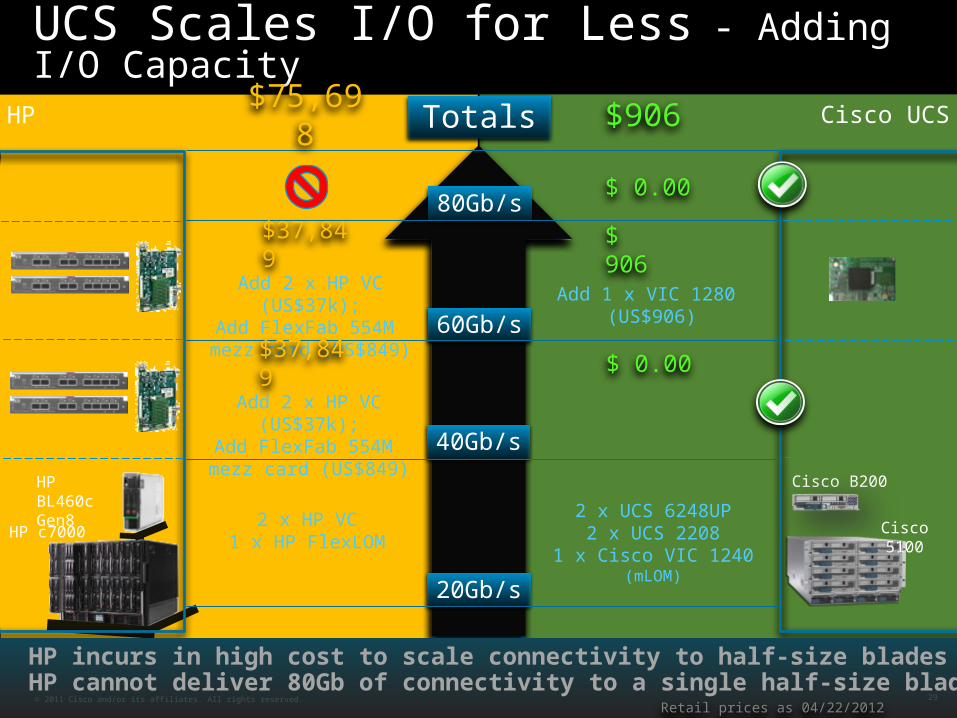
UCS Scales I/O for Less - Adding I/O Capacity
40Gb/s
80Gb/s
60Gb/s
2 x HP VC1 x HP FlexLOM
Add 2 x HP VC (US$37k);Add FlexFab 554M mezz card (US$849)
Add 2 x HP VC (US$37k);Add FlexFab 554M mezz card (US$849)
20Gb/s
Cisco B200 M3
Cisco 5100HP c7000
HP BL460c Gen8
2 x UCS 6248UP2 x UCS 2208
1 x Cisco VIC 1240 (mLOM)
Add 1 x VIC 1280 (US$906)
Totals
$37,849 $ 906
$37,849 $ 0.00
$75,698 $906
$ 0.00
HP incurs in high cost to scale connectivity to half-size bladesHP cannot deliver 80Gb of connectivity to a single half-size blade
Retail prices as 04/22/2012

© 2011 Cisco and/or its affiliates. All rights reserved. 30
Cisco Unified Computing SystemA Differentiated / Revolutionary Approach
Higher PerformanceBrings out the best of Intel Xeon ProcessorsOptimized Resource Utilization for Compute, Networking and Management
No CompromisesNo Trade-offs for FunctionEnhanced Design CapabilityDesigned for the Future, TodayBetter TCO / ROI
Simpler ArchitectureNetworking with fewer componentsLower cost and easier scalingFewer Management Touch Points
Faster, More Flexible Automated Deployment / ProvisioningUnification leads to reduced ComplexityManagement via a single interface
Cisco UCS—Unified Infrastructure, Scalability and Management Automation

© 2011 Cisco and/or its affiliates. All rights reserved. 31
Cisco UCS: Changing the Economics of YOUR Data Center – Customers’ Actual Numbers
IT StaffingDeployment
TimesDisaster
RecoveryPower CoolingTCO / ROI
95% Less Time
90%Faster
Recovery
69% Less Cost
80% Reduction in Support Staff Requirement
30% Less
CapEx;80% lower OpEx
Application Performance
51% - 95%
Faster

© 2011 Cisco and/or its affiliates. All rights reserved. 32
Cisco Unified Computing System (UCS)Changing the Economics of the Data Center
40–50%Maintenance Now
NEW IT Projects – No Additional Budget
Funded Project
Funded Project
Funded Project
TCO/ROI Advisor: http://www.cisco.com/en/US/solutions/ns340/ns517/ns224/tools/data_center_value_zone.html#~Overview
Existing Maintenance
Budget100%

© 2011 Cisco and/or its affiliates. All rights reserved. 33
Cisco Unified Computing SystemBenefits Beyond Efficiency: More Effective IT
Superior price/performance and IT productivity for lower cost of computing
Lower infrastructure cost per serverOperational integration of physical &virtual
Automates IT processes to support any workload in minutes
Consistent, error free alignment of policy, configuration , and workload
Server Innovations
Single UnifiedSystem
UnifiedFabric
Unified Management
IntelligentInfrastructure
Eliminates cost manual integration

© 2011 Cisco and/or its affiliates. All rights reserved. 34
Additional Resources

© 2011 Cisco and/or its affiliates. All rights reserved. 35

© 2011 Cisco and/or its affiliates. All rights reserved. 36
Cisco UCS—White Paper
Available Now on the UCS Business Advantage Solution Pages
http://www.cisco.com/en/US/netsol/ns944/networking_solutions_white_papers_list.html
http://www.cisco.com/en/US/netsol/ns944/index.html#~overview
Network Port Switch Cost Avoidance | $703,462
Power and Cooling Savings | $38,994
End-User Productivity Savings | $28,076
Electric Circuit Cost Avoidance | $42,764
Reduction in Ongoing
Administrative Effort
| $307,076
Refresh Cost Avoidance| $185,663
Data Center Space Cost
Savings| $38,994
Source: Forrester Research;The Total Economic Impact™ of the Cisco Unified Computing System, August 2011
Source: Forrester Research;The Total Economic Impact™ of the Cisco Unified Computing System, August 2011
Cisco UCS Quickly Returns InvestmentThree Year Risk Adjusted Payback Analysis
(Payback in Four Months)
Cisco UCS Benefits CapEx and OpExThree Year Total Benefits Breakdown
(Total = $1,345,029)
($400,000)
($200,000)
$0
$200,000
$400,000
$600,000
$800,000
$1,000,000
$1,200,000
Total Costs Total Benefits Payback
The Total Economic Impact™ of the Cisco Unified Computing System, by Forrester Research

© 2011 Cisco and/or its affiliates. All rights reserved. 37
Cisco UCS
http://www.cisco.com/en/US/solutions/collateral/ns340/ns517/ns224/ns944/business_delivered_cisco_ucs.pdf
http://www.cisco.com/en/US/netsol/ns944/index.html#~overview
Company Cost and Time Savings
MediaPro50% faster to deploy and provision compared to traditional servers
Molina Healthcare
33% reduction in time to deploy new applications
Moses Cone 96 hours saved on server configuration
NetApp10,000 virtual machines deployed in less than one hour
Nighthawk Radiology
15 to 20 minutes to provision servers
Slumberland 74% reduction in time to provision servers
Tele Sisterni Ferroviari
25% savings in new server provisioning costs
Klinikurn Wels-Grieskirchen
80% reduction in management consoles (6:1) for network, applications, and servers
NetApp 99% reduction in management points (204 to 2)
UCS Brochure on the UCS Business Advantage Solution Pages
Business Advantage Delivered: The Cisco Unified Computing System

© 2011 Cisco and/or its affiliates. All rights reserved. 38
UCS Competitive Assets
Title Date Key Headline URL
Cisco UCS TCO / ROI Advisor Q3 FY11Customers can do their own TCO / ROI analysis in 4 to 8 easy steps.
http://www.cisco.com/en/US/solutions/ns340/ns517/ns224/tools/data_center_value_zone.html#~Overview
Total Economic Impact of Cisco UCS
Q4 FY11
Forrester Consulting examines the total economic impact and potential return on investment (ROI) enterprises may realize by deploying Cisco Unified Computing System (UCS). This study provide sreaders with a framework to evaluate the potential financial impact of Cisco UCS ontheir organizations.
http://www.cisco.com/en/US/solutions/collateral/ns340/ns517/ns224/ns944/total_economic_impact_forrester_research.pdf
Data Center Capacity Planning and Refresh: Cisco UCS Business Advantage Delivered
Q1FY12
Deployment of Cisco UCS systems enables data centers to reap the benefits of a simplified infrastructure. By consolidating from a large-footprint rack or complex and network-intensive blade environment to Cisco UCS, IT organizations can reduce the footprint and complexity of the entire datacenter.
http://www.cisco.com/en/US/solutions/collateral/ns340/ns517/ns224/ns944/dc_capacity_planning_ucs_business_delivered.pdf
Business Advantage Delivered - The Cisco Unified Computing System
Q3 FY11
The business advantage of Cisco UCS derives from the system’s simplified, converged architecture combined with its centralized management. Cisco UCS has fewer components to purchase, configure, manage, maintain, power, and cool, with more efficient scaling, resulting in total cost of ownership (TCO) savings across the entire data center.
http://www.cisco.com/en/US/solutions/collateral/ns340/ns517/ns224/ns944/business_delivered_cisco_ucs.pdf
Data Center Management: Cisco UCS Business Advantage Delivered
Q4 FY12Cisco Unified Computing System™ (Cisco UCS™) simplifies management with fewer touch points, reducing administrative and operating costs and improves efficiency and resource delivery
http://www.cisco.com/en/US/solutions/collateral/ns340/ns517/ns224/ns944/DC_mgmt_UCS_busAdv_delivered.pdf
UCS for Less: UCS vs. HP – a TCO Compare
Q2 FY12
Save up to 38% with a UCS Solution vs. HP . Visit www.cisco.com/go/getucs to do your own TCO analysis and view a side by side, line item comparison between comparable Cisco UCS and HP c7000 blade server solutions.
http://www.cisco.com/web/solutions/data_center/next_gen_tech.html

© 2011 Cisco and/or its affiliates. All rights reserved. 39
UCS Competitive Assets
Title Date Key Headline URL
Cisco UCS vs. HP for energy and management Q3 FY11
A commissioned report from Enterprise Management Associates (EMA) that studies how Cisco UCS's management capabilities and Unified Computing System are key, to effective and efficient server power savings and increased data center capacity compared to HP BladeSystem.
http://www.cisco.com/en/US/solutions/collateral/ns340/ns517/ns224/ns944/ema_cisco_data_centermgmt0610.PDF
Cisco UCS - A Real World TCO Analysis Q3 FY11
EMA analyzed the business value realized by a large number of Cisco customers and found that Cisco customers that choose to invest in UCS stand an excellent chance of extracting significant, quantifiable business value within a relatively short period of time while increasing overall responsiveness, performance, business agility and availability of critical business applications.
http://www.cisco.com/en/US/solutions/collateral/ns340/ns517/ns224/ns944/cisco_ucs_areal_world_tco_analysis.pdf
UCS VDI: Scaling Without Sacrifice Q3 FY11
Partner with Intel, Citrix and NetApp; Organizations deploying a desktop virtualization solution benefit by using servers that support many users and properly scale with additional servers. A single Cisco UCS B250 M2 Extended Memory Blade Server running Citrix XenDesktop® 4 with Citrix XenServer 5.6 supported 112 MS Win 7 virtual desktops and scaled perfectly, without sacrificing performance, supporting 784 virtual desktops when adding six more blades as measured by Login VSI Beta3 parameters.
http://www.cisco.com/en/US/solutions/collateral/ns340/ns517/ns224/ns944/ucs_vdi_scaling_without_sacrifice.pdf
VDI Perfromance Comparison UCS B250 M2 vs. HP BL460C G7
Q3 FY11
Using LoginVSI Beta3 benchmark with Citrix XenDesktop 4 and XenServer 5.6 on NetApp storage, Cisco Unified Computing System B250 M2 supported 112 virtual desktops with 2GB memory vs. 93 for the HP BL460c G7. The UCS B250 M2 delivered 20.4% more virtual desktops per blade than the HP solution.
http://www.cisco.com/en/US/solutions/collateral/ns340/ns517/ns224/ns944/Vdi_Performance_Comparision.pdf
UCS B250 M2 Deploy 47% Faster vs. HP BL460C G7 Q3 FY11
Head to Head, Cisco UCS with UCS Manager deploys blades 47% faster that HP Virtual Connect Enterprise Manager (and FlexFabric), with 67% fewer steps.
http://www.cisco.com/en/US/solutions/collateral/ns340/ns517/ns224/ns944/ucs_vs_hp_deployment.pdf
UCS B250 M2 Deploy 47% Faster vs. HP BL460C G7 - VIDEO
Q3 FY11VIDEO: Head to Head, Cisco UCS with UCS Manager deploys blades 47% faster that HP Virtual Connect Enterprise Manager (and FlexFabric), with 67% fewer
http://www.youtube.com/watch?v=nijWlNzSgCQ


![Zggh]hPH>new.groteck.ru/images/catalog/40429/9deec18637ee6ecbb5a6ae0a1… · UCS 6200 Series Fabric Interconnect UCS Manager UCS C240 M3/M4 Series Rack Server UCS Integrated Infrastructure](https://img.pdfslide.us/doc/110x75/5fcc7e22130a463bbb0b3c57/zgghhphnew-ucs-6200-series-fabric-interconnect-ucs-manager-ucs-c240-m3m4.jpg)