Embed Size (px)
Citation preview

Carrier billing in 2016: Latin AmericaMarket report by Fortumo

IntroductionThis white paper gives an overview of the mobile payments landscape in Latin America. It covers 10 of the biggest countries in the region by population where Fortumo has coverage: Brazil, Mexico, Colombia, Argentina, Peru, Venezuela, Chile, Guatemala, Ecuador and Dominican Republic.
Carrier billing in 2016: Latin America
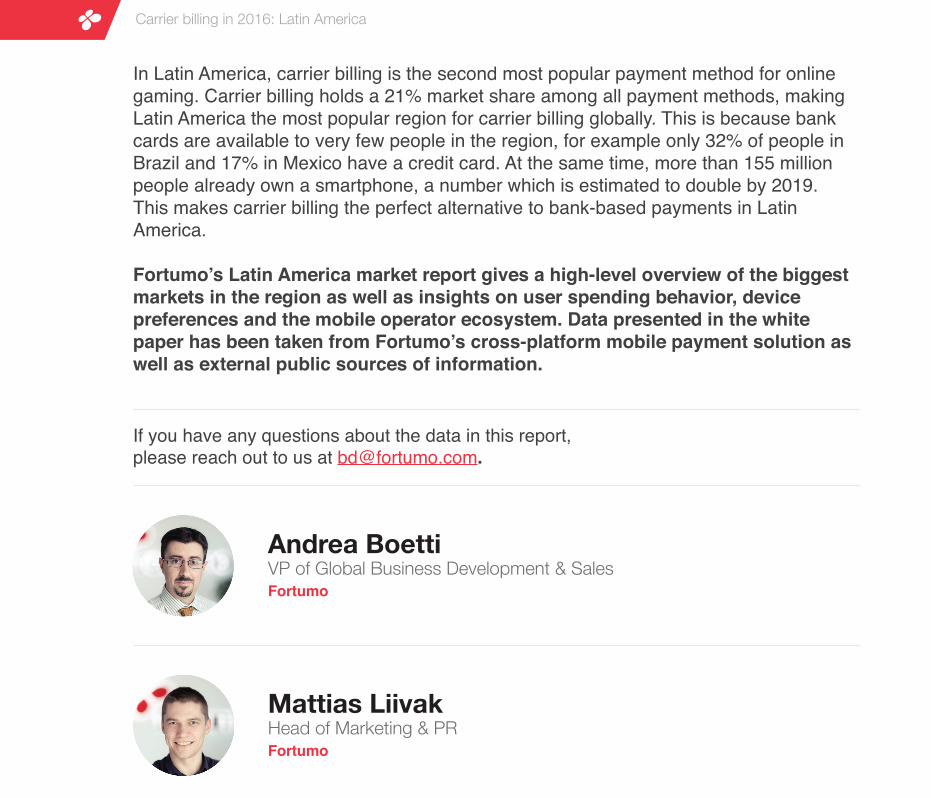
In Latin America, carrier billing is the second most popular payment method for online gaming. Carrier billing holds a 21% market share among all payment methods, making Latin America the most popular region for carrier billing globally. This is because bank cards are available to very few people in the region, for example only 32% of people in Brazil and 17% in Mexico have a credit card. At the same time, more than 155 million people already own a smartphone, a number which is estimated to double by 2019. This makes carrier billing the perfect alternative to bank-based payments in Latin America.
Fortumo’s Latin America market report gives a high-level overview of the biggest markets in the region as well as insights on user spending behavior, device preferences and the mobile operator ecosystem. Data presented in the white paper has been taken from Fortumo’s cross-platform mobile payment solution as well as external public sources of information.
Andrea BoettiVP of Global Business Development & SalesFortumo
Mattias LiivakHead of Marketing & PRFortumo
If you have any questions about the data in this report, please reach out to us at [email protected].
Carrier billing in 2016: Latin America

BrazilMarket profile
Gross National Income (GNI)per capita (IMF 2014 estimate):
Median age:
30.7 years
55%
209 million
Smartphone penetration (of all mobile phones):
Population:
$12,000
209 million
Mobile broadband access:
Prepaid SIM market share:Credit & debit card penetration:
32% / 59%
73%
74%
Mobile users:
Currency: 1 Brazilian Real (BRL) = $0.28 (exchange rate as of April 27th, 2016)
Important note: Brazilian Real has been significantly weakening against the USD, also impacting data on Brazil in this report.
Carrier billing in 2016: Latin America
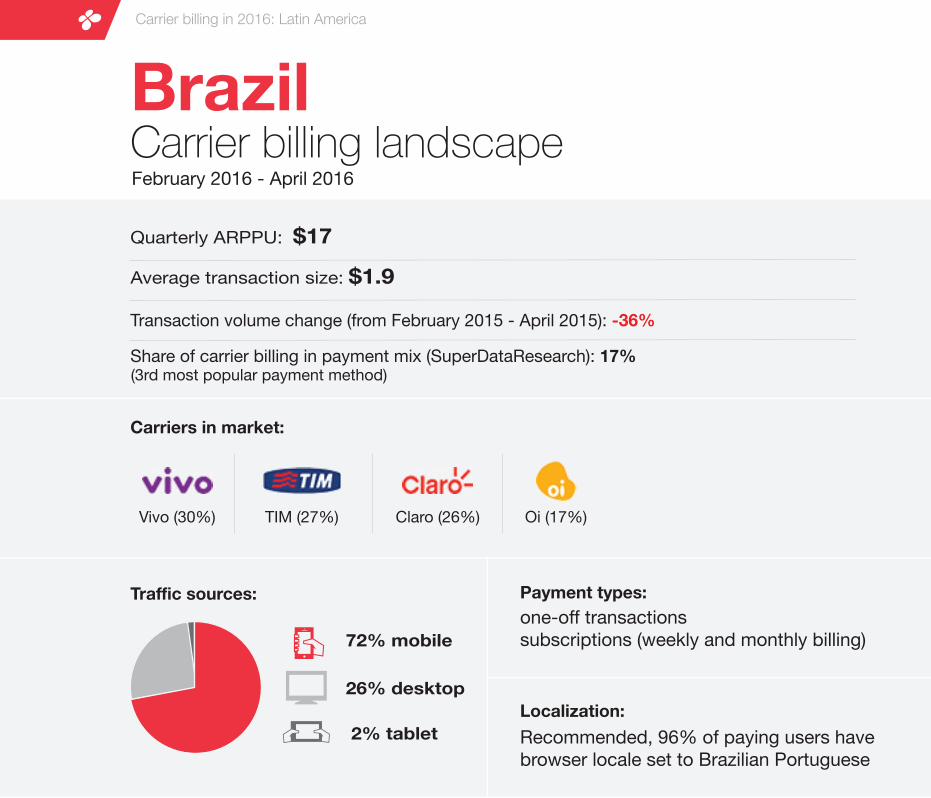
Share of carrier billing in payment mix (SuperDataResearch): 17%
Carriers in market:
Payment types:
Localization:
BrazilCarrier billing landscapeFebruary 2016 - April 2016
Quarterly ARPPU: $17
one-off transactionssubscriptions (weekly and monthly billing)
Vivo (30%) TIM (27%) Claro (26%) Oi (17%)
Average transaction size: $1.9
Traffic sources:
72% mobile
26% desktop
2% tablet Recommended, 96% of paying users have browser locale set to Brazilian Portuguese
Transaction volume change (from February 2015 - April 2015): -36%
(3rd most popular payment method)
Carrier billing in 2016: Latin America
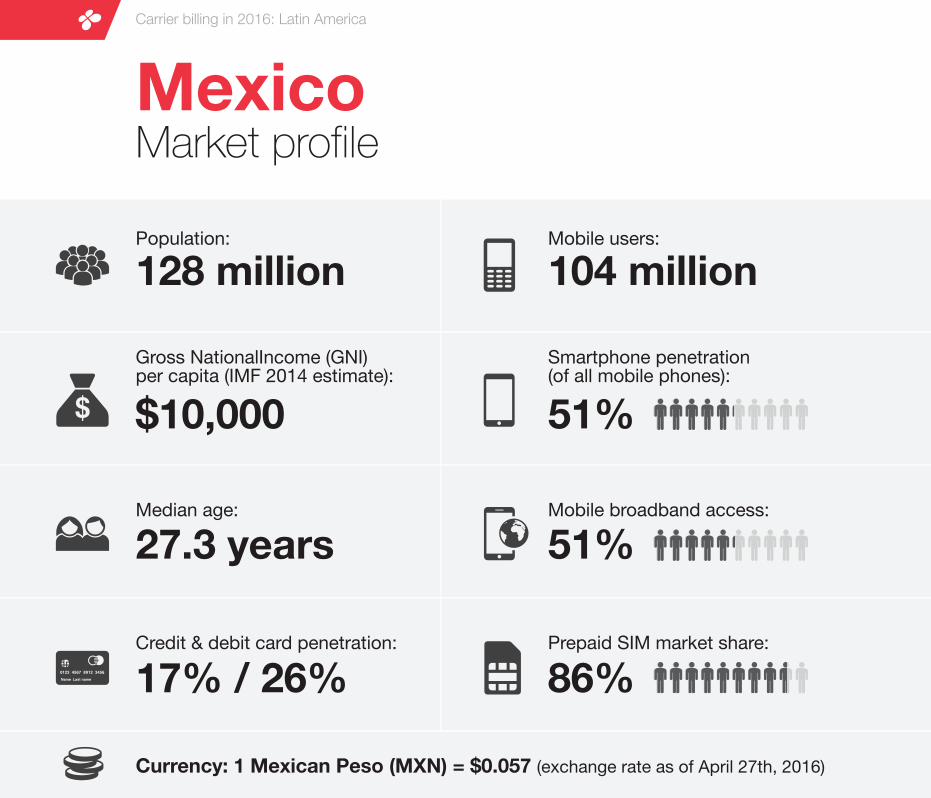
MexicoMarket profile
Carrier billing in 2016: Latin America
Gross NationalIncome (GNI)per capita (IMF 2014 estimate):
Median age:
27.3 years
51%
128 million
Smartphone penetration (of all mobile phones):
Population:
$10,000
104 million
Mobile broadband access:
Prepaid SIM market share:Credit & debit card penetration:
17% / 26%
51%
86%
Mobile users:
Currency: 1 Mexican Peso (MXN) = $0.057 (exchange rate as of April 27th, 2016)
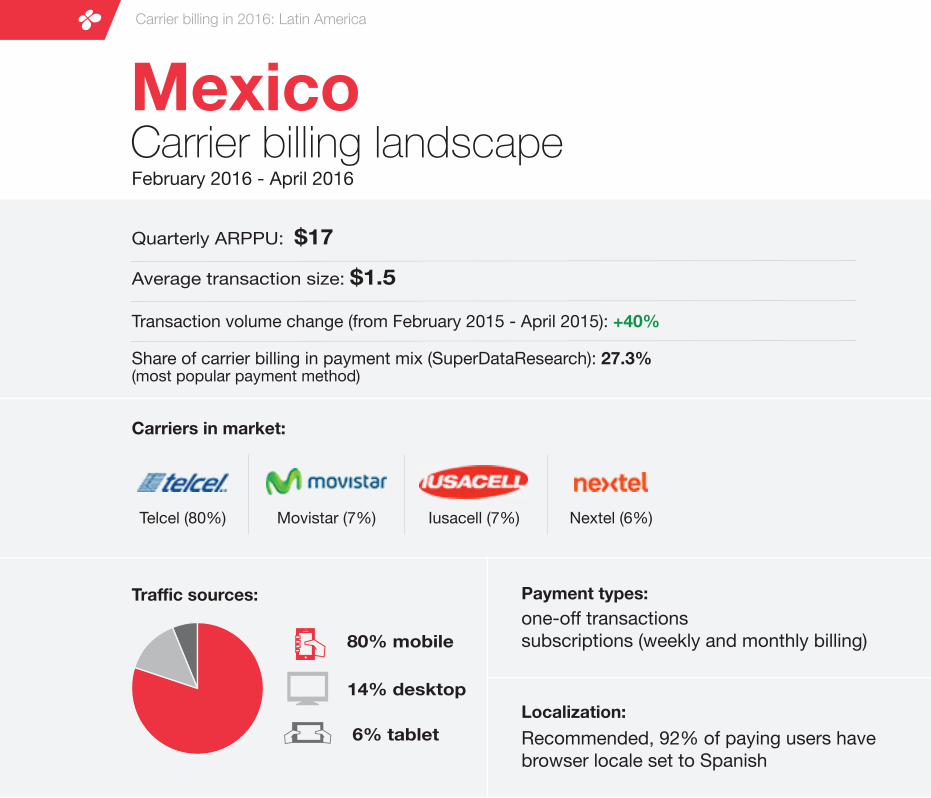
MexicoCarrier billing landscapeFebruary 2016 - April 2016
Carrier billing in 2016: Latin America
Share of carrier billing in payment mix (SuperDataResearch): 27.3%
Carriers in market:
Payment types:
Localization:
Quarterly ARPPU: $17
one-off transactionssubscriptions (weekly and monthly billing)
Telcel (80%) Movistar (7%) Iusacell (7%) Nextel (6%)
Average transaction size: $1.5
Traffic sources:
80% mobile
14% desktop
6% tablet Recommended, 92% of paying users have browser locale set to Spanish
Transaction volume change (from February 2015 - April 2015): +40%
(most popular payment method)
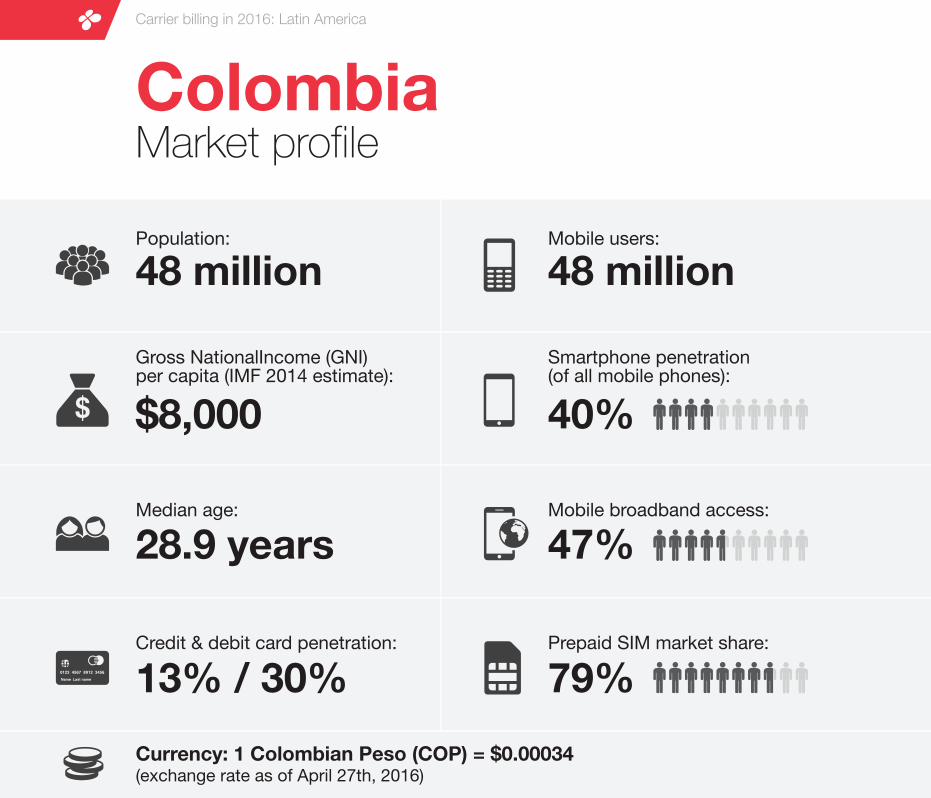
ColombiaMarket profile
Carrier billing in 2016: Latin America
Gross NationalIncome (GNI)per capita (IMF 2014 estimate):
Median age:
28.9 years
40%
48 million
Smartphone penetration (of all mobile phones):
Population:
$8,000
48 million
Mobile broadband access:
Prepaid SIM market share:Credit & debit card penetration:
13% / 30%
47%
79%
Mobile users:
Currency: 1 Colombian Peso (COP) = $0.00034 (exchange rate as of April 27th, 2016)
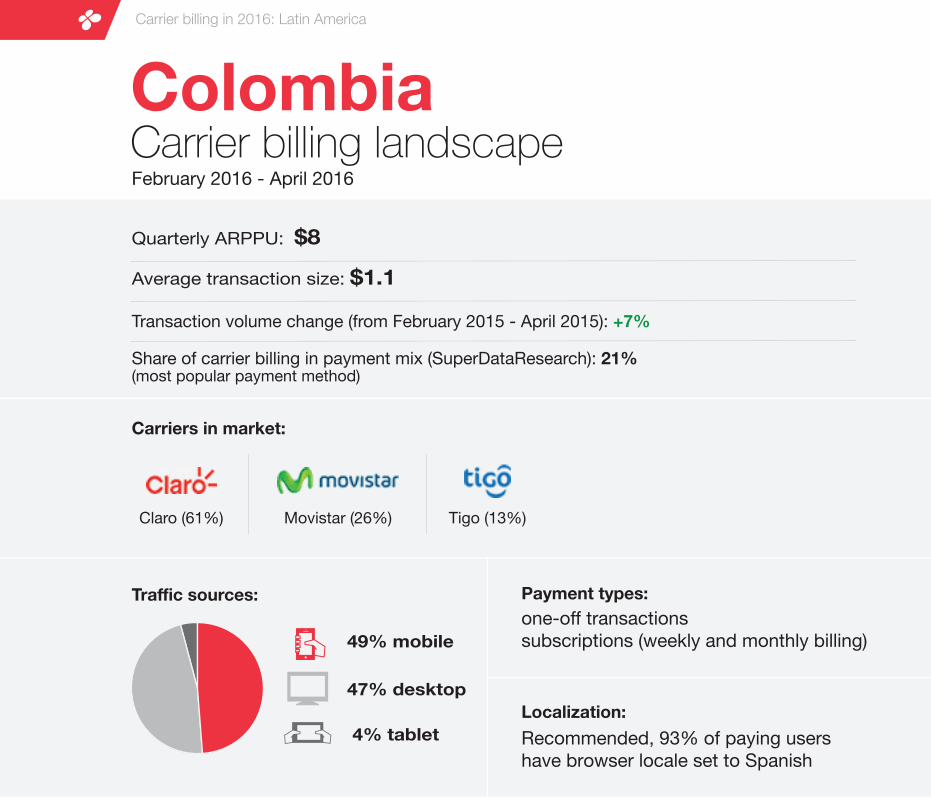
ColombiaCarrier billing landscapeFebruary 2016 - April 2016
Share of carrier billing in payment mix (SuperDataResearch): 21%(most popular payment method)
Carriers in market:
Quarterly ARPPU: $8
Claro (61%) Movistar (26%) Tigo (13%)
Average transaction size: $1.1
Traffic sources:
49% mobile
47% desktop
4% tablet
Payment types: one-off transactionssubscriptions (weekly and monthly billing)
Localization:Recommended, 93% of paying users have browser locale set to Spanish
Transaction volume change (from February 2015 - April 2015): +7%
Carrier billing in 2016: Latin America

ArgentinaMarket profile
Carrier billing in 2016: Latin America
Gross NationalIncome (GNI)per capita (IMF 2014 estimate):
Median age:
31.2 years
40%
44 million
Smartphone penetration (of all mobile phones):
Population:
$13,000
44 million
Mobile broadband access:
Prepaid SIM market share:Credit & debit card penetration:
26% / 44%
47%
74%
Mobile users:
Currency: 1 Argentine Peso (ARS) = $0.07(exchange rate as of April 27th, 2016)

ArgentinaCarrier billing landscapeFebruary 2016 - April 2016
Carrier billing in 2016: Latin America
Share of carrier billing in payment mix (SuperDataResearch): 18.1%
Carriers in market:
Payment types:
Localization:
Quarterly ARPPU: $5
one-off transactionssubscriptions (weekly and monthly billing)
Claro (35%) Personal (32%) Movistar (31%) Nextel (2%)
Average transaction size: $0.8
Traffic sources:
46% mobile
51% desktop
3% tablet Recommended, 97% of paying users have browser locale set to Spanish
Transaction volume change (from February 2015 - April 2015): +18%
(4th most popular payment method)
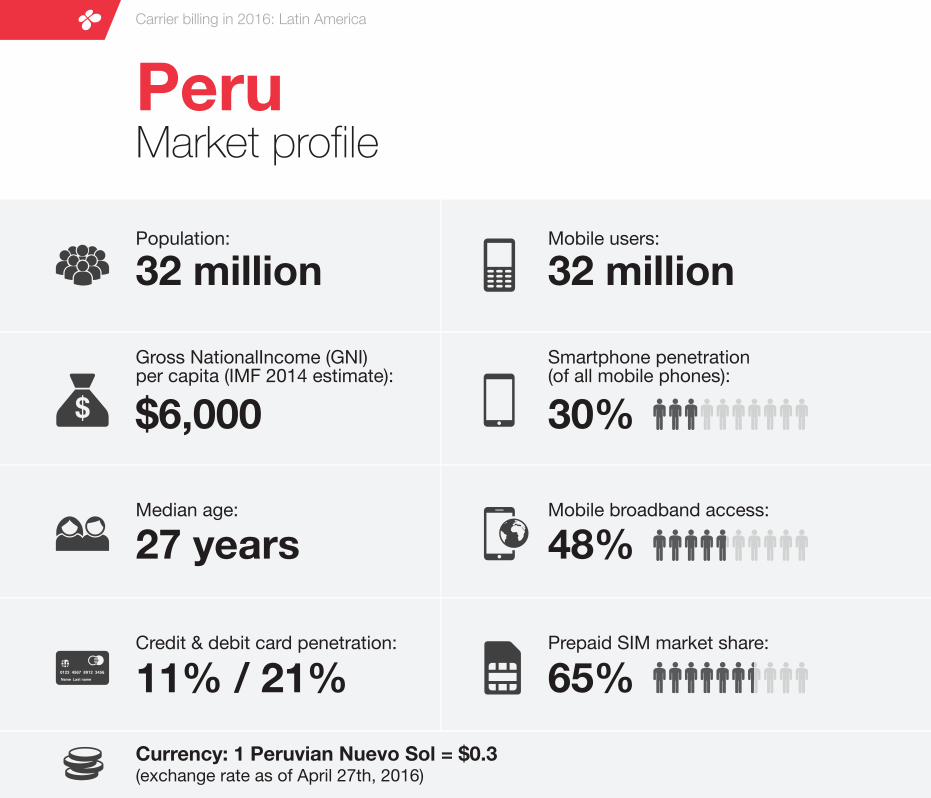
PeruMarket profile
Carrier billing in 2016: Latin America
Gross NationalIncome (GNI)per capita (IMF 2014 estimate):
Median age:
27 years
30%
32 million
Smartphone penetration (of all mobile phones):
Population:
$6,000
32 million
Mobile broadband access:
Prepaid SIM market share:Credit & debit card penetration:
11% / 21%
48%
65%
Mobile users:
Currency: 1 Peruvian Nuevo Sol = $0.3(exchange rate as of April 27th, 2016)
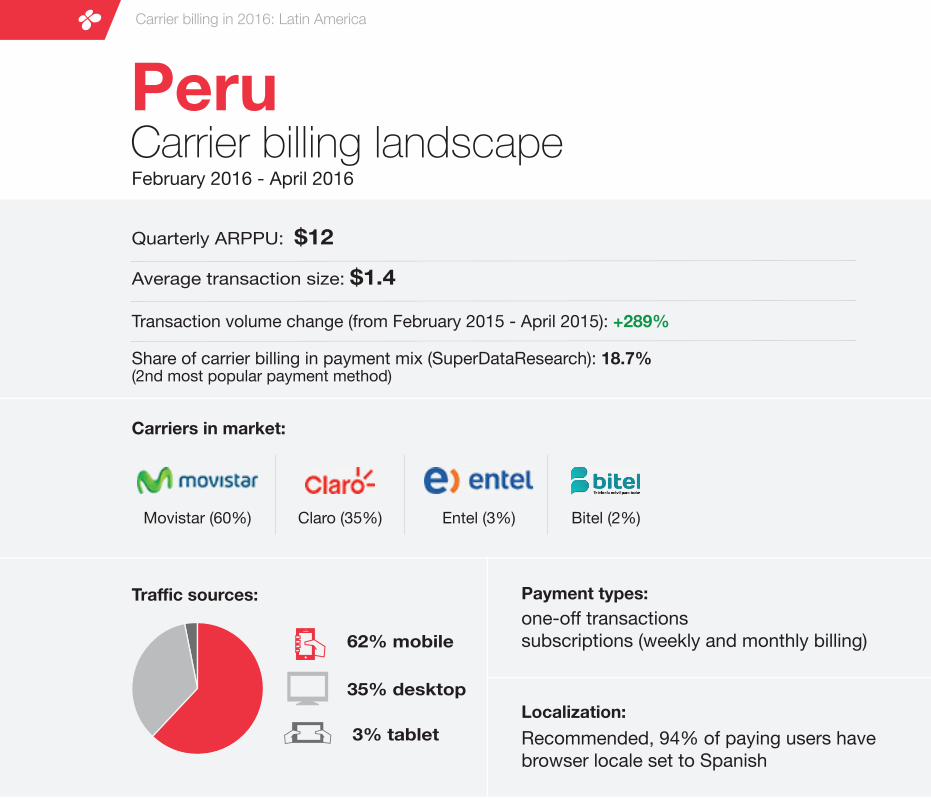
PeruCarrier billing landscapeFebruary 2016 - April 2016
Carrier billing in 2016: Latin America
Share of carrier billing in payment mix (SuperDataResearch): 18.7%
Carriers in market:
Payment types:
Localization:
Quarterly ARPPU: $12
one-off transactionssubscriptions (weekly and monthly billing)
Movistar (60%) Claro (35%) Entel (3%) Bitel (2%)
Average transaction size: $1.4
Traffic sources:
62% mobile
35% desktop
3% tablet Recommended, 94% of paying users have browser locale set to Spanish
Transaction volume change (from February 2015 - April 2015): +289%
(2nd most popular payment method)

VenezuelaMarket profile
Carrier billing in 2016: Latin America
Gross NationalIncome (GNI)per capita (IMF 2014 estimate):
Median age:
26.9 years
57%
31 million
Smartphone penetration (of all mobile phones):
Population:
$13,000
31 million
Mobile broadband access:
Prepaid SIM market share:Credit & debit card penetration:
21% / 49%
45%
88%
Mobile users:
Currency: 1 Venezuelan Bolivar = $0.1(exchange rate as of April 27th, 2016)
Important note: Merchants should keep in mind that Venezuelan bolivar is an extremely unstable currency which also impacts end-user prices and payouts.

VenezuelaCarrier billing landscapeFebruary 2016 - April 2016
Carrier billing in 2016: Latin America
Share of carrier billing in payment mix (SuperDataResearch): 25%
Carriers in market:
Payment types:
Localization:
Quarterly ARPPU: $0.2
one-off transactionssubscriptions (weekly and monthly billing)
Movistar (40%) Movilnet (30%) Digitel (30%)
Average transaction size: $0.02
Traffic sources:
19% mobile
79% desktop
2% tablet Recommended, 95% of paying users have browser locale set to Spanish
Transaction volume change (from February 2015 - April 2015): -6%
(most popular payment method)

ChileMarket profile
Carrier billing in 2016: Latin America
Gross NationalIncome (GNI)per capita (IMF 2014 estimate):
Median age:
33.3 years
40%
18 million
Smartphone penetration (of all mobile phones):
Population:
$15,000
18 million
Mobile broadband access:
Prepaid SIM market share:Credit & debit card penetration:
28% / 54%
57%
71%
Mobile users:
Currency: 1 Chilean Peso (CLP) = $0.0015(exchange rate as of April 27th, 2016)
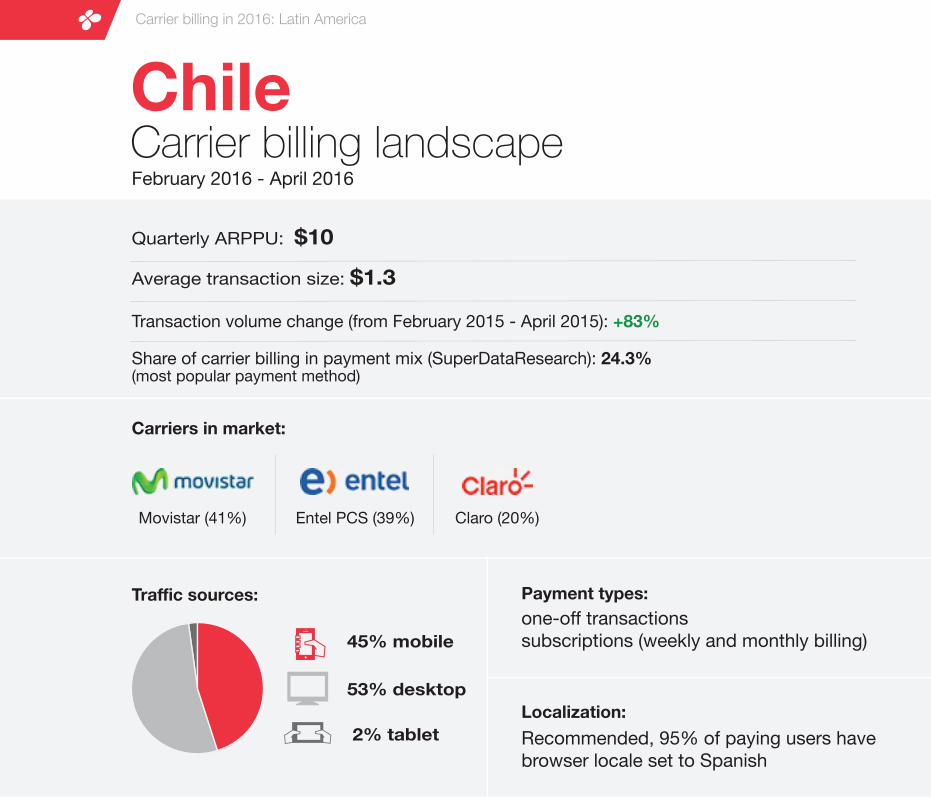
ChileCarrier billing landscapeFebruary 2016 - April 2016
Carrier billing in 2016: Latin America
Share of carrier billing in payment mix (SuperDataResearch): 24.3%
Carriers in market:
Payment types:
Localization:
Quarterly ARPPU: $10
one-off transactionssubscriptions (weekly and monthly billing)
Movistar (41%) Entel PCS (39%) Claro (20%)
Average transaction size: $1.3
Traffic sources:
45% mobile
53% desktop
2% tablet Recommended, 95% of paying users have browser locale set to Spanish
Transaction volume change (from February 2015 - April 2015): +83%
(most popular payment method)
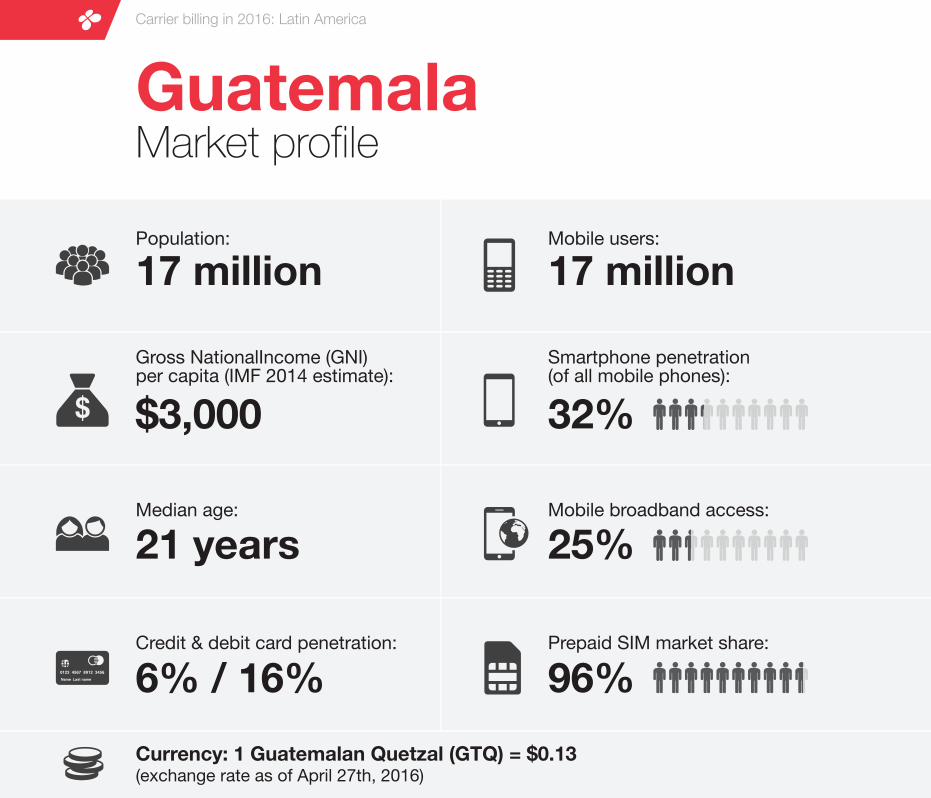
GuatemalaMarket profile
Carrier billing in 2016: Latin America
Gross NationalIncome (GNI)per capita (IMF 2014 estimate):
Median age:
21 years
32%
17 million
Smartphone penetration (of all mobile phones):
Population:
$3,000
17 million
Mobile broadband access:
Prepaid SIM market share:Credit & debit card penetration:
6% / 16%
25%
96%
Mobile users:
Currency: 1 Guatemalan Quetzal (GTQ) = $0.13 (exchange rate as of April 27th, 2016)

GuatemalaCarrier billing landscapeFebruary 2016 - April 2016
Carrier billing in 2016: Latin America
Carriers in market:
Payment types:
Localization:
Quarterly ARPPU: $7
one-off transactionssubscriptions (weekly and monthly billing)
Claro (37%) Tigo (35%) Movistar (28%)
Average transaction size: $1.2
Traffic sources:
98% mobile
0% desktop
2% tablet Recommended, 92% of paying users have browser locale set to Spanish
Transaction volume change (from February 2015 - April 2015): +31%

EcuadorMarket profile
Carrier billing in 2016: Latin America
Gross NationalIncome (GNI)per capita (IMF 2014 estimate):
Median age:
26.7 years
42%
16 million
Smartphone penetration (of all mobile phones):
Population:
$6,000
13 million
Mobile broadband access:
Prepaid SIM market share:Credit & debit card penetration:
5% / 25%
25%
72%
Mobile users:
Currency: USD(exchange rate as of April 27th, 2016)
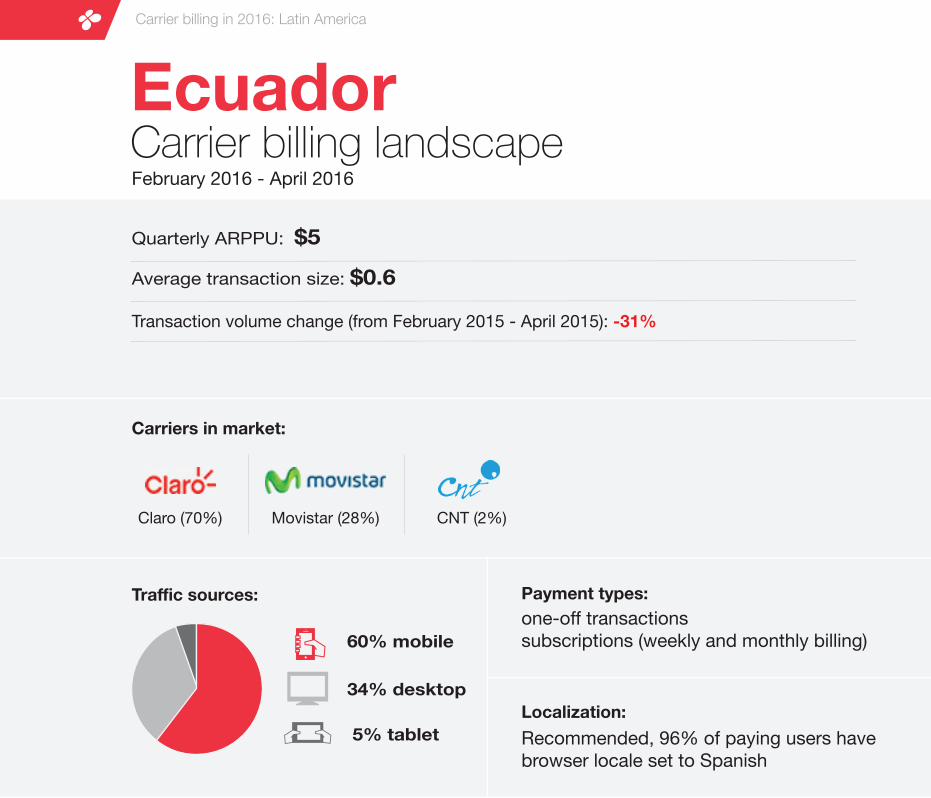
EcuadorCarrier billing landscapeFebruary 2016 - April 2016
Carrier billing in 2016: Latin America
Carriers in market:
Payment types:
Localization:
Quarterly ARPPU: $5
one-off transactionssubscriptions (weekly and monthly billing)
Claro (70%) Movistar (28%) CNT (2%)
Average transaction size: $0.6
Traffic sources:
60% mobile
34% desktop
5% tablet Recommended, 96% of paying users have browser locale set to Spanish
Transaction volume change (from February 2015 - April 2015): -31%
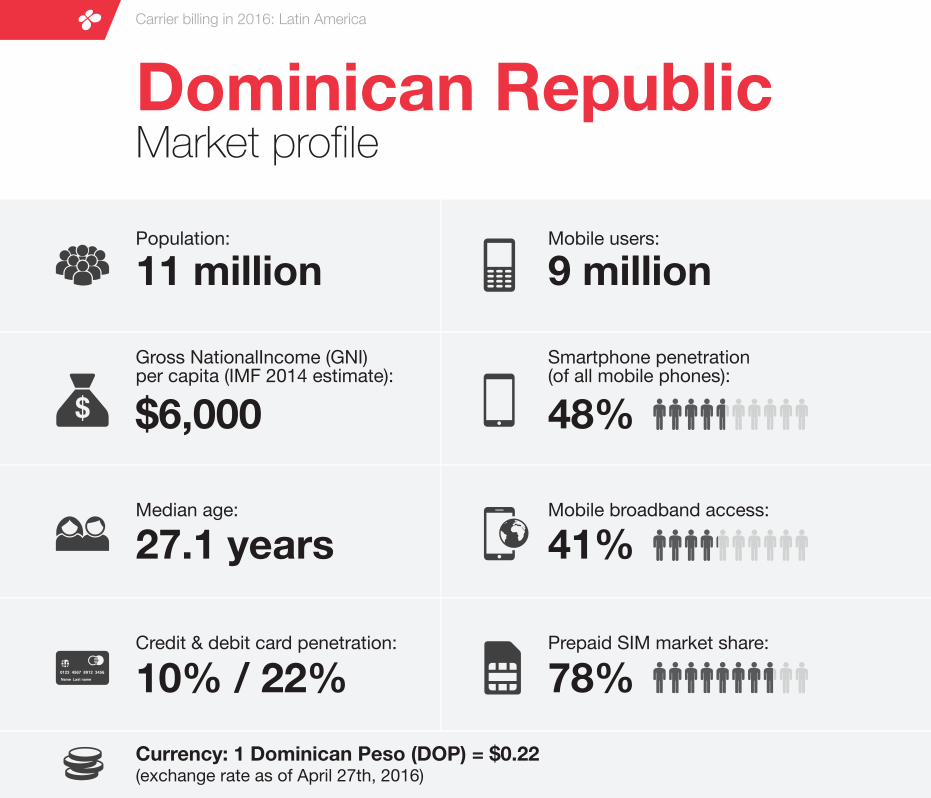
Dominican RepublicMarket profile
Carrier billing in 2016: Latin America
Gross NationalIncome (GNI)per capita (IMF 2014 estimate):
Median age:
27.1 years
48%
11 million
Smartphone penetration (of all mobile phones):
Population:
$6,000
9 million
Mobile broadband access:
Prepaid SIM market share:Credit & debit card penetration:
10% / 22%
41%
78%
Mobile users:
Currency: 1 Dominican Peso (DOP) = $0.22(exchange rate as of April 27th, 2016)
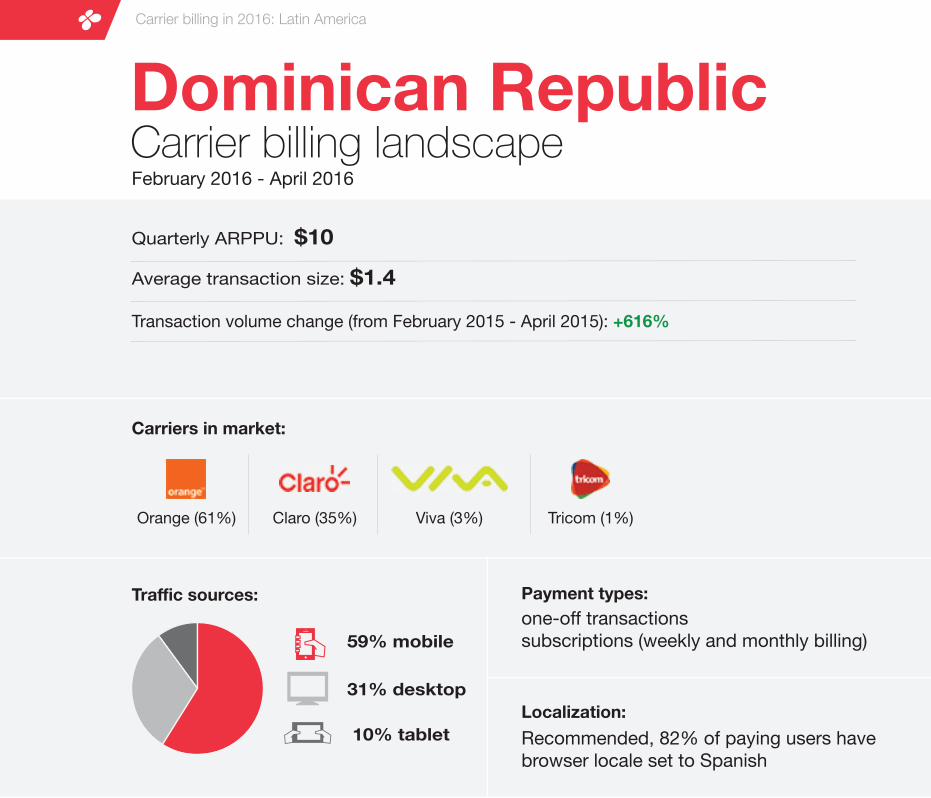
Dominican RepublicCarrier billing landscapeFebruary 2016 - April 2016
Carrier billing in 2016: Latin America
Carriers in market:
Payment types:
Localization:
Quarterly ARPPU: $10
one-off transactionssubscriptions (weekly and monthly billing)
Orange (61%) Claro (35%) Viva (3%) Tricom (1%)
Average transaction size: $1.4
Traffic sources:
59% mobile
31% desktop
10% tablet Recommended, 82% of paying users have browser locale set to Spanish
Transaction volume change (from February 2015 - April 2015): +616%
Additional readingCarrier billing in 2016: Latin America
Report: India & Vietnam drive carrier billing growth in Q1 2016
Read now
Subscriptions and carrier billing: download our free white paper
Read now
Free market report: carrier billing in Central & Eastern Europe
Read now
https://fortumo.comhttps://facebook.com/fortumohttps://twitter.com/fortumohttps://www.linkedin.com/company/fortumo-ltd.
Fortumo is a mobile payments company that enables direct carrier billing with more than 350 mobile operators in 90+ countries. Fortumo's payment products work across a wide range of platforms including desktop devices, smartphones, feature phones, tablets and smart TV-s. These products give consumers a simple, 1-click payment method to charge online purchases to their phone bill. For app stores, digital media companies and game developers, Fortumo provides one integration with 350 mobile operators as well as a single point of contact for settlements, reporting, support and infrastructure upgrades. Founded in 2007, Fortumo has offices in Estonia, San Francisco, Beijing, Delhi, Mumbai, Singapore and London and is backed by Intel Capital and Greycroft Partners.
This document is for informational purposes only. Fortumo and the authors make no expressed or implied warranties in this document. Fortumo and the author(s) make no representation or warranty in relation to the accuracy, completeness or reliability of the information contained in this document. Any opinions expressed in this document are subject to change without notice. This document may be based on a number of assumptions and different assumptions could result in materially different results. This document should not be regarded by recipients as a substitute for obtaining independent advice and/or the exercise of their own judgement, and is not to be relied upon by recipients. Fortumo and the authors, and any of their members, directors, employees or agents do not accept any liability for any loss or damage arising out of the use of all or any part of this document. Copyright © 2016 Fortumo | All rights reserved.


![Direct Carrier Billing - MarketResearch.com: Market ... · Direct carrier billing: giving CSPs a share of the mobile payments market Executive summary [1] Direct carrier billing (DCB)](https://img.pdfslide.us/doc/110x75/5f01ee857e708231d401be76/direct-carrier-billing-market-direct-carrier-billing-giving-csps-a-share.jpg)