Embed Size (px)
Citation preview

Brendan Gregg Senior Performance Architect
27 Feb 2017
image:h)p://makeitstranger.com

Observability

Best Possible Performance &
Root Cause Analysis

Needed: Observe Everything In Production Quickly


Enhanced BPF is in Linux

Linux4.3
Linux4.7 Linux4.9
Linux4.9
Linux4.1
BPFstacksLinux4.6
BPFoutputLinux4.4
VersionBPFsupportarrived

How do we use these superpowers?
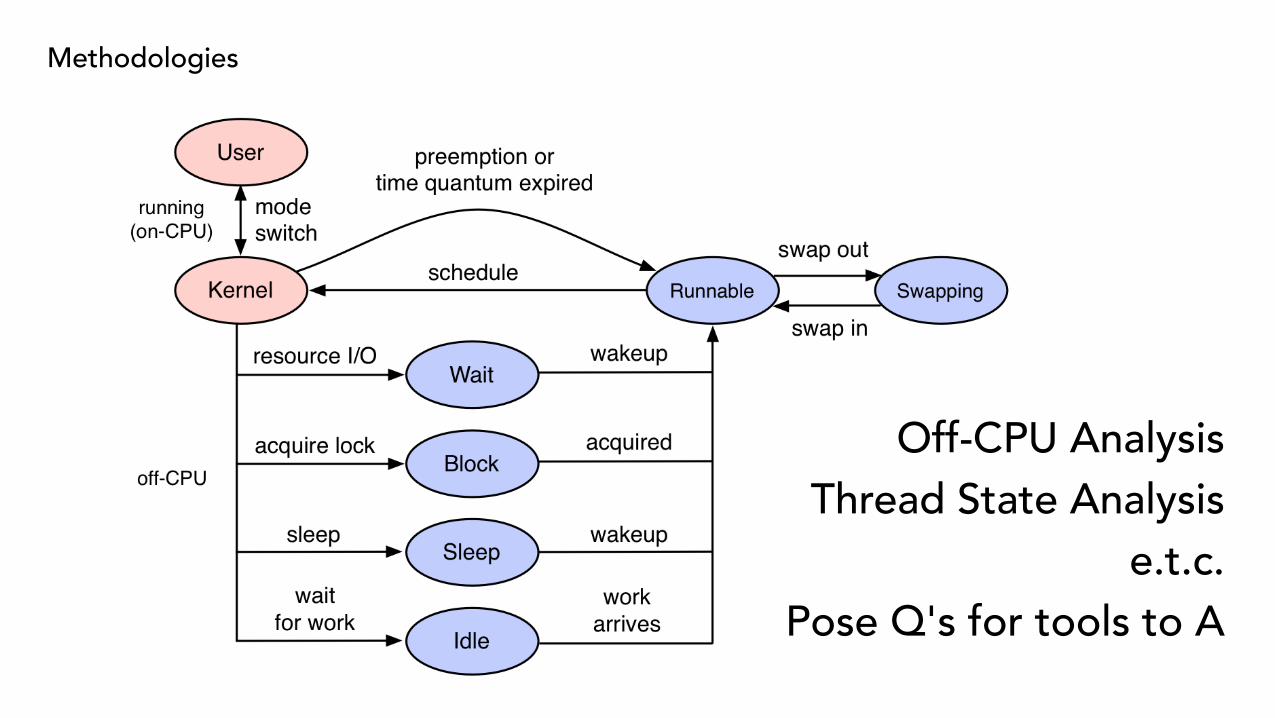
Off-CPU Analysis Thread State Analysis
e.t.c. Pose Q's for tools to A
Methodologies

Current Tools

bcc: BPF Compiler Collection https://github.com/iovisor/bcc


Single Purpose Tools Multi-Tools

Single purpose vs Multi-tools
# opensnoop PID COMM FD ERR PATH10085 sshd 3 0 /lib/x86_64-linux-gnu/libresolv.so.210085 sshd 3 0 /lib/x86_64-linux-gnu/libgpg-error.so.010085 sshd 3 0 /dev/urandom10085 sshd -1 2 /lib/x86_64-linux-gnu/.libcrypto.so.1.0.0.hmac10085 sshd -1 2 /proc/sys/crypto/fips_enabled
# trace 'do_sys_open "%s", arg2' 'r::do_sys_open "ret:%d", retval'PID TID COMM FUNC -1651 1651 redis-server do_sys_open /proc/1651/stat1968 1968 redis-server do_sys_open /proc/1968/stat1651 1651 redis-server do_sys_open ret:51968 1968 redis-server do_sys_open ret:52218 2218 snmp-pass do_sys_open /proc/cpuinfo2218 2218 snmp-pass do_sys_open ret:42218 2218 snmp-pass do_sys_open /proc/stat2218 2218 snmp-pass do_sys_open ret:4

Single purpose tool usage
# biolatency -husage: biolatency [-h] [-T] [-Q] [-m] [-D] [interval] [count]
Summarize block device I/O latency as a histogram
positional arguments: interval output interval, in seconds count number of outputs
optional arguments: -h, --help show this help message and exit -T, --timestamp include timestamp on output -Q, --queued include OS queued time in I/O time -m, --milliseconds millisecond histogram -D, --disks print a histogram per disk device
examples: ./biolatency # summarize block I/O latency as a histogram[...]

CLI Tool Design

Template 1: Per Event Output
# opensnoop PID COMM FD ERR PATH10085 sshd 3 0 /lib/x86_64-linux-gnu/libkeyutils.so.110085 sshd 3 0 /lib/x86_64-linux-gnu/libresolv.so.210085 sshd 3 0 /lib/x86_64-linux-gnu/libgpg-error.so.010085 sshd 3 0 /dev/urandom10085 sshd -1 2 /lib/x86_64-linux-gnu/.libcrypto.so.1.0.0.hmac10085 sshd -1 2 /proc/sys/crypto/fips_enabled10085 sshd 3 0 /proc/filesystems10085 sshd 3 0 /dev/null10085 sshd 3 0 /proc/10085/fd10085 sshd 3 0 /usr/lib/ssl/openssl.cnf10085 sshd 3 0 /etc/gai.conf10085 sshd 3 0 /etc/nsswitch.conf10085 sshd 3 0 /etc/ld.so.cache10085 sshd 3 0 /lib/x86_64-linux-gnu/libnss_compat.so.210085 sshd 3 0 /etc/ld.so.cache10085 sshd 3 0 /lib/x86_64-linux-gnu/libnss_nis.so.2[…]

Template 2: Filtered Event Output
# ext4slower 1Tracing ext4 operations slower than 1 msTIME COMM PID T BYTES OFF_KB LAT(ms) FILENAME06:49:17 bash 3616 R 128 0 7.75 cksum06:49:17 cksum 3616 R 39552 0 1.34 [06:49:17 cksum 3616 R 96 0 5.36 2to3-2.706:49:17 cksum 3616 R 96 0 14.94 2to3-3.406:49:17 cksum 3616 R 10320 0 6.82 411toppm06:49:17 cksum 3616 R 65536 0 4.01 a2p06:49:17 cksum 3616 R 55400 0 8.77 ab06:49:17 cksum 3616 R 36792 0 16.34 aclocal-1.1406:49:17 cksum 3616 R 15008 0 19.31 acpi_listen06:49:17 cksum 3616 R 6123 0 17.23 add-apt-repository06:49:17 cksum 3616 R 6280 0 18.40 addpart06:49:17 cksum 3616 R 27696 0 2.16 addr2line06:49:17 cksum 3616 R 58080 0 10.11 ag06:49:17 cksum 3616 R 906 0 6.30 ec2-meta-data06:49:17 cksum 3616 R 6320 0 10.00 animate.im6[…]

Template 3: Interval Summary
# dcstat TIME REFS/s SLOW/s MISS/s HIT%08:11:47: 2059 141 97 95.2908:11:48: 79974 151 106 99.8708:11:49: 192874 146 102 99.9508:11:50: 2051 144 100 95.1208:11:51: 73373 17239 17194 76.5708:11:52: 54685 25431 25387 53.5808:11:53: 18127 8182 8137 55.1208:11:54: 22517 10345 10301 54.2508:11:55: 7524 2881 2836 62.3108:11:56: 2067 141 97 95.3108:11:57: 2115 145 101 95.22[…]

Template 4: Count Summary
# funccount 'vfs_*'Tracing... Ctrl-C to end.^CADDR FUNC COUNTffffffff811efe81 vfs_create 1ffffffff811f24a1 vfs_rename 1ffffffff81215191 vfs_fsync_range 2ffffffff81231df1 vfs_lock_file 30ffffffff811e8dd1 vfs_fstatat 152ffffffff811e8d71 vfs_fstat 154ffffffff811e4381 vfs_write 166ffffffff811e8c71 vfs_getattr_nosec 262ffffffff811e8d41 vfs_getattr 262ffffffff811e3221 vfs_open 264ffffffff811e4251 vfs_read 470Detaching...

Template 5: Histogram Summary
# biolatencyTracing block device I/O... Hit Ctrl-C to end.^C usecs : count distribution 4 -> 7 : 0 | | 8 -> 15 : 0 | | 16 -> 31 : 0 | | 32 -> 63 : 0 | | 64 -> 127 : 1 | | 128 -> 255 : 12 |******** | 256 -> 511 : 15 |********** | 512 -> 1023 : 43 |******************************* | 1024 -> 2047 : 52 |**************************************| 2048 -> 4095 : 47 |********************************** | 4096 -> 8191 : 52 |**************************************| 8192 -> 16383 : 36 |************************** | 16384 -> 32767 : 15 |********** | 32768 -> 65535 : 2 |* | 65536 -> 131071 : 2 |* |

Template 6: Heatmap Summary

Template 7: Folded stack output for flame graphs
offcputime -foffwaketime -fwakeuptime -fprofile -f
| flamegraph.pl > out.svg

Valuable Know what already exists
and what doesn't

Documented code comments
man pages example files

Concise, intuitive self-explanatory
# iolatencyTracing block I/O. Output every 1 seconds. Ctrl-C to end.
>=(ms) .. <(ms) : I/O |Distribution | 0 -> 1 : 4381 |######################################| 1 -> 2 : 9 |# | 2 -> 4 : 5 |# | 4 -> 8 : 0 | | 8 -> 16 : 1 |# |[…]

# ./biolatency -husage: biolatency [-h] [-T] [-Q] [-m] [-D] [interval] [count]
Summarize block device I/O latency as a histogram
positional arguments: interval output interval, in seconds count number of outputs
optional arguments: -h, --help show this help message and exit -T, --timestamp include timestamp on output -Q, --queued include OS queued time in I/O time -m, --milliseconds millisecond histogram -D, --disks print a histogram per disk device
examples: ./biolatency # summarize block I/O latency as a histogram ./biolatency 1 10 # print 1 second summaries, 10 times ./biolatency -mT 1 # 1s summaries, milliseconds, and timestamps ./biolatency -Q # include OS queued time in I/O time ./biolatency -D # show each disk device separately
.POSIX-style. arguments

Op>on Alternate Expecta>on-a --all allevents-cCMD --cmd… runthiscommand-dSECONDS --duraAon… duraAonoftoolexecuAon-h --help help-iFILE --input… inputfile-iSECONDS --interval… summaryinterval-nname --name… thisprocessnameonly-oFILE --output… outputfile-pPID --pid… thisprocessIDonly-P --by-process per-processIDbreakdown-PPORT --port… thisTCPportonly-tor-T --[no]Amestamp includeorexcludeAmestamps-v --verbose verboseoutput-x --extended,--errors extendedoutput,oronlyfailures[interval[count]] - summaryinterval,and#ofoutputs

Tested If you can't write the workload,
you can't write the tool

Future Challenges

State of BPF, Feb 2017 1. Dynamictracing,kernel-level(BPFsupportforkprobes)2. Dynamictracing,user-level(BPFsupportforuprobes)3. StaActracing,kernel-level(BPFsupportfortracepoints)4. Timedsamplingevents(BPFwithperf_event_open)5. PMCevents(BPFwithperf_event_open)6. Filtering(viaBPFprograms)7. Debugoutput(bpf_trace_printk())8. Per-eventoutput(bpf_perf_event_output())9. Basicvariables(global&per-threadvariables,viaBPFmaps)10. AssociaAvearrays(viaBPFmaps)11. FrequencycounAng(viaBPFmaps)12. Histograms(power-of-2,linear,andcustom,viaBPFmaps)13. TimestampsandAmedeltas(bpf_kAme_get_()andBPF)14. Stacktraces,kernel(BPFstackmap)15. Stacktraces,user(BPFstackmap)16. Overwriteringbuffers17. Stringfactory(stringmap)18. OpAonal:boundedloops,<and<=,…
1. StaActracing,user-level(USDTprobesviauprobes)2. StaActracing,dynamicUSDT(needslibrarysupport)3. Debugoutput(PythonwithBPF.trace_pipe()and
BPF.trace_fields())4. Per-eventoutput(BPF_PERF_OUTPUTmacroand
BPF.open_perf_buffer())5. Intervaloutput(BPF.get_table()andtable.clear())6. HistogramprinAng(table.print_log2_hist())7. CstructnavigaAon,kernel-level(mapstobpf_probe_read())8. SymbolresoluAon,kernel-level(ksym(),ksymaddr())9. SymbolresoluAon,user-level(usymaddr())10. BPFtracepointsupport(viaTRACEPOINT_PROBE)11. BPFstacktracesupport(incl.walkmethodforstackframes)12. Examples(under/examples)13. Manytools(/tools)14. Tutorials(/docs/tutorial*.md)15. Referenceguide(/docs/reference_guide.md)16. Openissues:(h)ps://github.com/iovisor/bcc/issues)
Stateofbcc,Feb2017
donenotyet

Dynamic tracing stability
need those smoke tests switch tools to static tracepoints

Invalid Tools

Overhead Especially current uprobes

Ease of Coding

bcc/BPF
bccexamples/tracing/bitehist.pyen>reprogram

ply/BPF
h)ps://github.com/wkz/ply/blob/master/README.mden>reprogram

Visualizations

Visualizations and GUIs
Flame Graphs Tracing Reports …
Eg,Nejlixself-serviceUI:

Ancient Linux Linux 3.18 Linux 3.10 Linux 3.2
Linux 2.6.x

(Some) More Tools

Finish porting my old DTrace tools

Links & References
iovisor bcc: • https://github.com/iovisor/bcc • https://github.com/iovisor/bcc/tree/master/docs • http://www.brendangregg.com/blog/ (search for "bcc") • http://blogs.microsoft.co.il/sasha/2016/02/14/two-new-ebpf-tools-memleak-and-argdist/ • I'll change your view of Linux tracing: https://www.youtube.com/watch?v=GsMs3n8CB6g • On designing tracing tools: https://www.youtube.com/watch?v=uibLwoVKjec
BPF: • https://www.kernel.org/doc/Documentation/networking/filter.txt • https://github.com/iovisor/bpf-docs • https://suchakra.wordpress.com/tag/bpf/
Flame Graphs: • http://www.brendangregg.com/flamegraphs.html • http://www.brendangregg.com/blog/2016-01-20/ebpf-offcpu-flame-graph.html • http://www.brendangregg.com/blog/2016-02-01/linux-wakeup-offwake-profiling.html
Linux Performance: http://www.brendangregg.com/linuxperf.html

Thanks
Discussion? iovisor bcc: https://github.com/iovisor/bcc http://www.brendangregg.com http://slideshare.net/brendangregg [email protected] @brendangregg Thanks to Alexei Starovoitov (Facebook), Brenden Blanco (PLUMgrid/VMware), Sasha Goldshtein (Sela), Daniel Borkmann (Cisco), Wang Nan (Huawei), and other BPF and bcc contributors!


![A gentle introduction to [ e ] B P F · BPF(2) Linux Programmer's Manual BPF(2) NAME bpf - perform a command on an extended BPF map or program SYNOPSIS #include](https://img.pdfslide.us/doc/110x75/5ec557b613b08355f20a9fbe/a-gentle-introduction-to-e-b-p-f-bpf2-linux-programmers-manual-bpf2-name.jpg)