Embed Size (px)
Citation preview

Power BI Overview
Gal Vekselman
January 9th, 2018
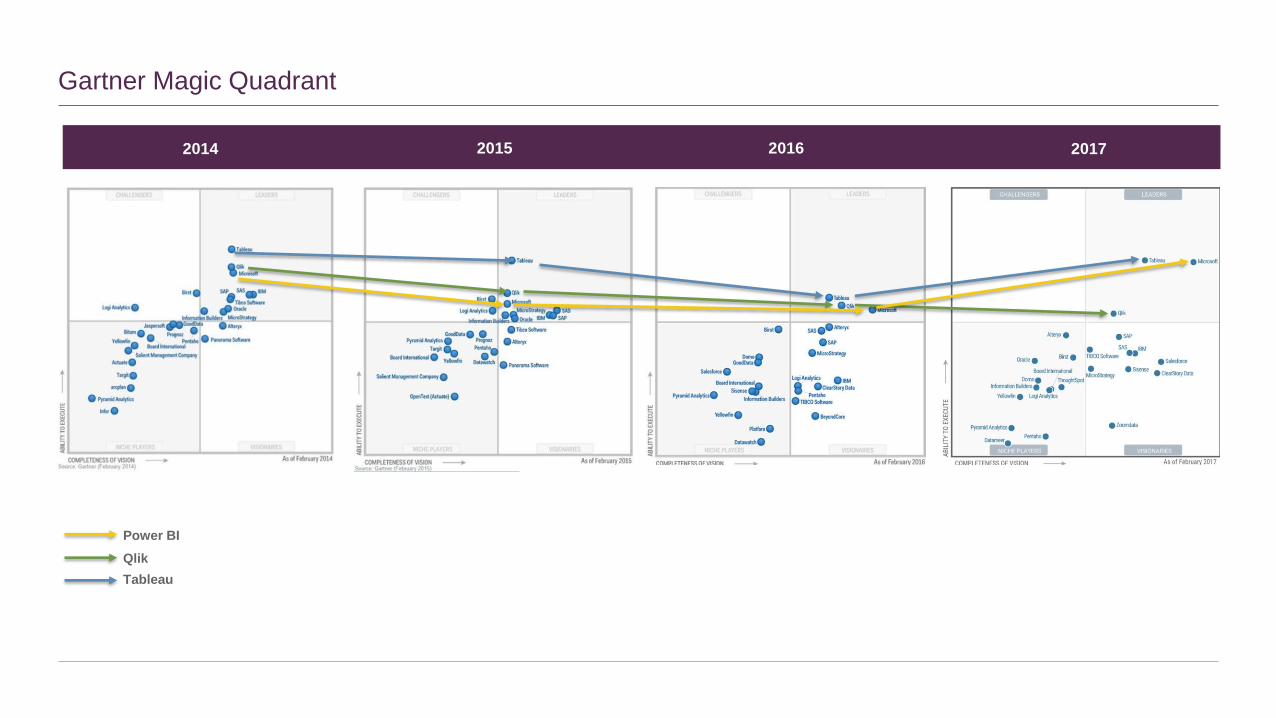
Gartner Magic Quadrant
2014 2015 2016 2017
Tableau
Power BI
Qlik
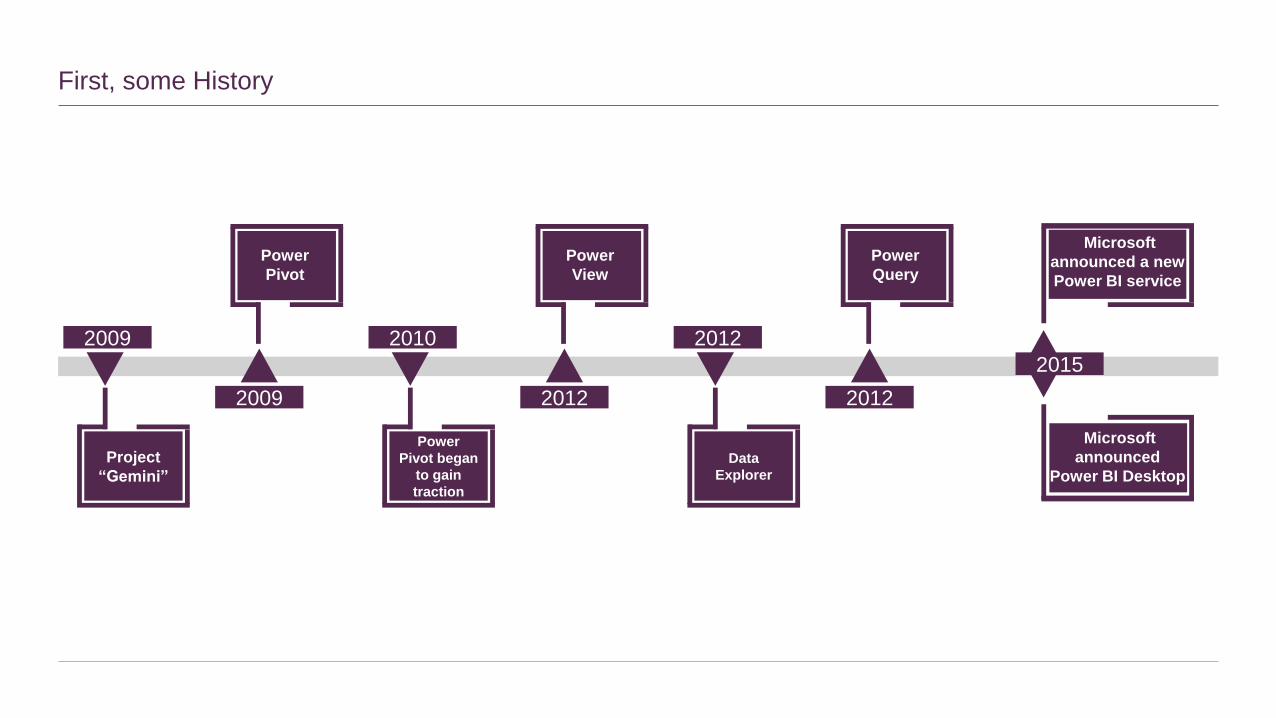
First, some History
Project
“Gemini”
2009
2009
Power
Pivot
Power
Pivot began
to gain
traction
2010
2012
Power
View
Data
Explorer
2012
2012
Power
Query
2015
Microsoft
announced a new
Power BI service
Microsoft
announced
Power BI Desktop

Power BI Tools
• Use Query functionality to connect to data
from a variety of sources
• Transform data to fit your needs using
intuitive UI
• Build semantic layer: Ability to automatically
find related tables when connecting to
database sources
• Easily create measures using DAX
language
• Add calculated columns to tables
• Define hierarchies
• Explore data in a variety of ways and across
multiple visualizations
• Select, transform and mashup data via a
freeform, drag-and-drop canvas
• Visualize data and author reports
• Change color, format and customize
Prepare Build Explore\Report
Power BI
Power Query Power Pivot Power View
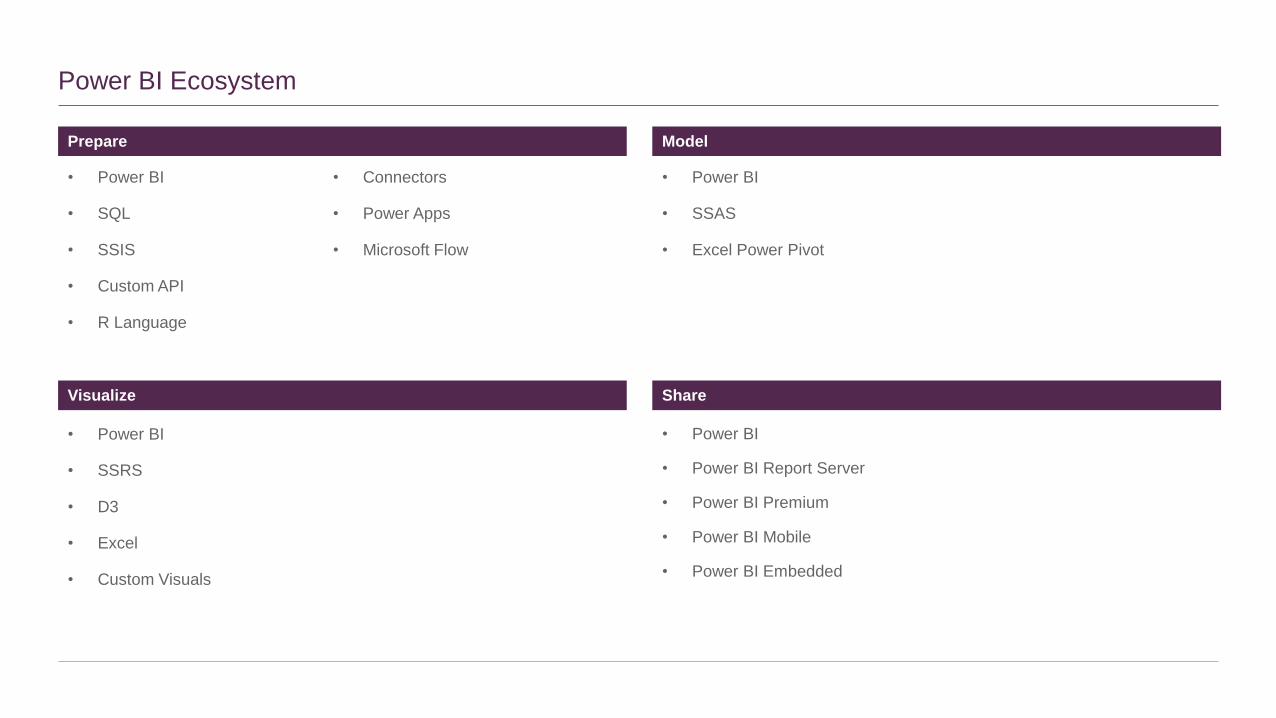
Prepare
Power BI Ecosystem
• Power BI
• SQL
• SSIS
• Custom API
• R Language
Visualize
Model
• Power BI
• SSAS
• Excel Power Pivot
• Power BI
• SSRS
• D3
• Excel
• Custom Visuals
Share
• Power BI
• Power BI Report Server
• Power BI Premium
• Power BI Mobile
• Power BI Embedded
• Connectors
• Power Apps
• Microsoft Flow
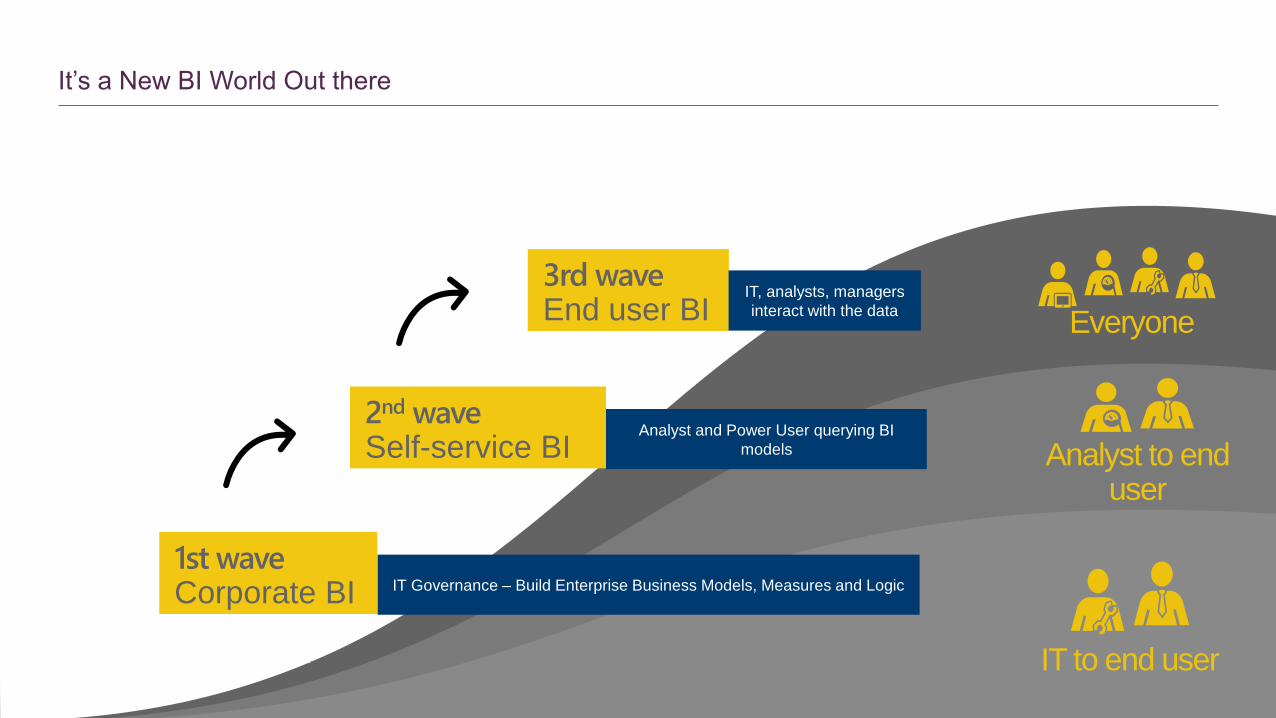
It’s a New BI World Out there
IT to end user
Analyst to end user
Everyone
3rd waveEnd user BI
1st waveCorporate BI
2nd waveSelf-service BI
IT Governance – Build Enterprise Business Models, Measures and Logic
Analyst and Power User querying BI
models
IT, analysts, managers
interact with the data
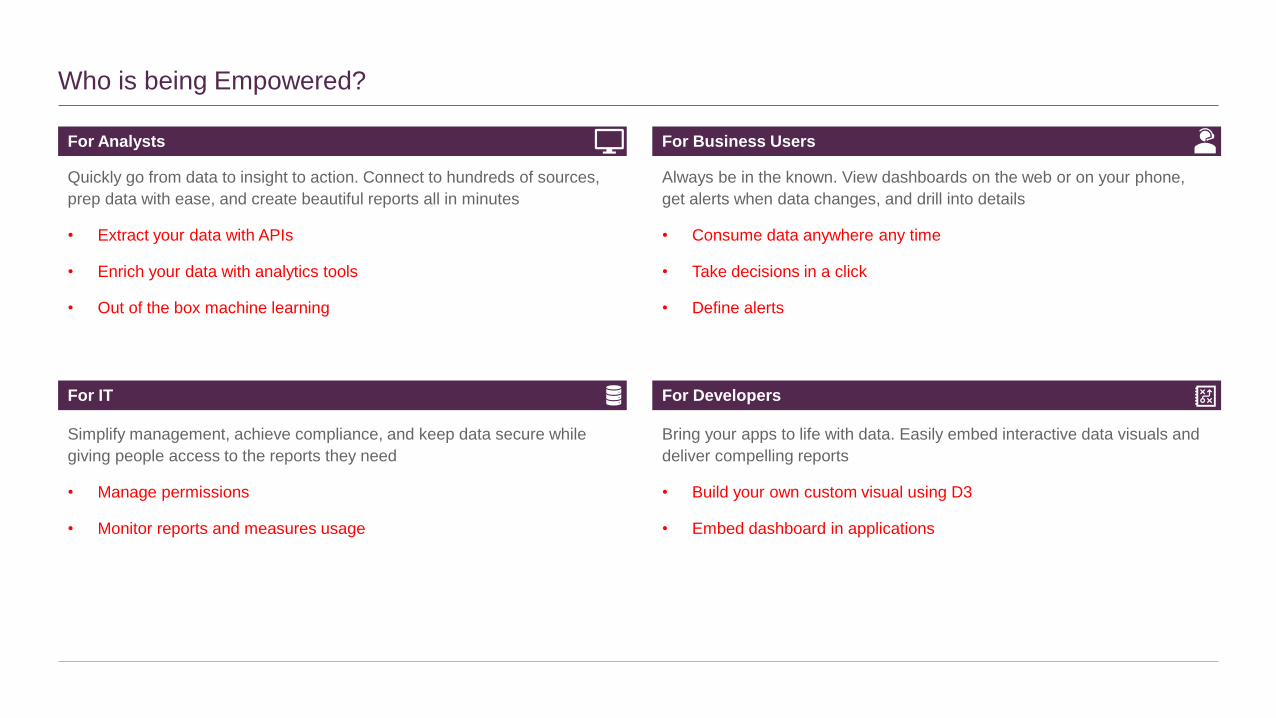
For Analysts
Who is being Empowered?
Quickly go from data to insight to action. Connect to hundreds of sources,
prep data with ease, and create beautiful reports all in minutes
• Extract your data with APIs
• Enrich your data with analytics tools
• Out of the box machine learning
For IT
For Business Users
Always be in the known. View dashboards on the web or on your phone,
get alerts when data changes, and drill into details
• Consume data anywhere any time
• Take decisions in a click
• Define alerts
Simplify management, achieve compliance, and keep data secure while
giving people access to the reports they need
• Manage permissions
• Monitor reports and measures usage
For Developers
Bring your apps to life with data. Easily embed interactive data visuals and
deliver compelling reports
• Build your own custom visual using D3
• Embed dashboard in applications
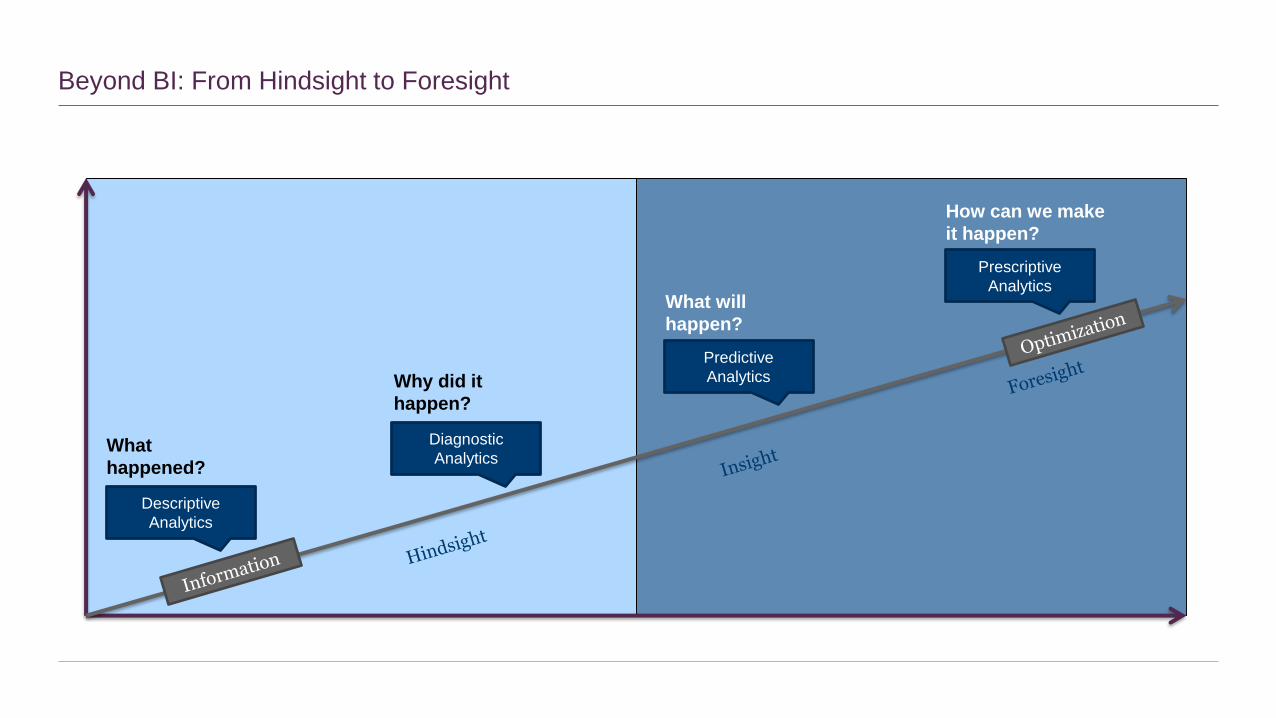
Beyond BI: From Hindsight to Foresight
Descriptive
Analytics
Diagnostic
Analytics
Predictive
Analytics
Prescriptive
Analytics
What
happened?
Why did it
happen?
What will
happen?
How can we make
it happen?
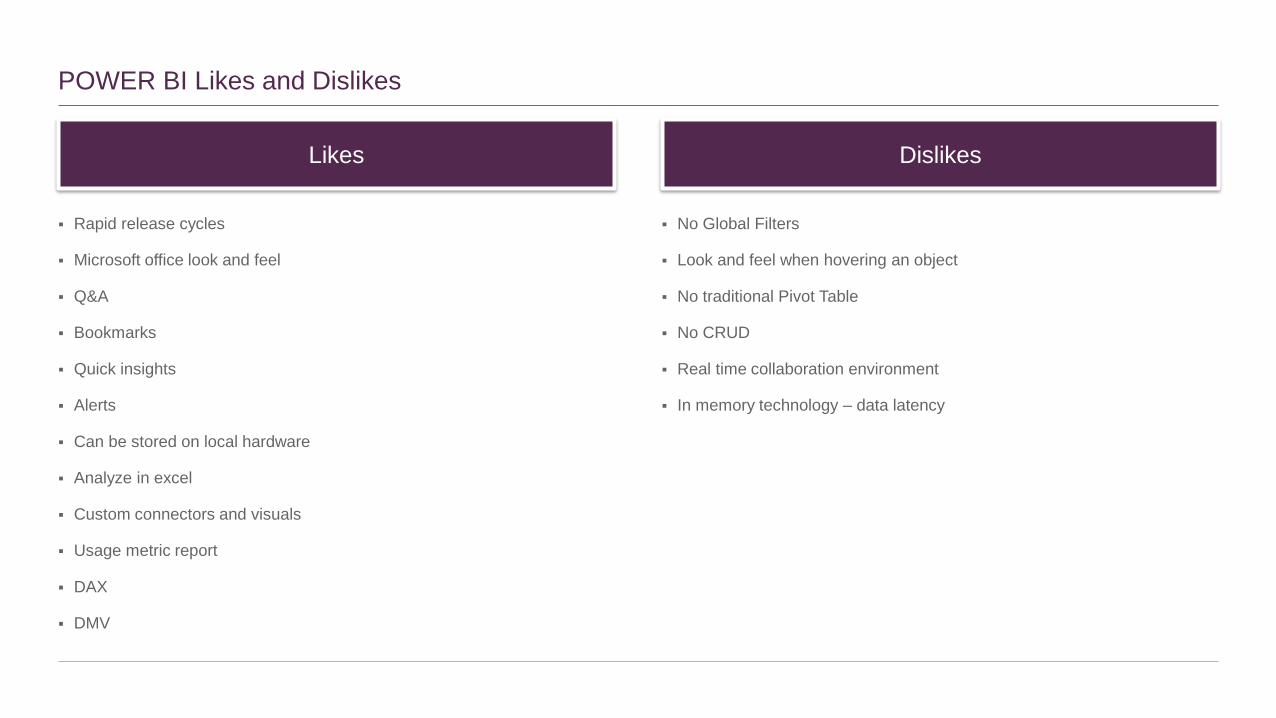
POWER BI Likes and Dislikes
▪ Rapid release cycles
▪ Microsoft office look and feel
▪ Q&A
▪ Bookmarks
▪ Quick insights
▪ Alerts
▪ Can be stored on local hardware
▪ Analyze in excel
▪ Custom connectors and visuals
▪ Usage metric report
▪ DAX
▪ DMV
▪ No Global Filters
▪ Look and feel when hovering an object
▪ No traditional Pivot Table
▪ No CRUD
▪ Real time collaboration environment
▪ In memory technology – data latency
Likes Dislikes


Appendix
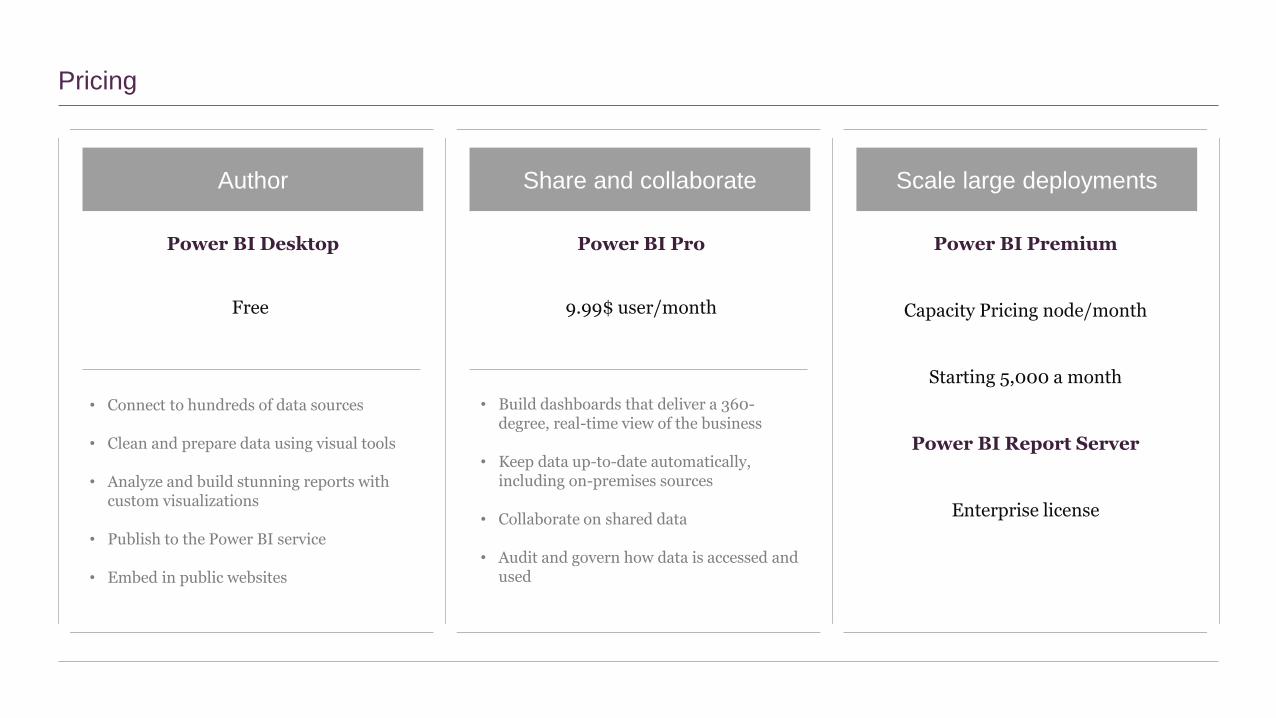
Pricing
Author Share and collaborate Scale large deployments
Power BI Desktop Power BI Pro Power BI Premium
Free 9.99$ user/month Capacity Pricing node/month
• Connect to hundreds of data sources
• Clean and prepare data using visual tools
• Analyze and build stunning reports with custom visualizations
• Publish to the Power BI service
• Embed in public websites
• Build dashboards that deliver a 360-degree, real-time view of the business
• Keep data up-to-date automatically, including on-premises sources
• Collaborate on shared data
• Audit and govern how data is accessed and used
Starting 5,000 a month
Power BI Report Server
Enterprise license
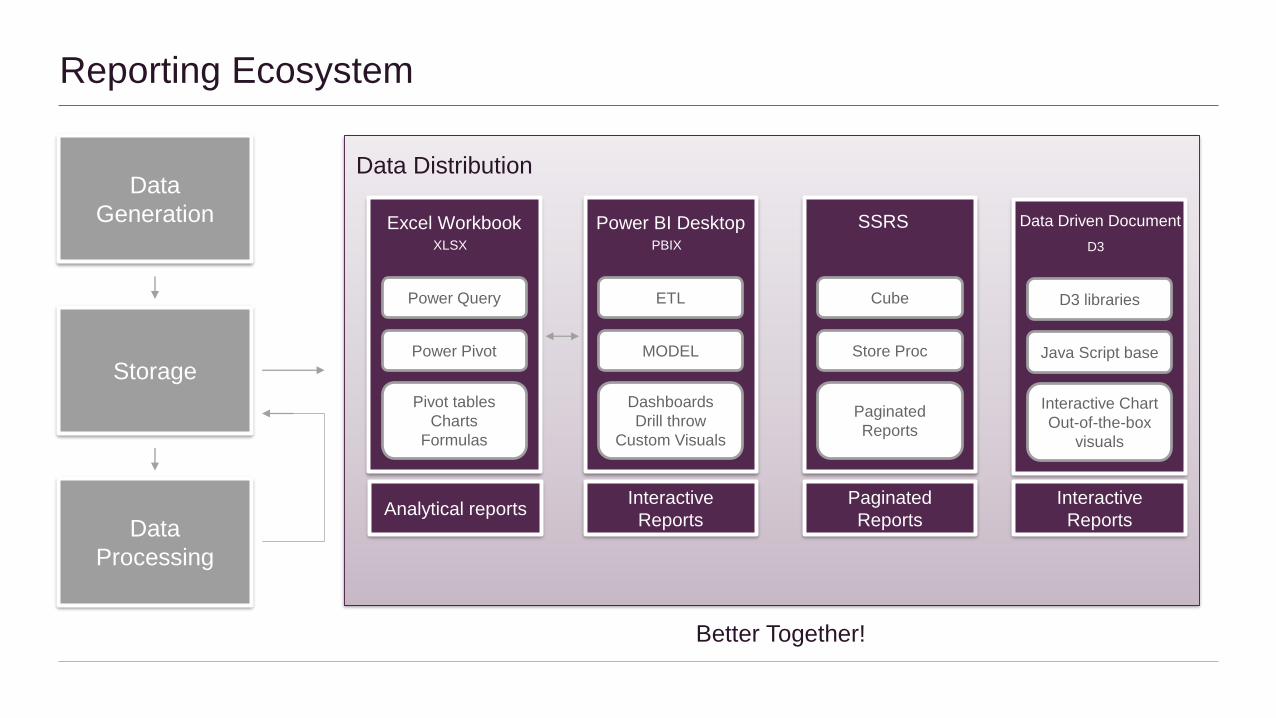
Data
Generation
Storage
Data
Processing
Data Distribution
Better Together!
Excel WorkbookXLSX
Power Query
Power Pivot
Pivot tables
Charts
Formulas
Power BI Desktop PBIX
ETL
MODEL
Dashboards
Drill throw
Custom Visuals
SSRS
Cube
Store Proc
Paginated
Reports
Data Driven Document
D3
D3 libraries
Java Script base
Interactive Chart
Out-of-the-box
visuals
Analytical reportsInteractive
Reports
Paginated
Reports
Reporting Ecosystem
Interactive
Reports
Useful links
• First Experience Using Power BI Desktop
• Power BI General Availability: Features
• Introduction to Power BI
• Excel to Power BI webinar
• Custom Power BI Visualizations