Embed Size (px)
Citation preview

Julie Craig
Research Director, Application Management
Enterprise Management Associates
Twitter: @julie_craig
Automating for Digital Transformation:
Tools-driven DevOps and Continuous
Software Delivery
March 18, 2016

Featured Speaker
Slide 2 © 2015 Enterprise Management Associates, Inc.
Julie Craig – Research Director, EMA Julie has over 20 years of experience in software
engineering, IT infrastructure engineering, and enterprise
management. At EMA, Julie’s focus areas include DevOps,
application performance and availability management,
Application Discovery and Dependency Mapping, software
development, and software as a service.

Logistics for Today’s Webinar
Slide 3 © 2015 Enterprise Management Associates, Inc.
An archived version of the event recording will be
available at www.enterprisemanagement.com
• Log questions in the Q&A panel located on the
lower right corner of your screen
• Questions will be addressed during the Q&A
session of the event
Questions
Event recording

Julie Craig
Research Director, Application Management
Enterprise Management Associates
Twitter: @julie_craig
Automating for
Digital Transformation:
Tools-driven DevOps and
Continuous Software Delivery
March 18, 2016

Sponsors
Slide 5 © 2015 Enterprise Management Associates, Inc.

• Background and methodology
• Digital Transformation
• DevOps and Cross-functional practices
• Continuous Delivery
• Tools
• Summary and wrap-up
Slide 6 © 2015 Enterprise Management Associates, Inc.
Agenda

Background and high level summary
• Revised repeat of 2014 research on DevOps/Continuous Delivery
• This year’s study reveals, at a high level, that:
• More than 80% of companies are engaged in “Digital Transformation”
initiatives
• Cross-functional DevOps is now mainstream, accepted best practice at
companies of all sizes
• Continuous Delivery has hit mainstream
• Links definitely do exist between both Ops and continuous delivery and
revenue growth
Slide 7 © 2015 Enterprise Management Associates, Inc.

• Survey conducted during month of October, 2015 by EMA survey
team
• 400+ respondents
• 38% executives (Directors, VPs, or C level), 34% middle
management (including architects), 28% line staff
• 14% from companies with less than 1000 employees, 50% from
mid-sized companies (defined as 1000 to 9,999 employees), 36%
from companies with 10,000 or more employees
Slide 8 © 2015 Enterprise Management Associates, Inc.
Survey Methodology

• Background and methodology
• Digital Transformation
• DevOps and Cross-functional practices
• Continuous Delivery
• Tools
• Summary and wrap-up
Slide 9 © 2015 Enterprise Management Associates, Inc.
Agenda

85% of respondents state their companies
are engaged in Digital Transformation initiatives
Slide 10 © 2015 Enterprise Management Associates, Inc.
85%
15%
Yes
No
In your opinion, is your company actively engaged in Digital Transformation activities?

Digital Transformation: Top focus areas
Slide 11 © 2015 Enterprise Management Associates, Inc.
42%
42%
39%
38%
36%
36%
35%
33%
Compressed delivery time frames for IT services
Improvements in quality of the services delivered toIT and business
Improvements in IT-business alignment
Organizational shifts in IT focus from silo andtechnology-based to customer- and business-aligned
Cost reduction associated with delivery of ITservices
Agility in terms of "time to innovation", i.e. timerequired to transform ideas into full-blown…
Customer satisfaction (external customers)
Customer satisfaction (internal customers)
From the organizational perspective, which of the following are the top focus areas for your Digital Transformation initiatives?

Digital Transformation: Top technology-related initiatives
Slide 12 © 2015 Enterprise Management Associates, Inc.
55%
40%
39%
36%
36%
34%
34%
18%
9%
Automation supporting the Continuous Delivery process
Automation and technologies supporting sensor networks,"Internets of Things"
Automation and technologies supporting mobile access toyour company's IT systems
Automation supporting digital interactions with partners andcustomers
Improved software development/testing initiatives to improvequality of code delivered to production
Streamlining and accelerating the end-to-end softwarelifecycle
Automation supporting Agile software development
Improvements in customer satisfaction measurements andmetrics
Improvements in end user experience measurements andmetrics
Which of the following do you see as the top technology-related initiatives supporting your Digital Transformation initiatives?

Digital Transformation: Top challenges
Slide 13 © 2015 Enterprise Management Associates, Inc.
57%
36%
36%
34%
34%
32%
26%
24%
18%
Organizational silos make it difficult to cross-functionallyexecute transformation initiatives
Lack of customer satisfaction metrics
Lack of executive vision
Lack of end user experience metrics
Lack of skills within IT
Slow delivery of development-related code and features
Lack of direction on steps to take to "Digitally Transform" ourbusiness
Slow fulfillment of IT service requests
Difficulty accelerating "Continuous Delivery" into production
Which of the following are the top challenges your company is encountering in terms of implementing your Digital Transformation initiatives?

• Background and methodology
• Digital Transformation
• DevOps and Cross-functional practices
• Continuous Delivery
• Tools
• Summary and wrap-up
Slide 14 © 2015 Enterprise Management Associates, Inc.
Agenda

Slide 15 © 2015 Enterprise Management Associates, Inc.
97% of respondent companies leveraging DevOps practices,
defined as teams with “cross-functional” skill sets
97%
3%
Yes
No
Does your company utilize a team of IT specialists with cross-functional development and operations-related skill sets to support
the application delivery and/or management function?

60% have “permanent” DevOps groups, 40% ad hoc
Slide 16 © 2015 Enterprise Management Associates, Inc.
39%
61%
Ad-hoc
Dedicated
Is this an "ad-hoc" team that comes together only when problems arise, or is it a dedicated team?

In turnaround from 2014, 25% actually call these
“DevOps” teams
Slide 17 © 2015 Enterprise Management Associates, Inc.
29%
26%
19%
8%
8%
4%
4%
2%
Application Management/Support
DevOps
Infrastructure Services
Service Level Management
Center of excellence
Architecture group
System Reliability Engineering
Other
Which of the following names does this team go by in your company?

Slide 18 © 2015 Enterprise Management Associates, Inc.
Most commonly funded by “multiple departments”
HOWEVER big change is that 15% now funded by LOB
23%
21%
20%
18%
15%
1%
Multiple departments within IT
Operations budget/management
CIO office
Development budget/management
Line of Business (LOB)
Multiple departments within Line of Business
How is this team funded and managed?

Slide 19 © 2015 Enterprise Management Associates, Inc.
DevOps drives cross-organizational,
versus silo-based, tools planning
38%
30%
14%
11%
4%
We are doing more cross-functional, versus silo-based, tools planning
Created a need for troubleshooting/root causeanalysis -focused toolsets such as Application
Management Platforms and Suites
Minimal impact, tools planning is primarily silo-based
Created a need for integrations across themanagement toolset
Created a need for Change Control tools
How has DevOps impacted your company's management tools planning, requirements, and strategy?
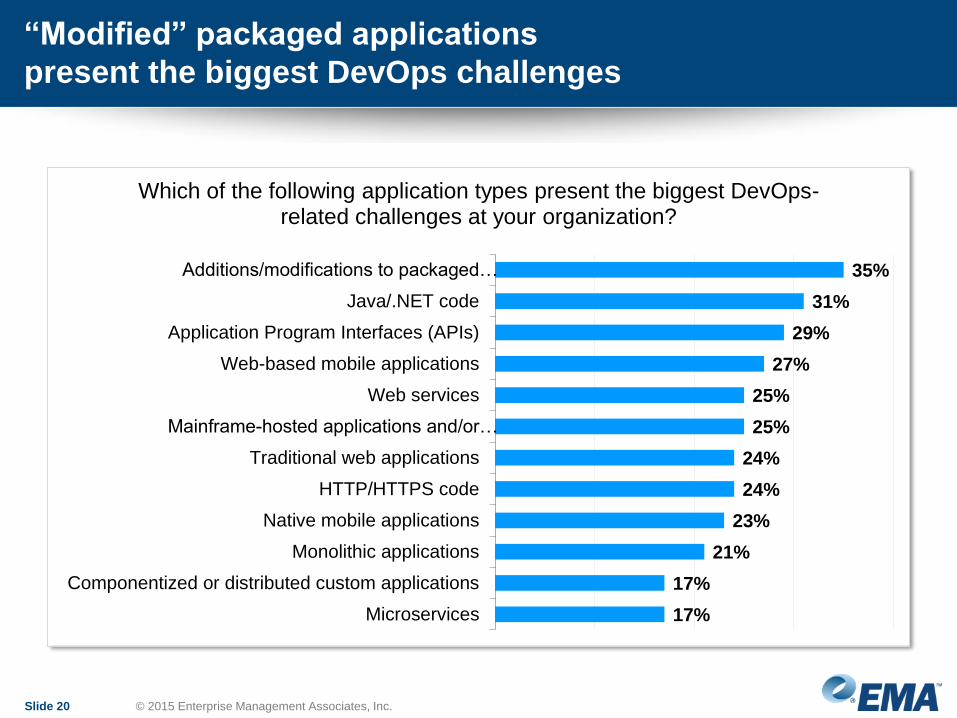
“Modified” packaged applications
present the biggest DevOps challenges
Slide 20 © 2015 Enterprise Management Associates, Inc.
35%
31%
29%
27%
25%
25%
24%
24%
23%
21%
17%
17%
Additions/modifications to packaged…
Java/.NET code
Application Program Interfaces (APIs)
Web-based mobile applications
Web services
Mainframe-hosted applications and/or…
Traditional web applications
HTTP/HTTPS code
Native mobile applications
Monolithic applications
Componentized or distributed custom applications
Microservices
Which of the following application types present the biggest DevOps-related challenges at your organization?

Deployment complexity is #1 challenge cited
Slide 21 © 2015 Enterprise Management Associates, Inc.
49%
43%
39%
38%
35%
34%
32%
28%
Complexity creates deployment challenges
Difficulty collaborating across silos
Multiple development workstreams never seem tostay in sync
Frequent performance or availability issuescompared to other application types
Adverse impact of change
Lack in-house skills or knowledge in this area
Lack of adequate tools to manage the applicationtype
Lack of visibility to topologies showing howcomponents connect and interact
What is the nature of these challenges?

Quality of Dev/Ops interactions directly correlates with revenue
growth, for the 2nd year in a row
Slide 22 © 2015 Enterprise Management Associates, Inc.
92%
8%
75%
25%
DevOps Excellent or Above Average
DevOps Average or Poor
Q1: How would you describe the quality of the overall day to day interaction between Development and Operations generally at your company? Q2: What was the percentage increase or decrease of your organization's annual revenue
Revenue increased by 10% or more Revenue increased less than 10%/Same/Decreased
11.5X

Agenda
Slide 23 © 2015 Enterprise Management Associates, Inc.
• Background and methodology
• Digital Transformation
• DevOps and Cross-functional practices
• Continuous Delivery
• Tools
• Summary and wrap-up

92% of respondent companies engaged in
Continuous Delivery
Slide 24 © 2015 Enterprise Management Associates, Inc.
92%
8%
Yes
No
Is your company engaged in Continuous Delivery of application code?

Top 4 CD drivers are business- and customer-related
Slide 25 © 2015 Enterprise Management Associates, Inc.
42%
40%
39%
34%
33%
31%
30%
29%
22%
Business demands for new products or services
Customer demands for better application quality
Customer demands for new products or services
Business demands to better compete against…
Agile development practices
CIO-driven requirements for increased…
Executive-driven desire to rapidly implement…
Regulatory or compliance requirements/changes
Industry vertical specific changes
Which of the following are the top drivers for the Continuous Delivery initiative at your company?

40% believe Agile accelerates Continuous Delivery;
30% see Continuous Delivery as a bottleneck
Slide 26 © 2015 Enterprise Management Associates, Inc.
39%
29%
16%
11%
5%
In general, as Agile iterations accelerate,Continuous Delivery accelerates as well
In general, Agile development iterates morequickly; actual Continuous Delivery is a bottleneck
In general, Continuous Delivery is fast andefficient, development is a bottleneck
In general, Continuous Delivery is fast andefficient, pre-deployment testing is a bottleneck
Not at all: the two are unrelated and disconnected
How do your company's Agile practices relate to your Continuous Delivery practices?

65% deliver code at least weekly,
almost 15% multiple times daily
Slide 27 © 2015 Enterprise Management Associates, Inc.
22%
20%
14%
14%
11%
8%
7%
3%
Multiple times per week
Weekly
Multiple times per day
Multiple times per month
Monthly
Daily, but not multiple times per day
Quarterly
At intervals greater than quarterly
As a rule, how frequently does your organization deploy new code to production?

Accelerated delivery frequency impacts customer
satisfaction, promotes agility in competitive differentiation
Slide 28 © 2015 Enterprise Management Associates, Inc.
49%
44%
41%
35%
33%
Higher levels of customer satisfaction
Faster revenue growth
Minimal business impact
We are more agile in competing within ourindustry
Less negative fallout on social media
How has this increase in frequency of code delivery impacted the business as a whole?

Delivery frequency also directly correlates with revenue
growth, for the 2nd year in a row
Slide 29 © 2015 Enterprise Management Associates, Inc.
71%
29%
32%
68%
Delivery freq increased by 10% or more
Delivery freq increased less than10%/Same/Decreased
How does your organization’s frequency of code delivery today compare to that of 12 months ago?
What was the percentage increase or decrease of your organization's annual revenue from last year to this year?
Revenue increased by 10% or more Revenue increased less than 10%/Same/Decreased
2.5X
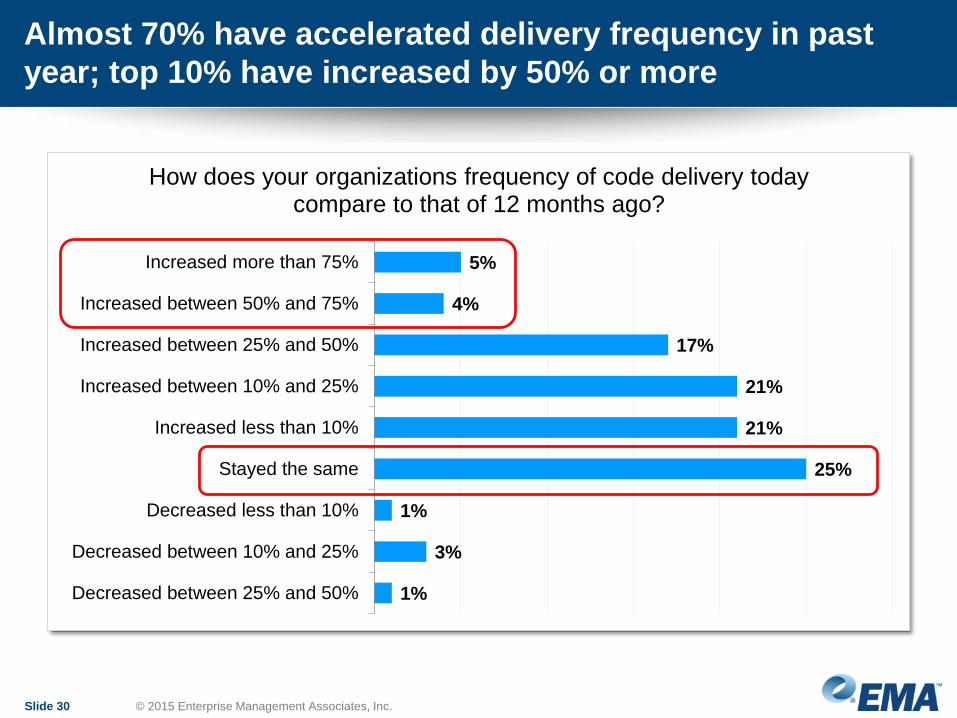
Almost 70% have accelerated delivery frequency in past
year; top 10% have increased by 50% or more
Slide 30 © 2015 Enterprise Management Associates, Inc.
5%
4%
17%
21%
21%
25%
1%
3%
1%
Increased more than 75%
Increased between 50% and 75%
Increased between 25% and 50%
Increased between 10% and 25%
Increased less than 10%
Stayed the same
Decreased less than 10%
Decreased between 10% and 25%
Decreased between 25% and 50%
How does your organizations frequency of code delivery today compare to that of 12 months ago?

Key takeaway: BUT more than half say faster delivery creates
production-related challenges for Dev and Ops
Slide 31 © 2015 Enterprise Management Associates, Inc.
52%
48%
45%
36%
31%
Operations is spending more time on productiontroubleshooting
Development is drawn into productiontroubleshooting more often
Service levels have degraded as rates of changeincreased
We are experiencing a higher number ofperformance and/or availability problems
Minimal production impact
How has this increase in frequency of code delivery impacted production environments?

Production support feeling the impact
of accelerated rates of change
Slide 32 © 2015 Enterprise Management Associates, Inc.
Dev spends as much time supporting production as it does developing new apps
Ops spends more time on application support than on infrastructure support

• Background and methodology
• DevOps
• Continuous Delivery
• Digital Transformation
• Cross-functional processes/organization
• Tools
• Summary and wrap-up
Slide 33 © 2015 Enterprise Management Associates, Inc.
Agenda

Slide 34 © 2015 Enterprise Management Associates, Inc.
44% say manual troubleshooting is slowing down
Continuous Delivery pipeline
44%
37%
37%
37%
36%
34%
27%
24%
23%
Manual troubleshooting processes dealing withproblems arising from production changes
Time spent testing code
Manual processes supporting package builds andproduction deployment
Fear/risk related to adverse production impacts ofnew code
Time spent creating code
Manual processes supporting code movementthrough lifecycle stages
Lack of testing/QA personnel
Lack of testing facilities, developers and/or QAmust "wait their turn" to test
Lack of workflow/automation tools to drive theContinuous Delivery pipeline
Which of the following factors are the biggest "bottlenecks" slowing down your Continuous Delivery pipeline?

Slide 35 © 2015 Enterprise Management Associates, Inc.
“Continuous Delivery” still top focus area for tools
investments: #1 in 2014 as well
35%
32%
30%
29%
22%
21%
20%
19%
19%
17%
15%
Deployment/Release Automation supporting ContinuousDelivery
Application Management platform or suite solution supportingDevOps & troubleshooting
Workflow automation supporting DevOps and ContinuousDelivery processes
Tools supporting visibility to App Lifecycle underlyingContinuous Delivery processes
Process/workflow automation
Change control
"Service virtualization" supporting software integration ®ression testing
"Start to finish" Continuous Delivery workstream
Requirements management
API development
API delivery
If you were in charge of your organization's management tools budget, which of the following areas would you be most likely to invest in during the next 12 months?

• Background and methodology
• DevOps
• Continuous Delivery
• Digital Transformation
• Cross-functional processes/organization
• Tools
• Summary and wrap-up
Slide 36 © 2015 Enterprise Management Associates, Inc.
Agenda

Top trends
• Agile, DevOps now mainstream
• Continuous Delivery widespread, but some companies still struggling
to “get it right”
• Standard toolsets (Project management, development-related tools)
are still strategic
• However “deployment/release automation” tools top 2016 wish lists
• “Application management” platforms and suites are #2 on wish lists
• Accelerated software delivery, quality of Dev and Ops interactions
confirmed as having direct impact on revenue growth
Slide 37 © 2015 Enterprise Management Associates, Inc.

Get the report:
www.enterprisemanagement.com/research