Embed Size (px)
Citation preview

IT Management, SimplifiedReal-time IT management solutions for the new speed of business

Are Your Mission Critical Apps Really Performing?
Scott RileyDirector of Cloud and Hosting at GCI
Email: [email protected] Twitter: @Fauxnuts
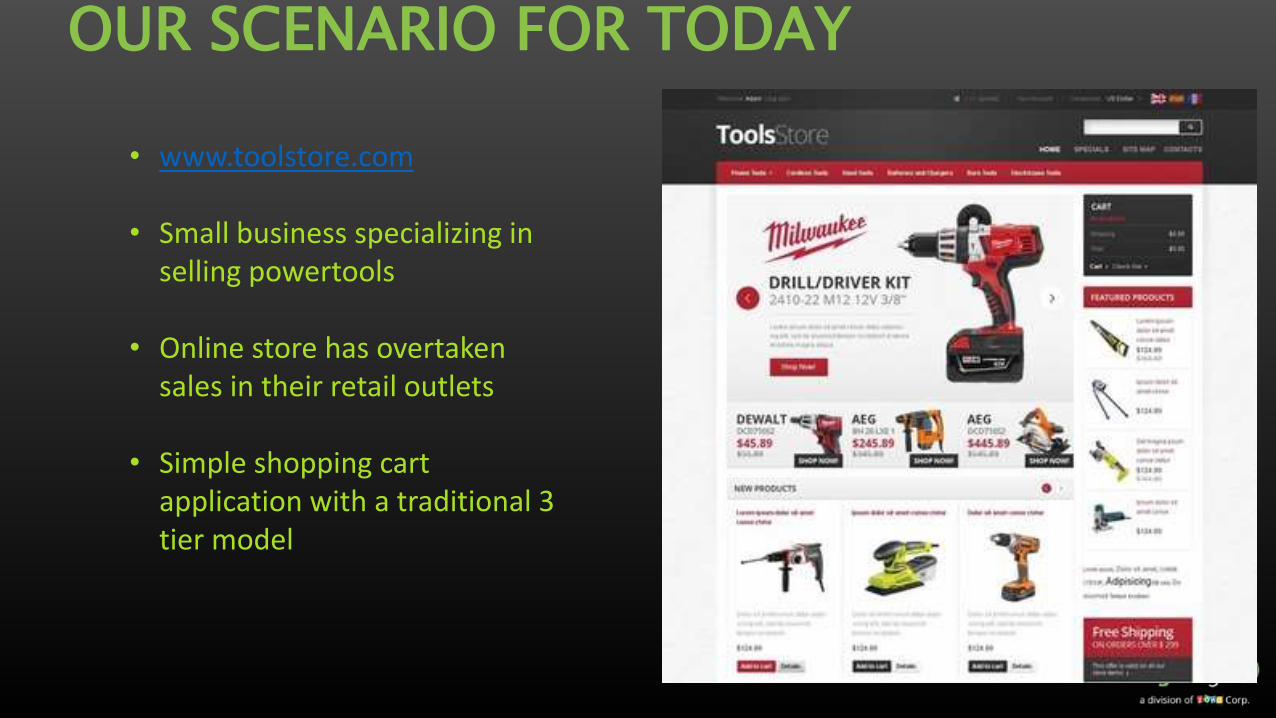
OUR SCENARIO FOR TODAY
• www.toolstore.com
• Small business specializing in selling powertools
• Online store has overtaken sales in their retail outlets
• Simple shopping cart application with a traditional 3 tier model

Presentation
Business Logic
Data Access
THE 3 TIER APPLICATION MODEL

Network Monitoring Tools
Server Monitoring Tools
‘Hands On’ Monitoring
vmApplication Monitoring Tools
Net
wo
rk
Net
wo
rk
Net
wo
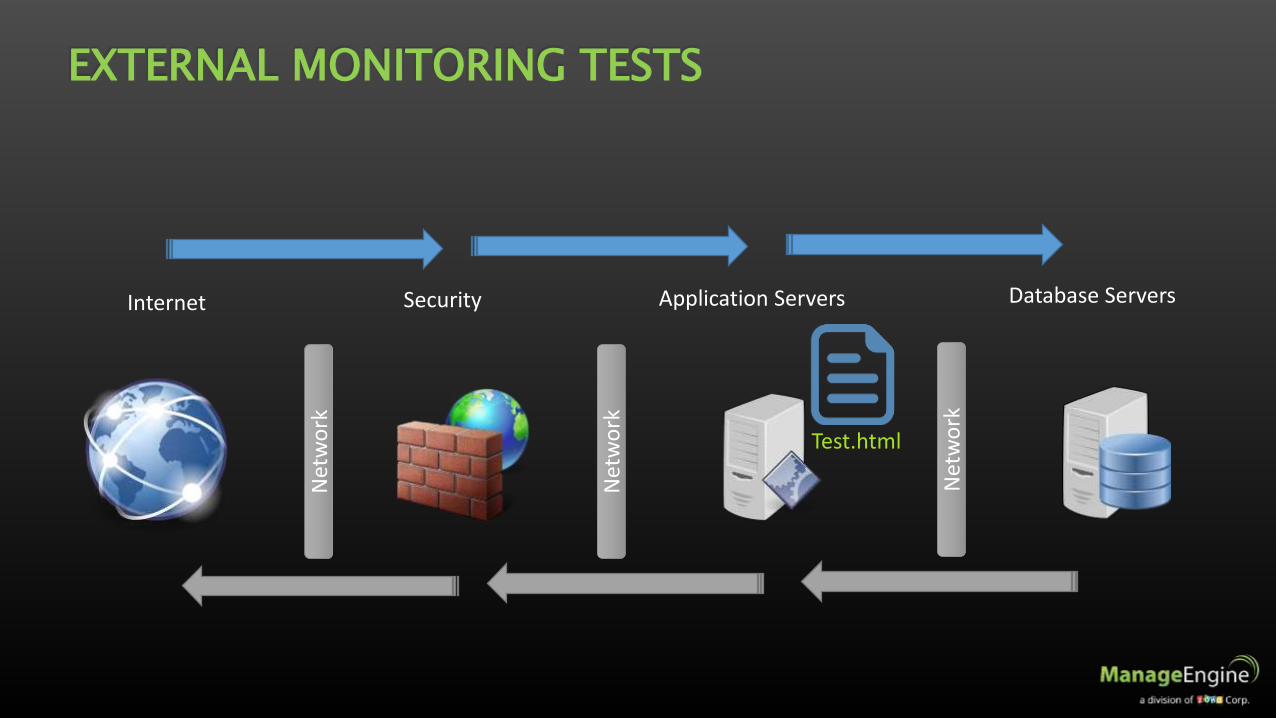
rkInternet Security Application Servers Database Servers
Test.html
EXTERNAL MONITORING TESTS
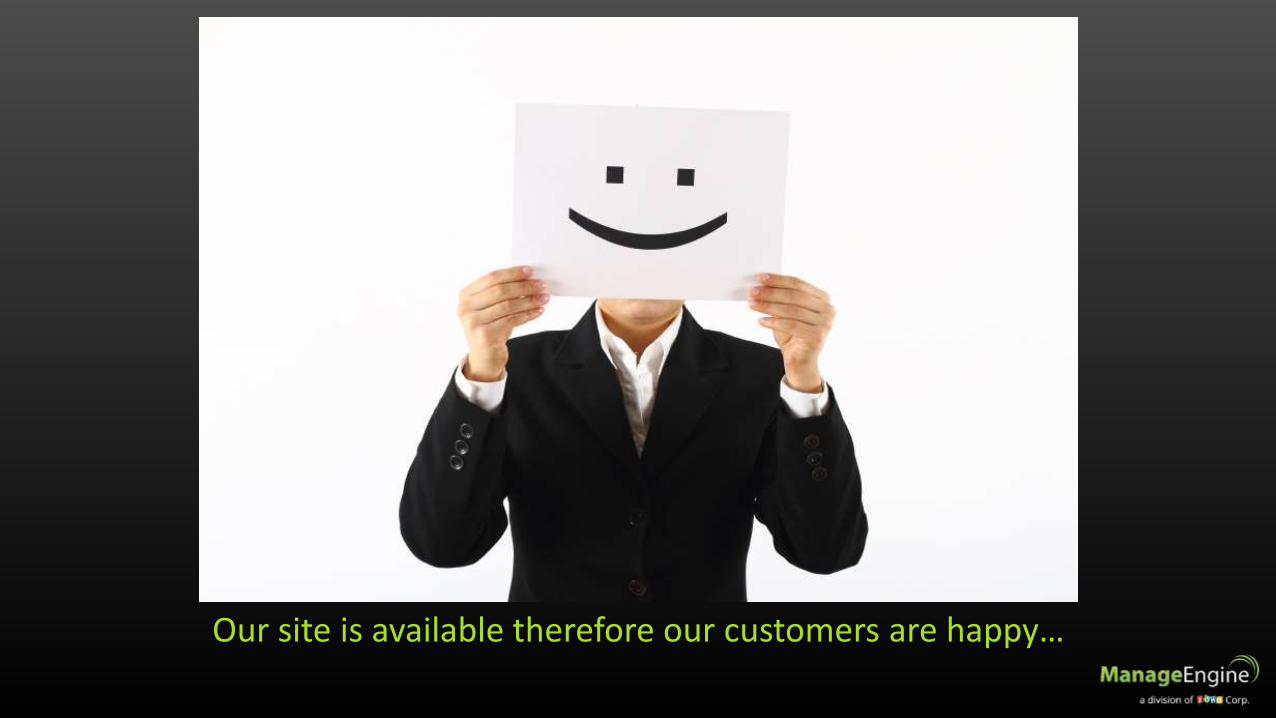
Our site is available therefore our customers are happy…
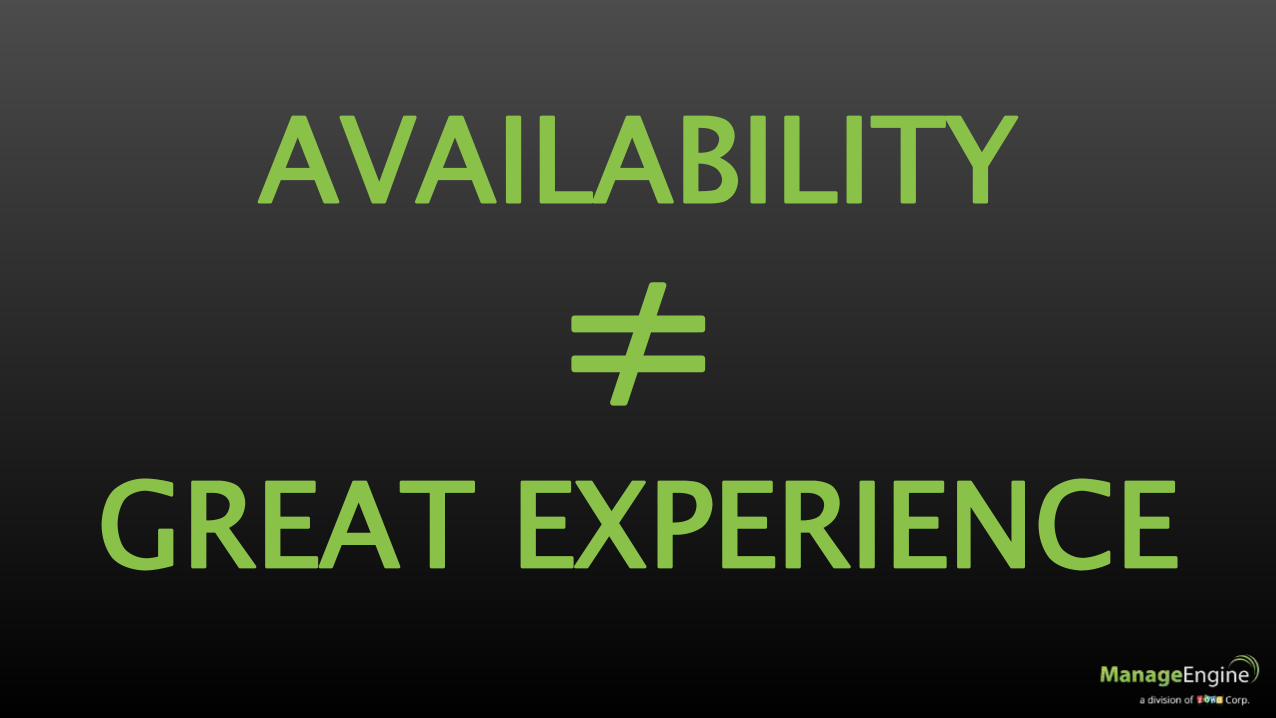
AVAILABILITY
≠GREAT EXPERIENCE

Net
wo
rk
Net
wo
rk
Storage Storage
Net
wo
rk
Internet Security Application Servers Database Servers
Storage Arrays
THE MOVE TO CLOUD | WHAT HAS CHANGED?

Net
wo
rk
Net
wo
rk
Storage Storage
Net
wo
rk
Internet Security Application Servers Database Servers
Storage Arrays
THE MOVE TO CLOUD | WHAT HAS CHANGED?
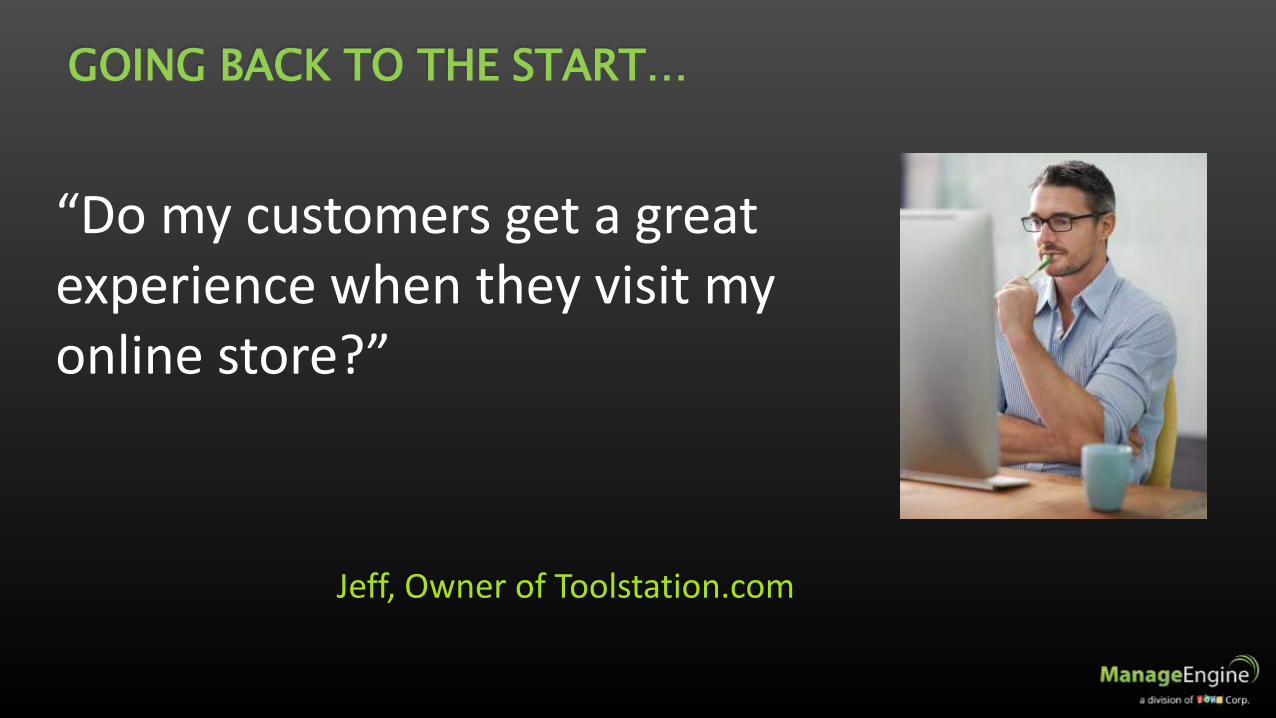
“Do my customers get a great experience when they visit my online store?”
Jeff, Owner of Toolstation.com
GOING BACK TO THE START…
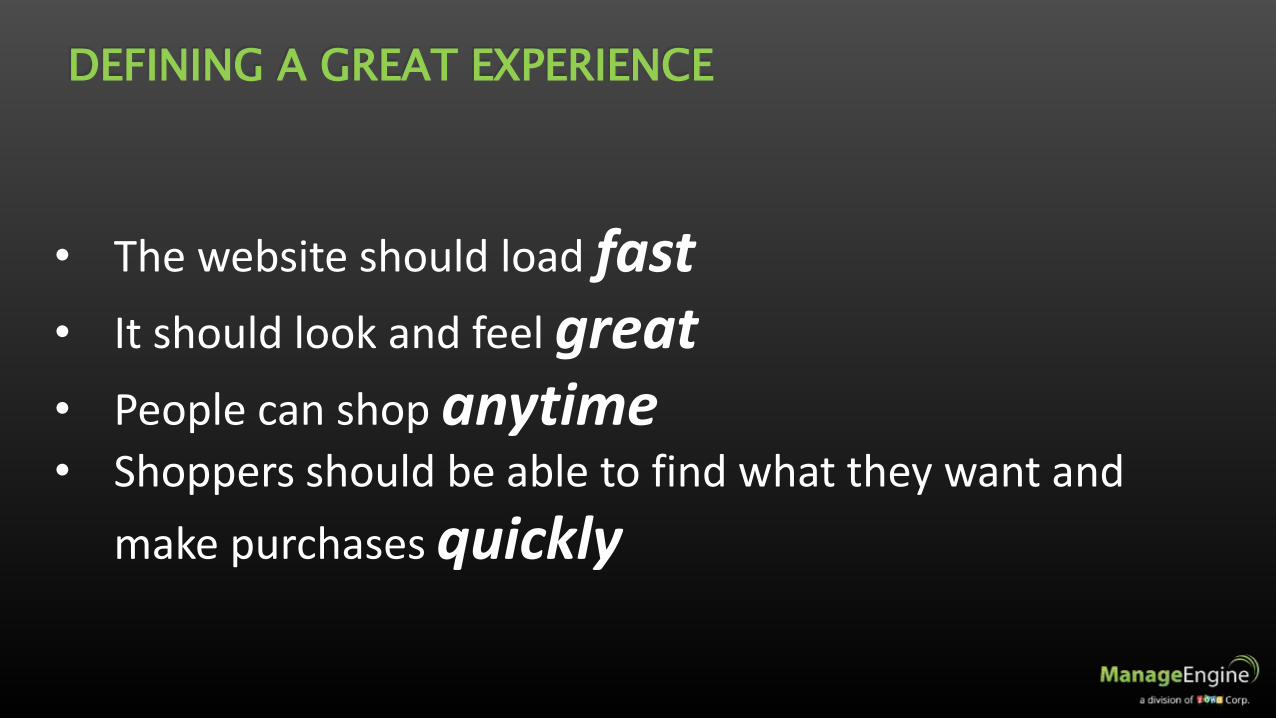
• The website should load fast• It should look and feel great• People can shop anytime• Shoppers should be able to find what they want and
make purchases quickly
DEFINING A GREAT EXPERIENCE
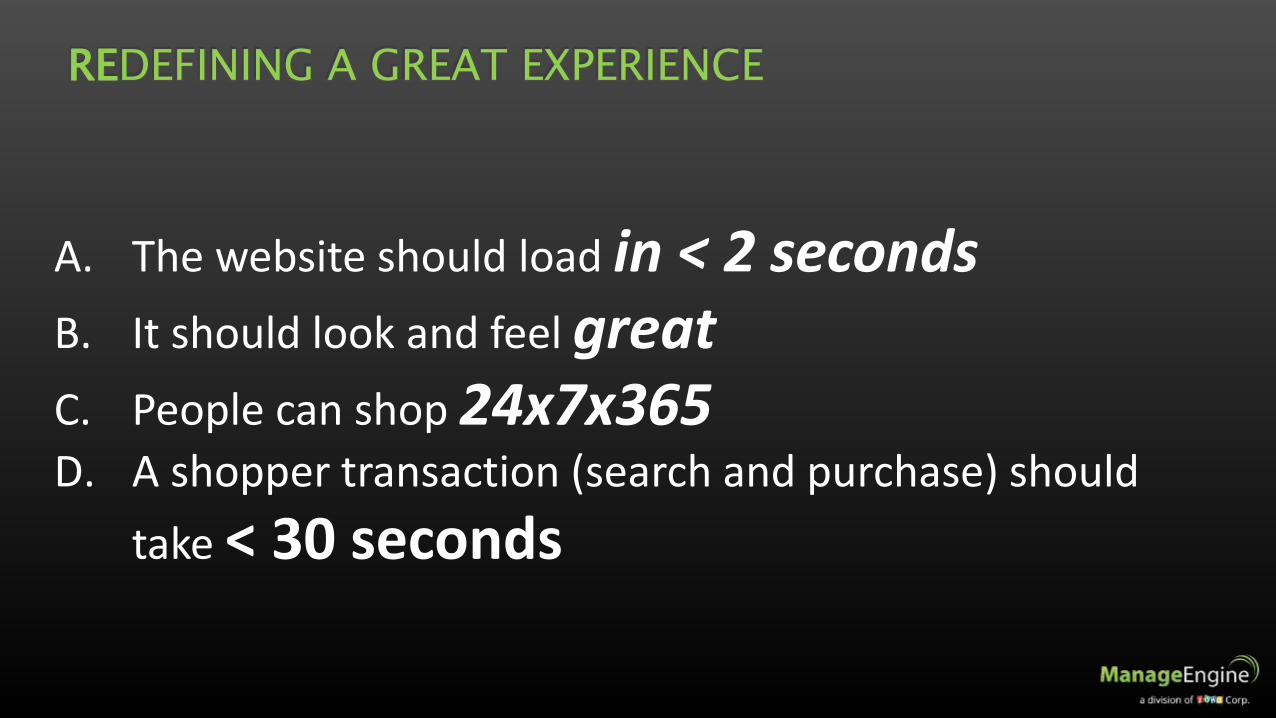
A. The website should load in < 2 secondsB. It should look and feel greatC. People can shop 24x7x365D. A shopper transaction (search and purchase) should
take < 30 seconds
REDEFINING A GREAT EXPERIENCE
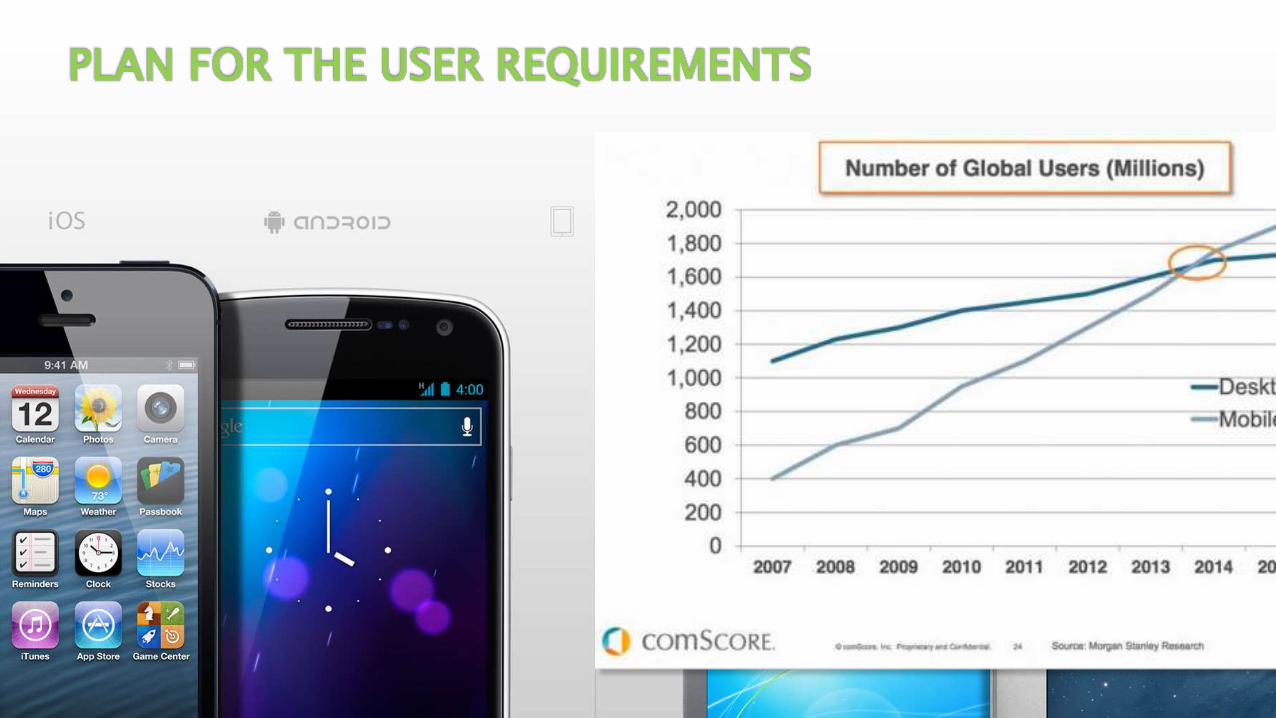
PLAN FOR THE USER REQUIREMENTS

WHAT’S IN A TRANSACTION
• The website is available• Customer can authenticate and
load their profile• They can search for products • They can add a product to their
shopping cart• They can purchase the cart
contents at a checkout• Their payment can be
completed online
Elapsed Time (secs)0 30

MONITORING IN ALL THE RIGHT PLACES
• Consolidate all tasks into one engine• Focus on User Experience not on System Experience• Use Synthetic Transaction Monitoring

Site 24x7 Default
dashboard
Site24x7 RMB
dashboard

Applications Manager Default dashboard
Applications Manager - Drilling down into Monitor Groups

IDENTIFY BOTTLENECKS WITH DEEP APPLICATION MONITORING

BASELINE
Optimal Target
Poor Performance Threshold
Alert Triggers
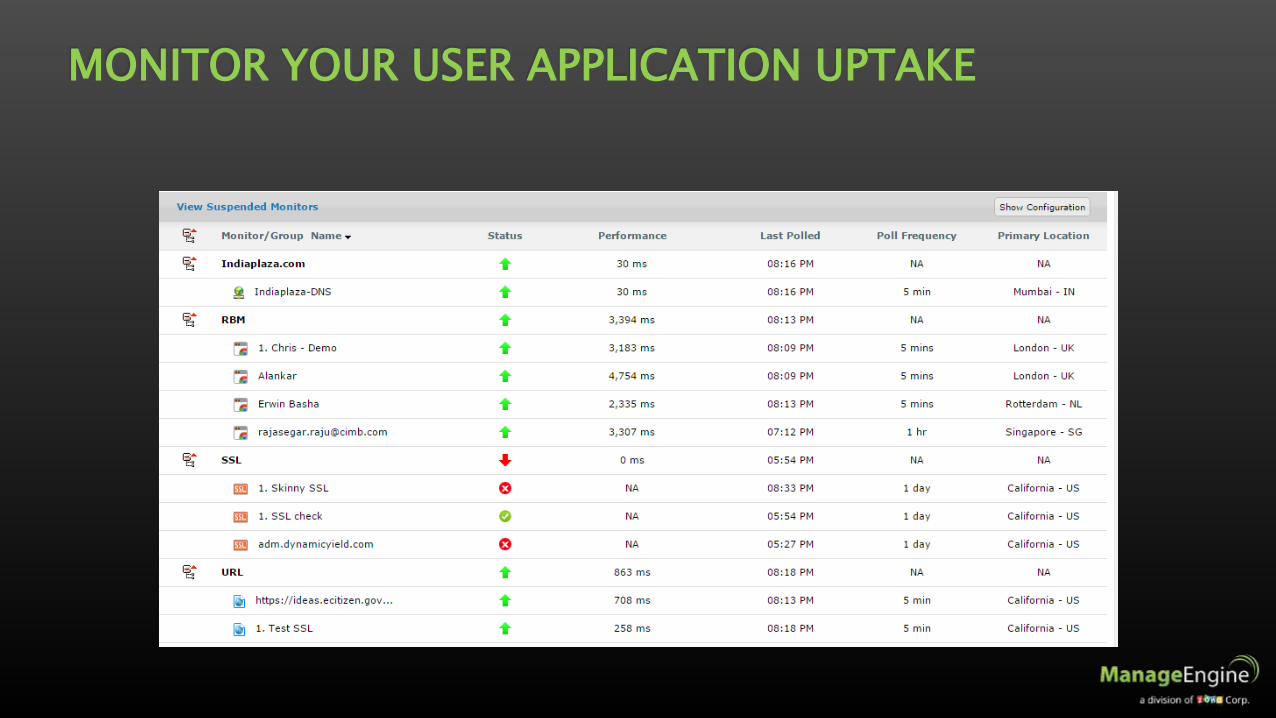
MONITOR YOUR USER APPLICATION UPTAKE

TEST, TEST AND TEST AGAIN
• Managing
• Validate• Identify
Plan Do
StudyAdjust
1. Identify you improvement2. Define what to measure
3. Gather Data4. Process Data
5. Analyse Data6. Use the data to plan your changes
7. Implement your Improvement
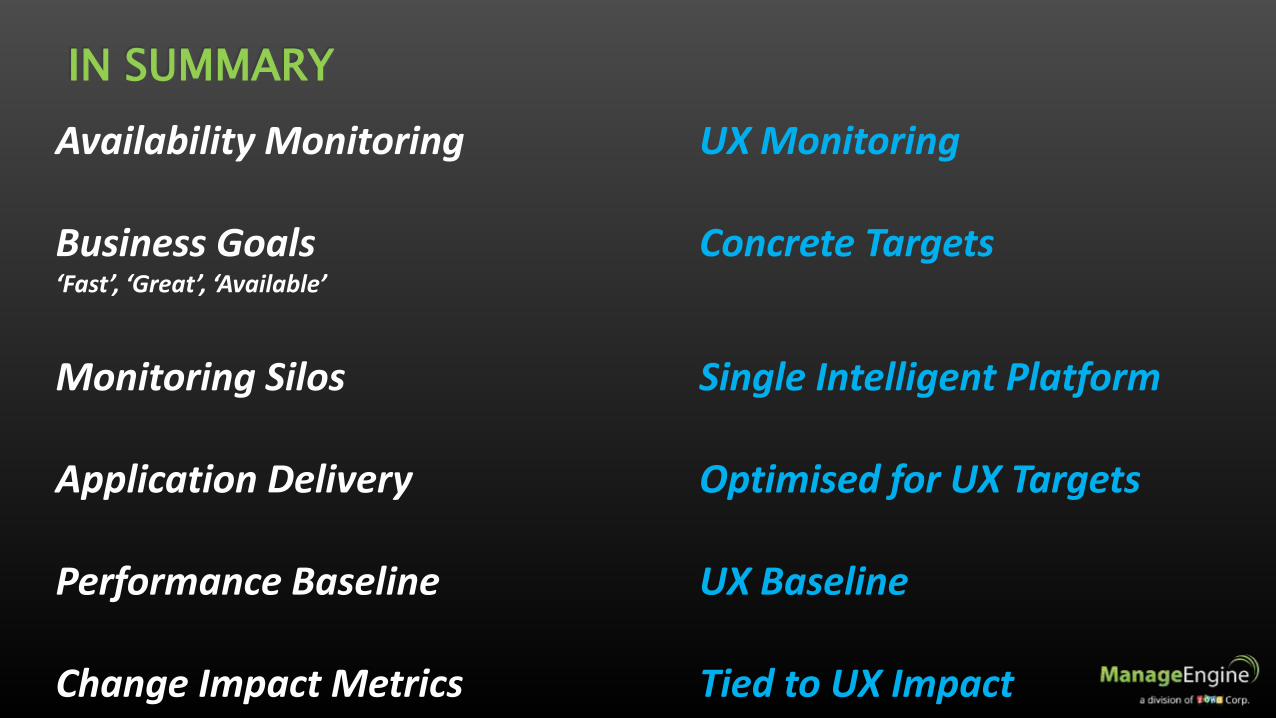
IN SUMMARY
Availability Monitoring
Business Goals‘Fast’, ‘Great’, ‘Available’
Monitoring Silos
Application Delivery
Performance Baseline
Change Impact Metrics
UX Monitoring
Concrete Targets
Single Intelligent Platform
Optimised for UX Targets
UX Baseline
Tied to UX Impact


ManageEngine®
Applications Manager
Application Performance Monitoring in Physical, Virtual & Cloud Environments
Navaneeth Suresh
Product Analyst
Applications Manager
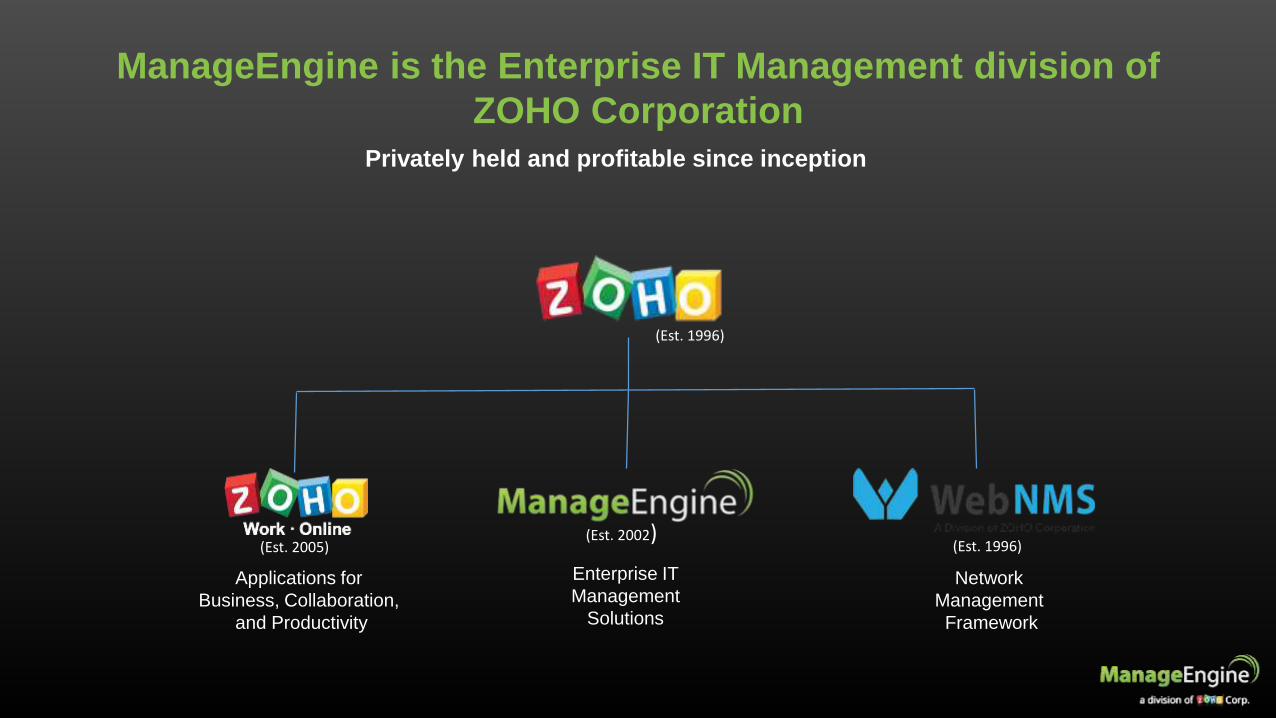
Applications for
Business, Collaboration,
and Productivity
Enterprise IT
Management
Solutions
Network
Management
Framework
(Est. 2005)(Est. 2002)
(Est. 1996)
ManageEngine is the Enterprise IT Management division of
ZOHO CorporationPrivately held and profitable since inception
(Est. 1996)

Active Directory ManagementActive DirectoryExchange ServerSelf-service PortalRecovery and Backup
IT Operations ManagementNetwork PerformanceApplication PerformanceEnd-user ExperienceNetwork Change and ConfigurationConverged Infrastructure Storage InfrastructureBandwidth and Traffic
On DemandApplication Performance Helpdesk SoftwareActive Directory Recovery and Backup
IT Service ManagementHelp Desk
Asset LifecycleCMDB and ITIL
Customer Support
IT SecurityLog ManagementFirewall Analysis
Vulnerability AnalysisPrivileged Password
Network Anomaly Detection
Client ManagementDesktops Management
MDM and BYOD PoliciesOS Deployments
ManageEngine Solutions
Virtualization & Cloud Monitoring
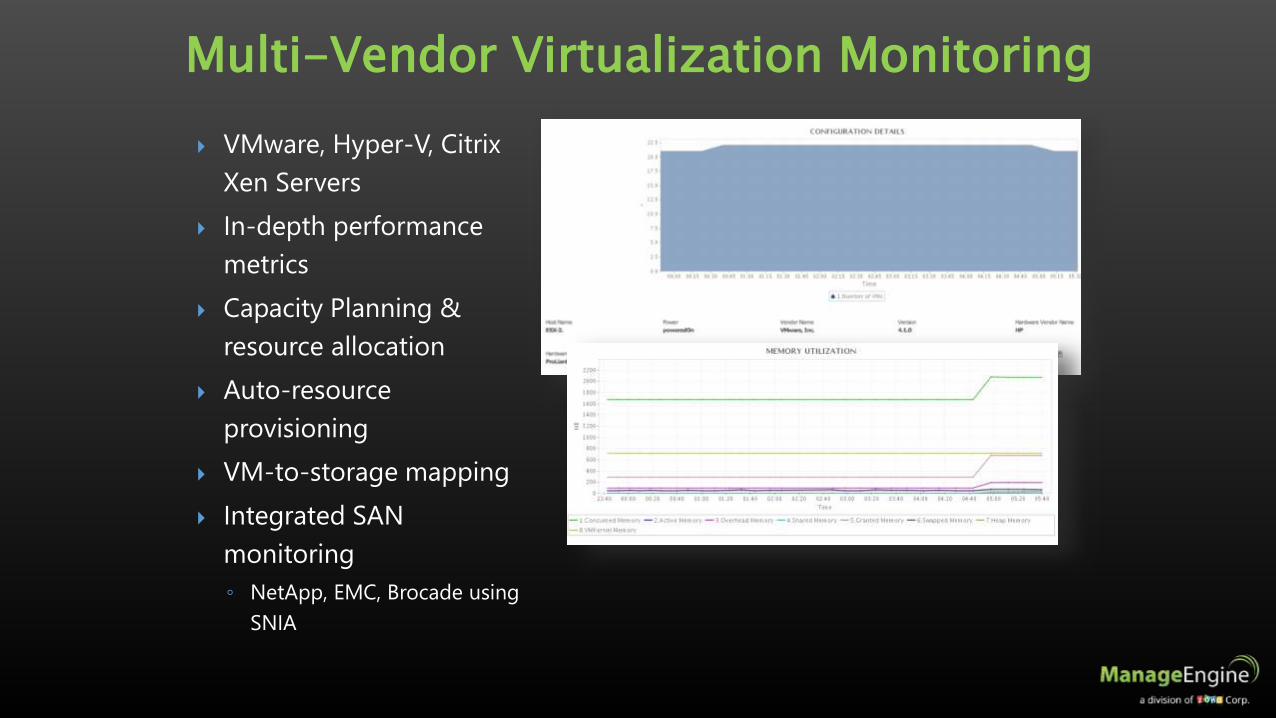
Multi-Vendor Virtualization Monitoring
VMware, Hyper-V, Citrix
Xen Servers
In-depth performance
metrics
Capacity Planning &
resource allocation
Auto-resource
provisioning
VM-to-storage mapping
Integrated SAN
monitoring
◦ NetApp, EMC, Brocade using
SNIA

VM-to-Physical Storage Mapping
Display relationships between VMware vSphere servers, VMs
and storage arrays.
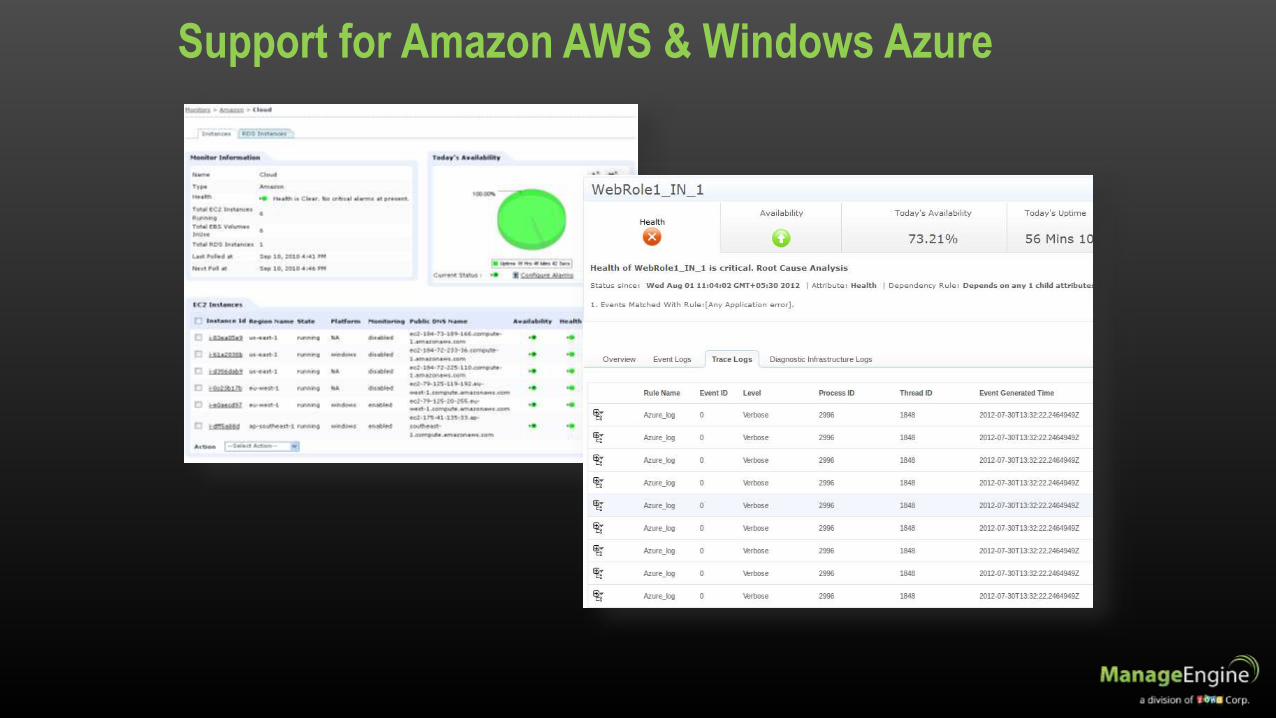
Support for Amazon AWS & Windows Azure
Transaction Monitoring

Web Transaction Monitoring
Apdex scores
Database metrics
URL to SQL
Transaction
tracing
Support for Java, .NET, and Ruby on Rails transactions

Application Overview
36
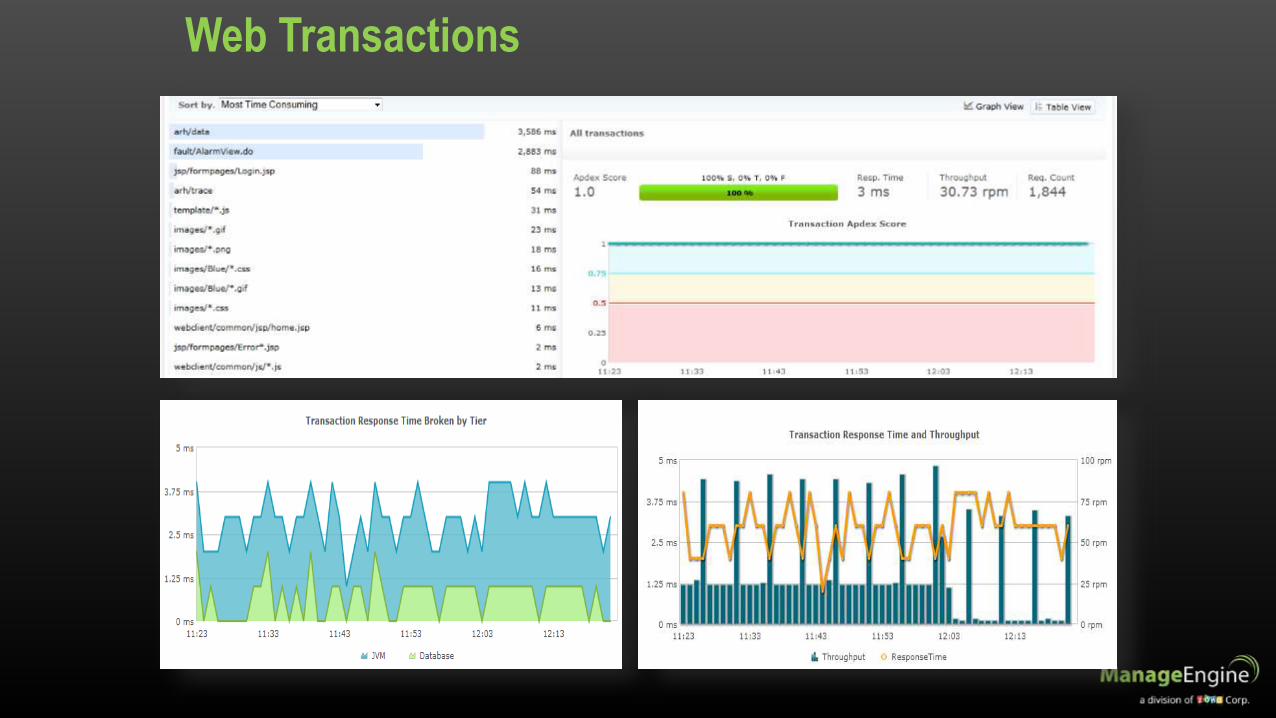
Web Transactions

Slow Transactions
Which web transactions are the slowest? Why are they slow?

Transaction Traces
Identify which component is causing the performance slow down

39
Database Operations
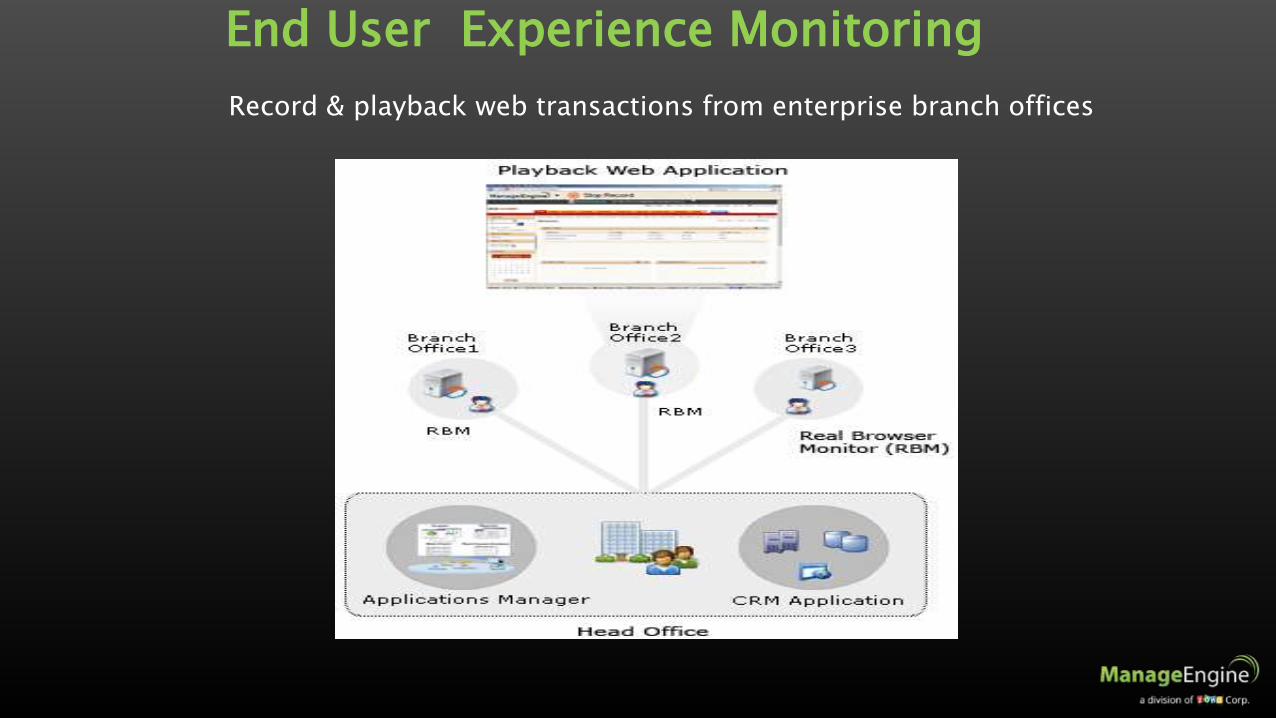
End User Experience Monitoring
Record & playback web transactions from enterprise branch offices
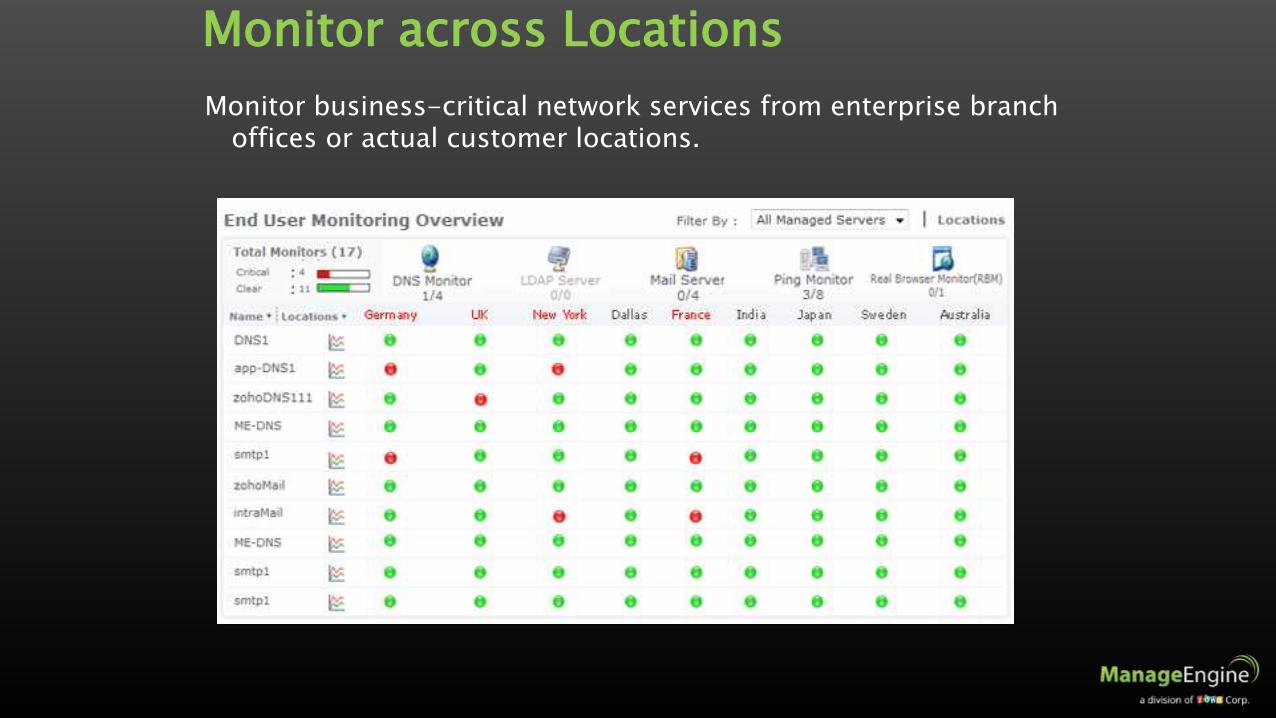
Monitor across Locations
Monitor business-critical network services from enterprise branch offices or actual customer locations.

EUM - Sample Performance Metrics
Response times
Outage trends
Health
Availability
Value:
Measure end-user experience of network services & apps
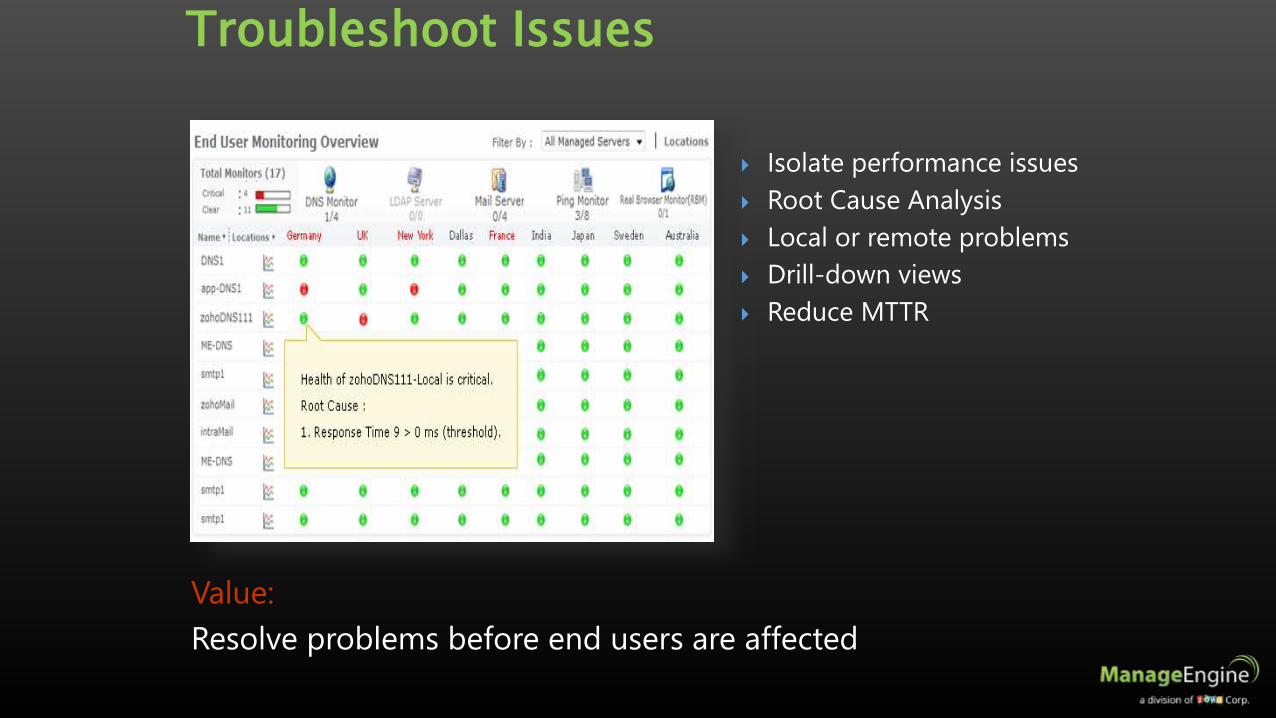
Troubleshoot Issues
Isolate performance issues
Root Cause Analysis
Local or remote problems
Drill-down views
Reduce MTTR
Value:
Resolve problems before end users are affected

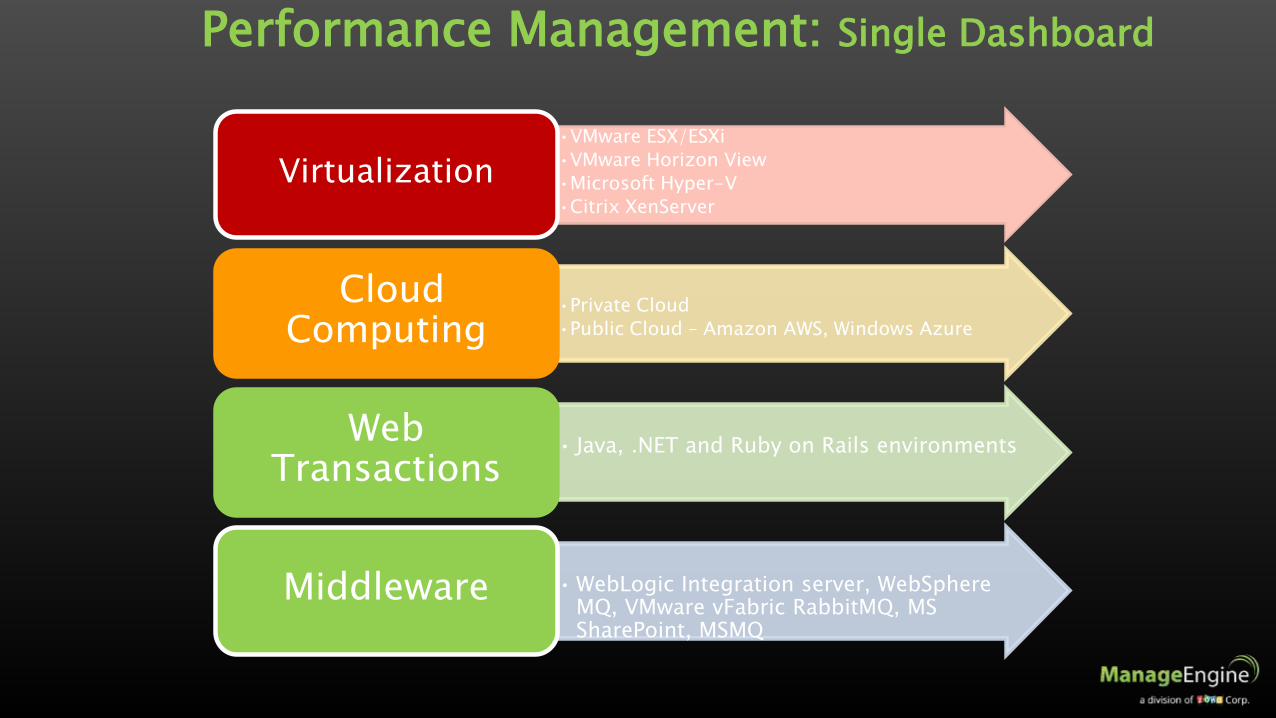
Performance Management: Single Dashboard
•WebLogic, WebSphere, Oracle AS, JBoss, Microsoft .NET, Tomcat, SilverStream, GlassFish, VMware vFabric tc Server
Application Servers
•Windows, Linux, AIX, AS/400, iSeries, HP UX, Mac, Solaris, Novell
Servers
•Oracle, Sybase, MS SQL, DB2, MySQL, PostgreSQL, Memcached, Cassandra, MongoDB, Redis
Databases
•SAP, Oracle EBS, Siebel CRMERP
•JMX, SNMP, WMI, Scripts, Java RuntimesCustom
Applications
Performance Management: Single Dashboard
•VMware ESX/ESXi
•VMware Horizon View
•Microsoft Hyper-V
•Citrix XenServer
Virtualization
•Private Cloud
•Public Cloud – Amazon AWS, Windows Azure
Cloud Computing
• Java, .NET and Ruby on Rails environmentsWeb
Transactions
• WebLogic Integration server, WebSphere MQ, VMware vFabric RabbitMQ, MS SharePoint, MSMQ
Middleware

APM on the Cloud

APM on the Cloud with Site24x7.com (SaaS)
Availability reports
50+ monitoring
locations
Single alarm console
Auto-sync of monitor
groups between
Site24x7 &
Applications Manager
Value:
Monitor website performance from both inside and outside the data center

Editions: From SMBs to Large enterprises
Professional
•For SMBs
• Integrated performance monitoring for heterogeneous set of apps
Enterprise• For large
enterprises
• All features of Professional + failover, distributed architecture & high scalability.

Other points to note:
REST APIs
Native apps for Android & iOS devices
Multi-user access
Different roles for users - Admin, Operator,
Manager, User
Flexible licensing & pricing options
Professional Edition starts $795 per year
Supports subscription & perpetual licensing
Active user community
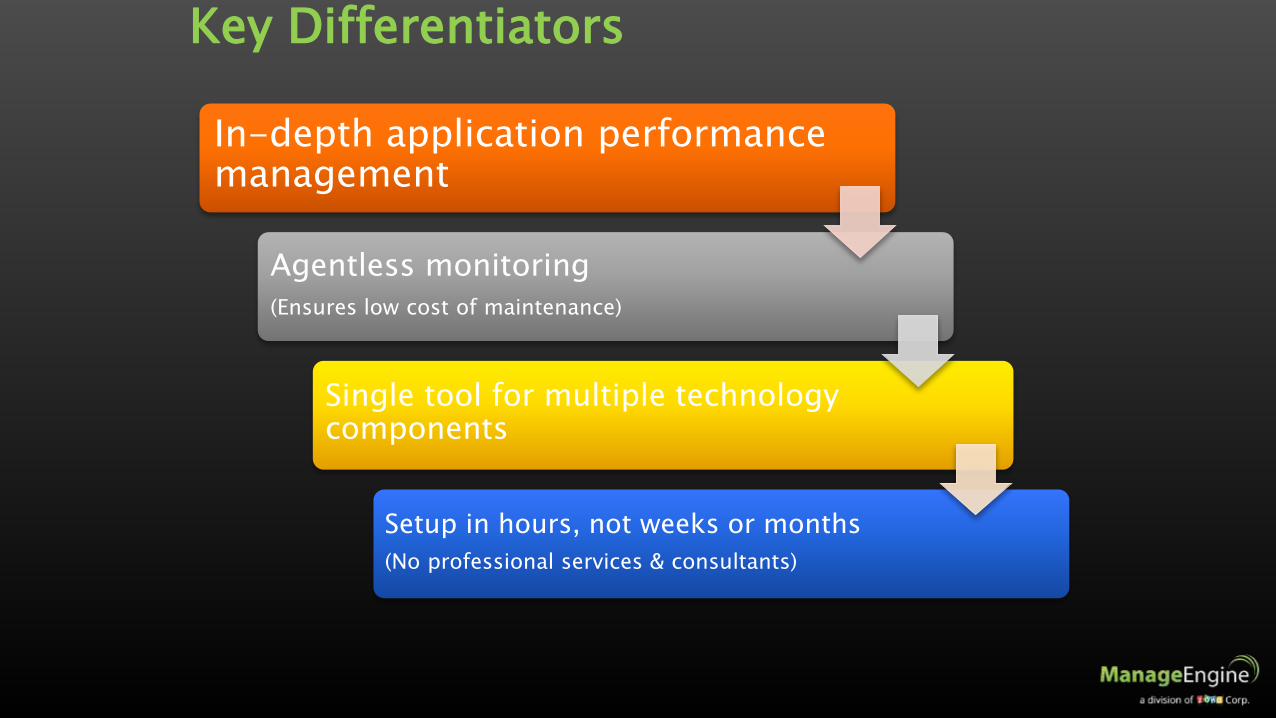
Key Differentiators
In-depth application performance management
Agentless monitoring
(Ensures low cost of maintenance)
Single tool for multiple technology components
Setup in hours, not weeks or months
(No professional services & consultants)
IT Management, SimplifiedReal-time IT management solutions for the new speed of business